. 2023 Feb 7;120(6):e2211368120.
doi: 10.1073/pnas.2211368120. Epub 2023 Feb 2.

Clathrin mediates both internalization and vesicular release of triggered T cell receptor at the immunological synapse

Affiliations

Clathrin mediates both internalization and vesicular release of triggered T cell receptor at the immunological synapse

Audun Kvalvaag et al. Proc Natl Acad Sci U S A. .

Abstract

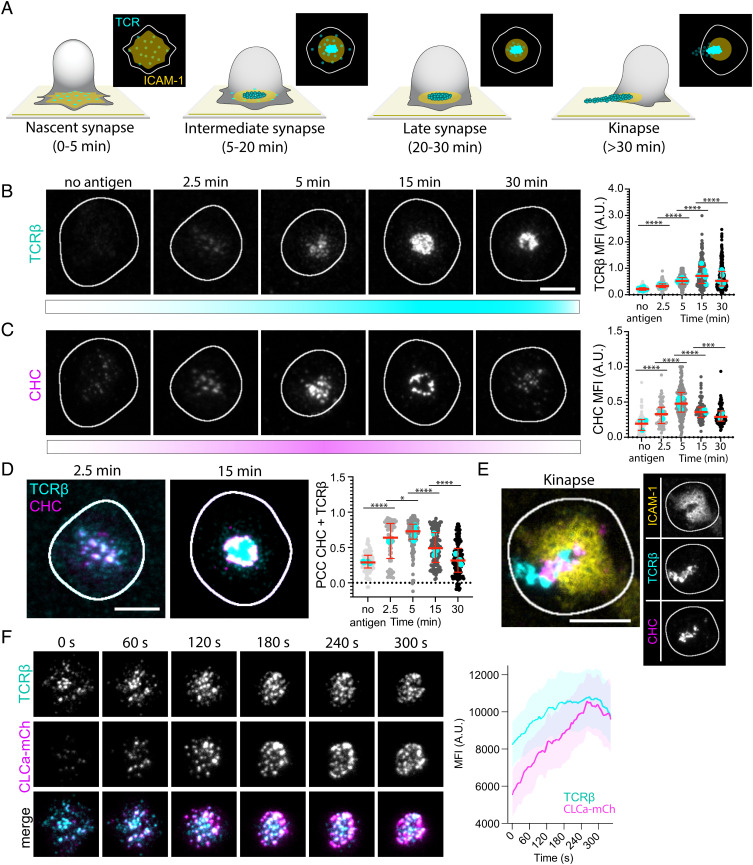
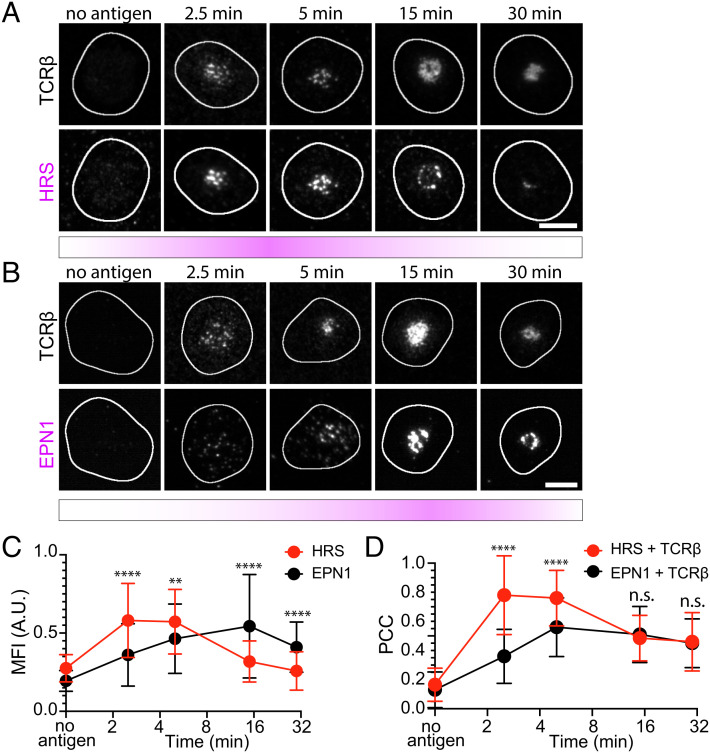
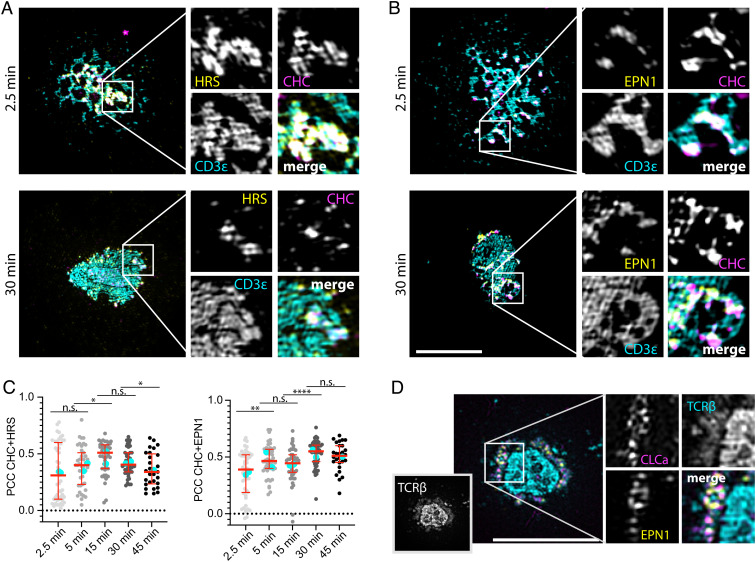
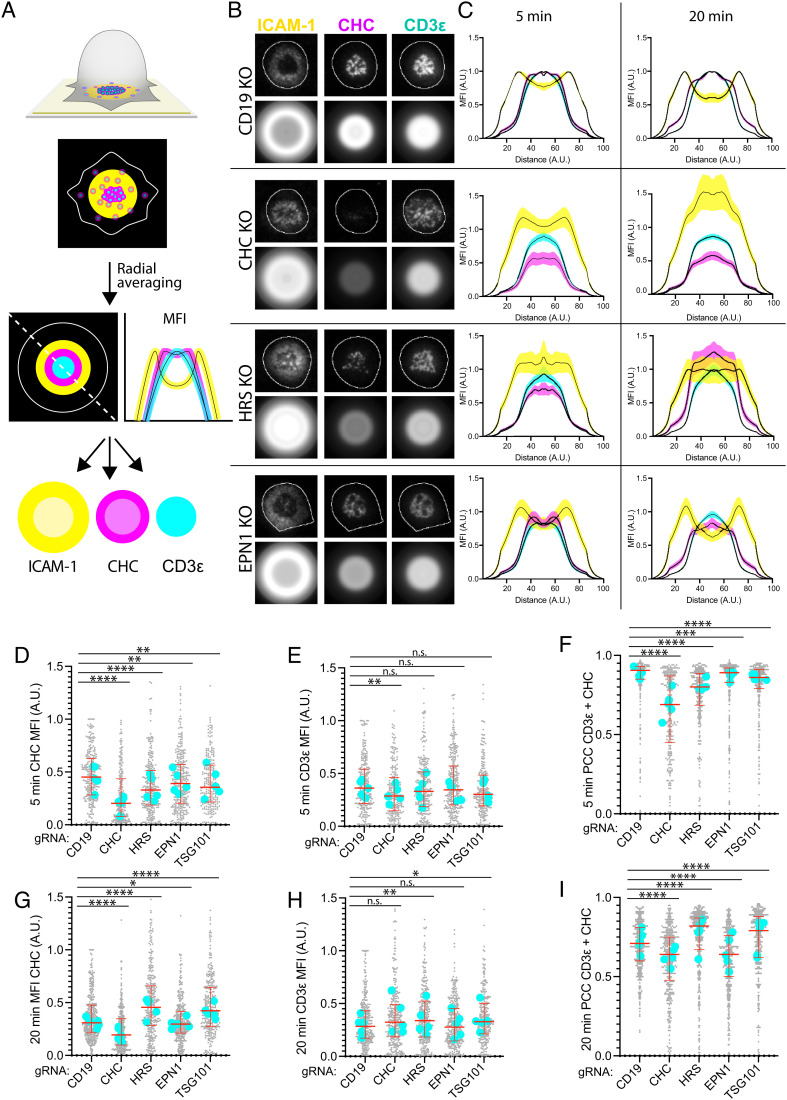
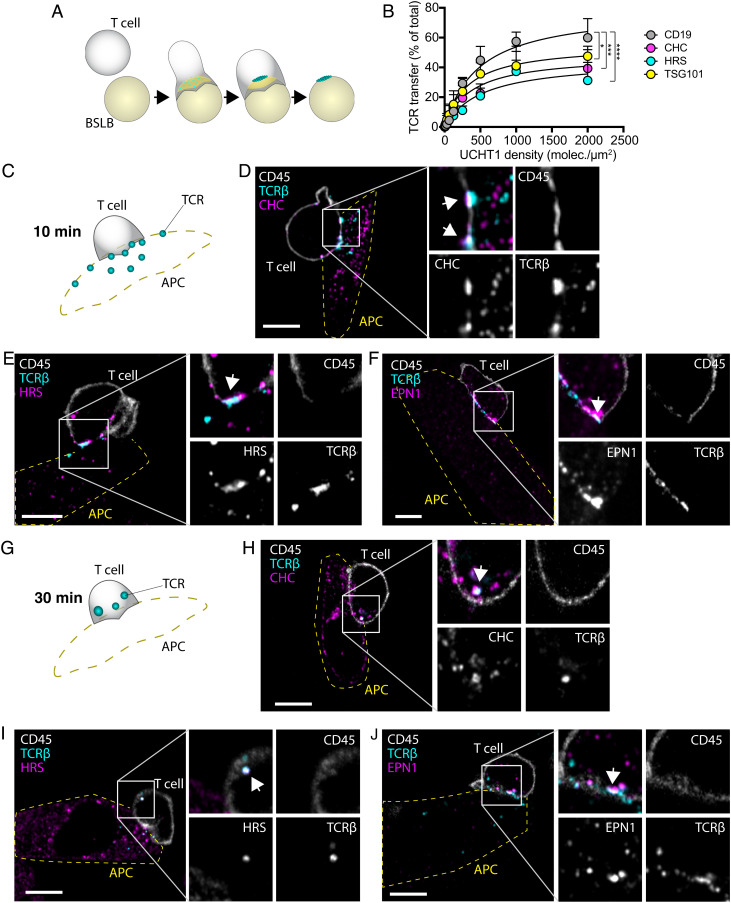
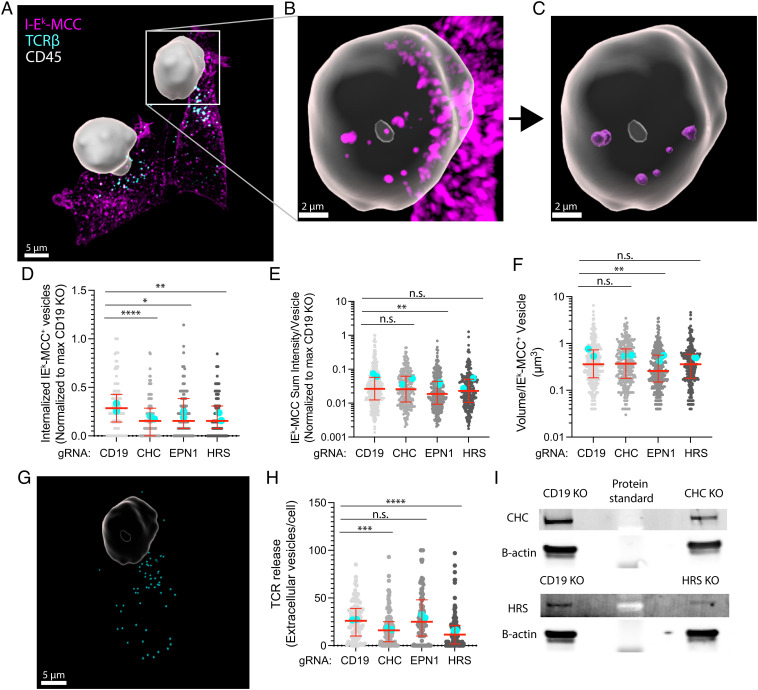
Ligation of T cell receptor (TCR) to peptide-MHC (pMHC) complexes initiates signaling leading to T cell activation and TCR ubiquitination. Ubiquitinated TCR is then either internalized by the T cell or released toward the antigen-presenting cell (APC) in extracellular vesicles. How these distinct fates are orchestrated is unknown. Here, we show that clathrin is first recruited to TCR microclusters by HRS and STAM2 to initiate release of TCR in extracellular vesicles through clathrin- and ESCRT-mediated ectocytosis directly from the plasma membrane. Subsequently, EPN1 recruits clathrin to remaining TCR microclusters to enable trans-endocytosis of pMHC-TCR conjugates from the APC. With these results, we demonstrate how clathrin governs bidirectional membrane exchange at the immunological synapse through two topologically opposite processes coordinated by the sequential recruitment of ecto- and endocytic adaptors. This provides a scaffold for direct two-way communication between T cells and APCs.

Keywords: clathrin; ectocytosis; endocytosis; receptors; synapse.


Conflict of interest statement

The authors declare no competing interest.

Figures

Fig. 1.
Fig. 1.
Clathrin is recruited to the IS. (A) Schematic of the different maturation stages of the IS formed between a T cell and an SLB. ICAM-1 (yellow) forms the adhesion ring, and TCRβ microclusters (cyan) reach the center of the contact area where some are released as synaptic ectosomes that are left behind as symmetry breaking allows the T cell to relocate. (B and C) Representative TIRF micrographs of AND mCD4 T cells incubated on SLBs either with ICAM-1-AF405 (200/µm2) alone for 5 min or with ICAM-1-AF405 + I-Ek-MCC (20/µm2) for 2.5, 5, 15, and 30 min and labeled with anti-mouse TCRβ and anti-CHC. Ncells ≥ 62 per time point. (Scale bar, 5 µm.) The Right panels are quantifications of the MFI of TCRβ and CHC across the synaptic interface. Lines are median value ± IQR, and cyan dots are average values from individual experiments. (D) Representative TIRF micrographs emphasizing the colocalization between CHC (magenta) and TCRβ (cyan) at 2.5 min and 15 min. The Right panel is quantification of the PCC between CHC and TCRβ across the synaptic interface from the micrographs in BD. (E) Representative TIRF micrograph of a kinapse formed by an AND T cell incubated for 30 min on an SLB with ICAM-1-AF405 (yellow) + IEk-MCC as before. Note how CHC (magenta) is overlapping with TCRβ (cyan) in the region where the pSMAC is broken. (F) Representative time frames from a movie of a live mCD4 AND T cell expressing CLCa-mCherry (magenta) while forming an IS on an SLB with ICAM-1-AF405 (200/µm2) and I-Ek-MCC (50/µm2). The TCR is labeled with anti-TCRβ (cyan). The Right panel is mean temporal fluorescence intensity traces ± SEM of TCR microclusters with overlapping CLCa-mCherry fluorescence. Ncells = 5.
Fig. 2.
Fig. 2.
HRS and EPN1 are recruited to the IS at different stages of synapse maturation. (A) Representative TIRF micrographs of AND mCD4 T cells incubated on SLBs either with ICAM-1-AF405 (200/µm2) alone for 5 min or with ICAM-1-AF405 + I-Ek-MCC (20/µm2) for 2.5, 5, 15, and 30 min and labeled with anti-mouse TCRβ and anti-HRS. Ncells ≥ 65 per time point. (Scale bar, 5 µm.) (B) Representative TIRF micrographs of AND mCD4 T cells incubated on SLBs either with ICAM-1-AF405 (200/µm2) alone for 5 min or with ICAM-1-AF405 + I-Ek-MCC (20/µm2) for 2.5, 5, 15, and 30 min and labeled with anti-mouse TCRβ and anti-EPN1. Ncells ≥ 60 per time point. (Scale bar, 5 µm.) (C and D) Direct comparison of the temporal MFI of HRS and EPN1 at 2.5, 5, 15, and 30 min relative to the max intensity of each protein at 5 min (C), and the temporal PCC between HRS and TCRβ compared to the temporal PCC of EPN1 and TCRβ (D) from the micrographs in A and B. Lines are median ±SD.
Fig. 3.
Fig. 3.
HRS and EPN1 colocalize with clathrin at TCR microclusters. (A and B) Representative TIRF–SIM micrographs of hCD4 T cells incubated on SLBs with ICAM-1-AF405 (200/µm2) + anti-CD3ε UCHT1-AF488 (cyan, 30/µm2) for the indicated times and labeled with anti-CHC (magenta) and anti-HRS (A, yellow) or anti-EPN1 (B, yellow). (C) Quantification of the temporal PCC between CHC and HRS or EPN1 across the synaptic interface. Ncells ≥ 26. (Scale bar, 5 µm.) Lines are median value ± IQR, and cyan dots are average values from individual experiments. (D) Representative TIRF–SIM micrograph of an AND mCD4 T cell expressing CLCa-mCherry (magenta) incubated on SLB with ICAM-1-AF405 (200/µm2) + I-Ek-MCC (20/µm2) for 20 min, fixed, permeabilized, and labeled with anti-TCRβ (cyan) and anti-EPN1 (yellow). (Scale bar, 5 µm.)
Fig. 4.
Fig. 4.
HRS and EPN1 recruit clathrin to the IS in a sequential manner. (A) Schematic of radial averaging of micrographs of the IS formed between a T cell and an SLB. ICAM-1 is labeled yellow, TCR cyan, and CHC magenta. The dashed line and the line plots represent a diagonal measurement of the positional MFI of the individual channels. (B) Representative TIRF micrographs and corresponding radial averages of hCD4 CD19, CHC, HRS, and EPN1 KO T cells incubated on SLBs with ICAM-1-AF405 (200/µm2) and anti-CD3ε UCHT1-AF488 (30/µm2) for 5 min. (C) Radial averages of hCD4 CD19, CHC, HRS, and EPN1 KO T cells incubated on the SLBs from B for 5 and 20 min. The MFI represents MFI from five individual experiments ± SEM. (DI) Quantification of the MFI of CHC (D and G), CD3ε (E and H), and the PCC between CHC and CD3ε (F and I) across the synaptic interface from hCD4 CD19, CHC, HRS, EPN1, and TSG101 KO T cells incubated on the SLBs from B for 5 and 20 min. Ncells ≥ 219 per condition. Lines are median ± IQR, and cyan dots are median values from individual experiments.
Fig. 5.
Fig. 5.
Clathrin and HRS are required for transfer of TCR loaded vesicles. (A) Schematic of vesicular transfer from T cells to BSLBs with ICAM-1 (yellow) and UCHT1 (cyan). As the TCR microclusters reach the center of the contact area, they are released as synaptic ectosomes which are left behind as the T cell detaches from the bead. (B) Quantification of the fluorescence intensity of beads with immunolabeled TCR transferred from CD19, CHC, HRS, and TSG101 KO hCD4 T cells at increasing UCHT1 densities. The dots represent MFI ± SEM of the beads relative to the sum MFI of the beads and the cells from three experiments. The P values were calculated with the F test. (CJ) Illustrations and micrographs of slices from Airyscan® Z-stacks with a step size of 250 nm of mCD4 AND T cells incubated with CHO-I-Ek APCs for 10 min (CF) and 30 min (GJ) and immunolabeled with anti-CD45, anti-TCRβ, and anti-CHC, anti-HRS, or anti-EPN1. The outline of the APCs is indicated with a yellow dashed line. White arrows indicate overlap between TCRβ and CHC, HRS, or EPN1. (Scale bar, 5 µm.)
Fig. 6.
Fig. 6.
Clathrin, HRS, and EPN1 regulate pMHC–TCR trans-endocytosis. (AC) Imaris 3D reconstructed micrographs of spinning disc confocal Z-stacks with a step size of 250 nm of mCD4 AND T cells incubated with CHO-I-Ek APCs for 30 min and immunolabeled with anti-CD45 (white), anti-TCRβ (cyan), and anti-I-Ek-MCC (magenta). The CD45 signal has been used to create a mask of the T cell. (DF) Quantification of the number of internalized I-Ek-MCC–positive vesicles per cell (D), sum I-Ek-MCC fluorescence intensity per vesicle (E), and volume per I-Ek-MCC–positive vesicle (F) following KO of CD19, CHC, EPN1, or HRS in mCD4 AND cells incubated for 30 min on CHO-I-Ek APCs. Ncells ≥ 111 per condition. Lines are median value ± IQR, and cyan dots are average values from individual experiments. (G) Segmented TCR-positive vesicles (cyan) released from one of the mCD4 T cells from (A). (H) Quantification of the number of released TCR-positive vesicles per cell. (I) A representative WB of the protein levels of CHC, HRS, and β-actin from one experiment following CHC and HRS KO.

References

    1. Dustin M. L., The immunological synapse. Cancer Immunol. Res. 2, 1023–1033 (2014), 10.1158/2326-6066.CIR-14-0161. - DOI - PMC - PubMed
    1. Huppa M. M., Davis T., T-cell-antigen recognition and the immunological synapse. Nat. Rev. Immunol. 3, 973–983 (2003), 10.1038/nri1245. - DOI - PubMed
    1. Dustin M. L., Starr T., Varma R., Thomas V. K., Supported planar bilayers for study of the immunological synapse. Curr. Protoc. Immunol. 18, 18.13.1–18.13.35 (2007), 10.1002/0471142735.im1813s76. - DOI - PubMed
    1. Grakoui A., et al. , The immunological synapse: A molecular machine controlling T cell activation. Science 285, 221–227 (1999), 10.1126/science.285.5425.221. - DOI - PubMed
    1. Freiberg B. A., et al. , Staging and resetting T cell activation in SMACs. Nat. Immunol. 3, 911–917 (2002), 10.1038/ni836. - DOI - PubMed

Publication types