

Diagnostic accuracy of magnetic resonance elastography and point-shear wave elastography for significant hepatic fibrosis screening: Systematic review and meta-analysis
- PMID: 36730265
- PMCID: PMC9894488
- DOI: 10.1371/journal.pone.0271572
Diagnostic accuracy of magnetic resonance elastography and point-shear wave elastography for significant hepatic fibrosis screening: Systematic review and meta-analysis
Abstract
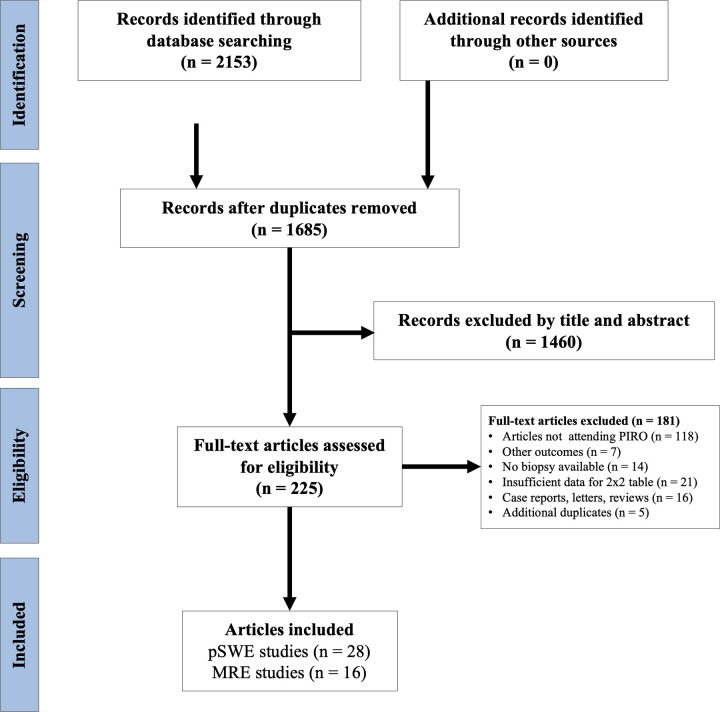
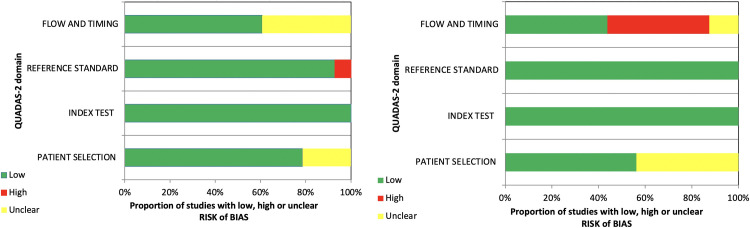
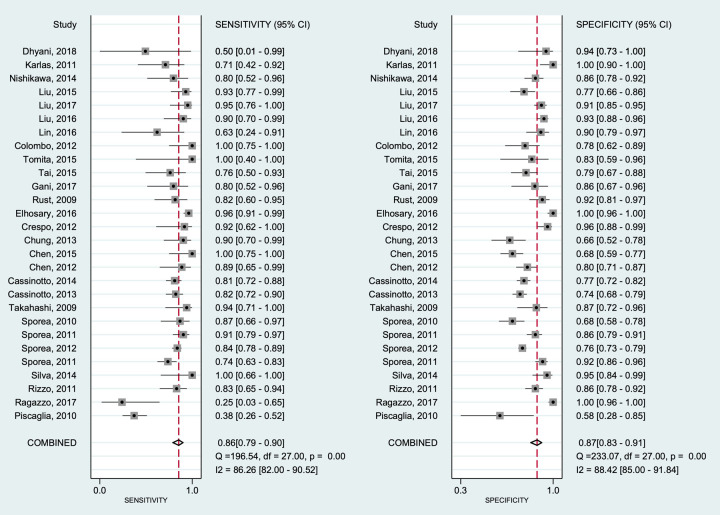
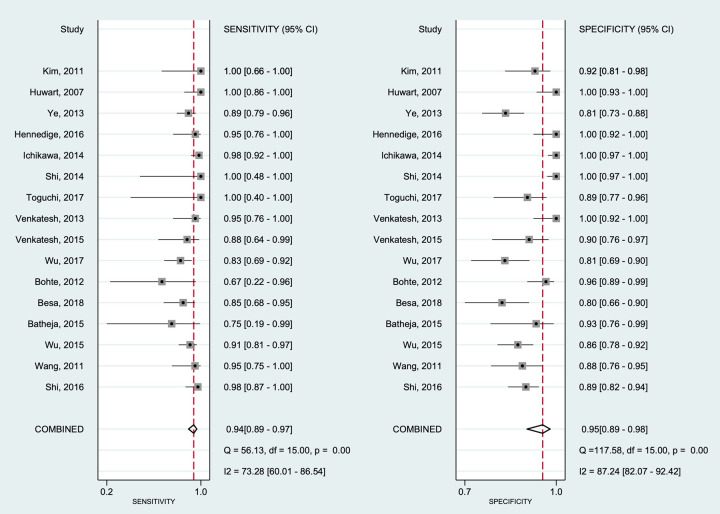
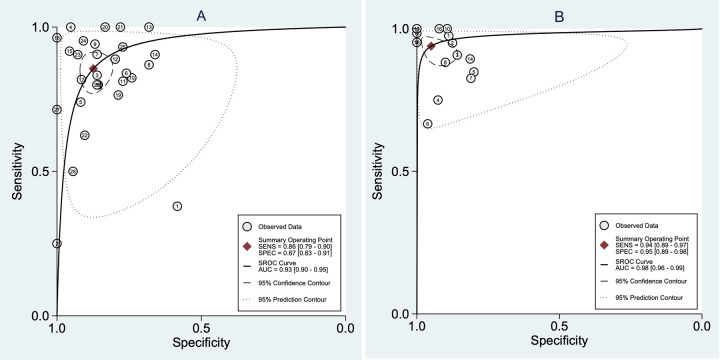
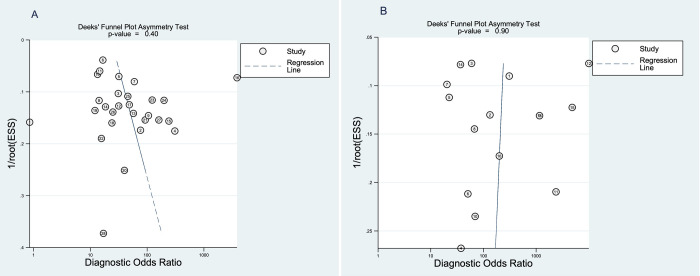
The hepatic diseases are extremely common in clinical practice. The correct classification of liver fibrosis is extremely important, as it influences therapy and predicts disease outcomes. The purpose of this study is to compare the diagnostic performance of point-shear wave elastography (pSWE) and magnetic resonance elastography (MRE) in the hepatic fibrosis diagnostic. A meta-analysis was carried out based on articles published until October 2020. The articles are available at following databases: MEDLINE, EMBASE, Cochrane Central Register of Controlled Trials, Scientific Electronic Library Online, LILACS, Scopus, and CINAHL. Diagnostic performances were analyzed per METAVIR F2, using 3.5kPa as target fibrosis. Assessment of the methodological quality of the incorporated papers by the QUADAS-2 tool for pSWE and MRE. A total 2,153 studies articles were evaluated and 44 studies, comprising 6,081 patients with individual data, were included in the meta-analysis: 28 studies for pSWE and 16 studies for MRE. The pooled sensitivity and specificity were 0.86 (95%CI 0.80-0.90) and 0.88 (95%CI 0.85-0.91), respectively, for pSWE, compared with 0.94 (95%CI 0.89-0.97) and 0.95 (95%CI 0.89-0.98) respectively, for MRE. The pooled SROC curve for pSWE shows in the area under the curve (AUC) of 0.93 (95%CI 0.90-0.95), whereas the AUC for MRE was 0.98 (95%CI 0.96-0.99). The diagnostic odds ratio for pSWE and MRE were 41 (95%CI 24-72) and 293 (95%CI 86-1000), respectively. There was statistically significant heterogeneity for pSWE sensitivity (I² = 85.26, P<0.001) and specificity (I² = 89.46, P<0.001). The heterogeneity for MRE also was significant for sensitivity (I² = 73.28, P<0.001) and specificity (I² = 87.24, P<0.001). Therefore, both pSWE and MRE are suitable modalities for assessing liver fibrosis. In addition, MRE is a more accurate imaging technique than pSWE and can be used as alternative to invasive biopsy.
Copyright: © 2023 Schambeck et al. This is an open access article distributed under the terms of the Creative Commons Attribution License, which permits unrestricted use, distribution, and reproduction in any medium, provided the original author and source are credited.
Conflict of interest statement
The authors have declared that no competing interests exist.
Figures
References
-
- Asrani SK, Devarbhavi H, Eaton J, Kamath PS. Burden of liver diseases in the world. J Hepatol. 2019;70(1):151–171. https://linkinghub.elsevier.com/retrieve/pii/S0168827818323882. doi: 10.1016/j.jhep.2018.09.014 - DOI - PubMed
-
- Tsochatzis EA, Gurusamy KS, Ntaoula S, Cholongitas E, Davidson BR, Burroughs AK. Elastography for the diagnosis of severity of fibrosis in chronic liver disease: A meta-analysis of diagnostic accuracy. J Hepatol. 2011;54(4):650–659. https://linkinghub.elsevier.com/retrieve/pii/S0168827810008251. doi: 10.1016/j.jhep.2010.07.033 - DOI - PubMed
-
- Castera L, Forns X, Alberti A. Non-invasive evaluation of liver fibrosis using transient elastography. J Hepatol. 2008;48(5):835–847. https://linkinghub.elsevier.com/retrieve/pii/S0168827808001232. doi: 10.1016/j.jhep.2008.02.008 - DOI - PubMed
-
- Asrani SK, Talwalkar JA. Magnetic Resonance Elastography of the Liver. Diagnostic Methods Cirrhosis Portal Hypertens. Cham: Springer International Publishing; 2018. p. 225–238. http://link.springer.com/10.1007/978-3-319-72628-1_15. - DOI
-
- Pavlides M, Banerjee R, Sellwood J, et al. Multiparametric magnetic resonance imaging predicts clinical outcomes in patients with chronic liver disease. J Hepatol. 2016;64(2):308–315. https://linkinghub.elsevier.com/retrieve/pii/S0168827815006807. doi: 10.1016/j.jhep.2015.10.009 - DOI - PMC - PubMed
Publication types
MeSH terms
LinkOut - more resources
Full Text Sources
Medical
Miscellaneous
