. 2023 Feb 2;18(2):e0278455.
doi: 10.1371/journal.pone.0278455. eCollection 2023.

Biomechanics of keratoconus: Two numerical studies

Affiliations

Biomechanics of keratoconus: Two numerical studies

Nicolas Falgayrettes et al. PLoS One. .

Abstract

Background: The steep cornea in keratoconus can greatly impair eyesight. The etiology of keratoconus remains unclear but early injury that weakens the corneal stromal architecture has been implicated. To explore keratoconus mechanics, we conducted two numerical simulation studies.

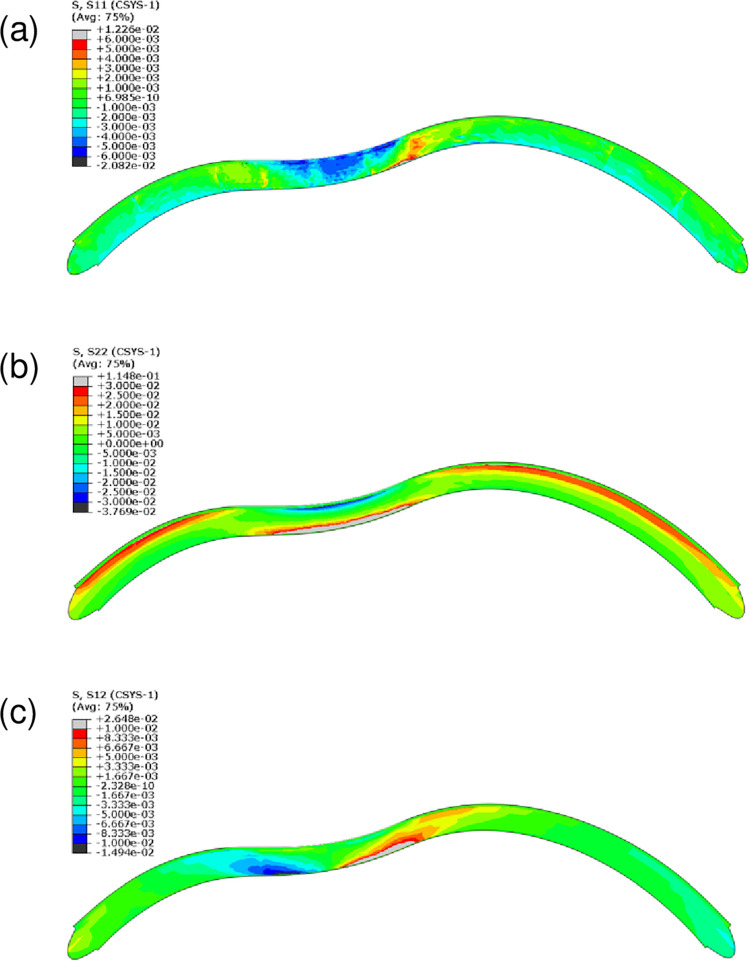
Methods: A finite-element model describing the five corneal layers and the heterogeneous mechanical behaviors of the ground substance and lamellar collagen-fiber architecture in the anterior and posterior stroma was developed using the Holzapfel-Gasser-Ogden constitutive model. The geometry was from a healthy subject. Its stroma was divided into anterior, middle, and posterior layers to assess the effect of changing regional mechanical parameters on corneal displacement and maximum principal stress under intraocular pressure. Specifically, the effect of softening an inferocentral corneal button, the collagen-based tissues throughout the whole cornea, or specific stromal layers in the button was examined. The effect of simply disorganizing the orthogonally-oriented posterior stromal fibers in the button was also assessed. The healthy cornea was also subjected to eye rubbing-like loading to identify the corneal layer(s) that experienced the most tensional stress.

Results: Conical deformation and corneal thinning emerged when the corneal button or the mid-posterior stroma of the button underwent gradual softening or when the collagen fibers in the mid-posterior stroma of the button were dispersed. Softening the anterior layers of the button or the whole cornea did not evoke conical deformation. Button softening greatly increased and disrupted the stress on Bowman's membrane while mid-posterior stromal softening increased stress in the anterior layers. Eye rubbing profoundly stressed the deep posterior stroma while other layers were negligibly affected.

Discussion: These observations suggest that keratoconus could be initiated, at least partly, by mechanical instability/damage in the mid-posterior stroma that then imposes stress on the anterior layers. This may explain why subclinical keratoconus is marked by posterior but not anterior elevation on videokeratoscopy.


Conflict of interest statement

The authors have declared that no competing interests exist.

Figures

Fig 1
Fig 1. Schematic depiction of the cornea in cross-section that shows the hypothetical microstructural changes in the stroma that may lead to keratoconus onset and progression.
(a) Healthy cornea. (b) Our hypothesized very early stage keratoconus, which is characterized by a few cross-link breakages in the deep posterior stroma that disrupt the local lamellar organization and induce posterior elevation. (c) An hypothesized later stage in which cross-link breakages have accumulated and spread into the mid stroma. Mid-posterior stromal lamellar disorganization has become more pronounced and epithelial thinning and deformation is now evident. (d) Advanced keratoconus exhibiting critical failure of the stromal microstructure and collagen fiber breaks in Bowman’s membrane that result in epithelial outgrowth. Blue bars/bricks = lamellae. Red dashes = interlamellar cross-links generated by ground substance.
Fig 2
Fig 2. The model geometry.
(a) Two-dimensional depiction showing the division of the stromal layer of the cornea into three areas that bear their own specific collagen architecture, namely, the central corneal stroma (yellow), the peripheral corneal stroma (green), and the transitional middle area in between (blue). The arrows in the inset figure show the predominant orientations of the lamellae in the anterior stroma (fully dispersed), middle stroma (moderately dispersed), and) posterior stroma (perfectly aligned without any dispersion). In the green zone, the collagen fibers arriving from the corneal center curve to provide annular reinforcement at the corneal edge (not depicted). (b) Three-dimensional depiction of the preferential organization of the collagen lamellae in the posterior stroma, namely, a predominant orthogonal fiber orientation that eventually curves to provide annular reinforcement at the limbus.
Fig 3
Fig 3. Generation of a softened button at the inferocentral zone of the model cornea (a, b) and its effect on vertical corneal displacement (U, U2, mm) (c, d) and stress (MPa) on Bowman’s membrane (e, f).
(a, b) New subdivisions were added to the model geometry shown in Fig 2A to create a button in the inferocentral area. The button is shown from the anterior view (a) and in cross-section (b). It is composed of three concentric zones, namely, the button center (dark-pink in b), middle (red), and periphery (brown). The yellow tissue is the remaining (non-button) central cornea while the green tissue represents the peripheral cornea, which displays different stromal collagen behavior (curving around the corneal edge as an annular reinforcement). The blue tissue is the transition area between the central and peripheral cornea. Bowman’s membrane is shown in light purple. The epithelial layer, Descemet’s membrane, and the endothelial cell layer were included in the cornea model but are not shown here. (c–f) Bowman’s membrane and all stromal layers in the button were softened in a gradient so that the button center was the softest of the three concentric zones. To achieve this, μ (ground-substance stiffness) and k1 (collagen-fiber stiffness) of all layers in the button center (pink in b) were divided by 30. This was repeated for the button middle (red in b) and periphery (brown in b) but with increasingly smaller divisors, namely, 20 and 10, respectively. The cornea bearing this 30-20-10-softened button (d, f), and the unsoftened healthy cornea (c, e), were then subjected to normal intraocular pressure. (c–d) The vertical corneal displacement of the corneas is shown in mm. The red zones demonstrate the greatest displacement and the blue zones the least. (e–f) Directions and intensity of maximum principal tensional stress (MPa) on Bowman’s membrane. S, Max. Principal, maximal principal stress.
Fig 4
Fig 4. Graph summarizing the effect of softening specific corneal areas on corneal elevation and thickness.
Summary of the effect of softening the whole cornea (Case 2), a button of corneal tissue (Cases 3–5), or specific corneal layers in the button (Cases 6–10) on the anterior and posterior elevation at the corneal apex (orange and yellow bars, respectively), the anterior and posterior elevation at the button apex (dark and light blue bars, respectively), and loss of corneal thickness (green bars). Cases where the blue bars are higher than the yellow/orange bars indicate keratoconus-like elevation (indicated by *). Note that button elevation is matched by corneal thinning (green bars). Case 1 is the healthy cornea. In Case 2, the whole cornea was softened by dividing μ (ground-substance stiffness) and k1 (collagen-fiber stiffness) throughout the cornea by 3. In Case 3, an inferocentral button of the cornea was gradually softened by dividing both μ and k1 in the central, middle, and peripheral button layers (Bowman’s membrane and anterior, middle, and posterior stroma) by 10, 6.7, and 3.3, respectively. In Cases 4 and 5, button softening was respectively doubled (to 20, 13.3, and 6.7, respectively; + indicates moderately increased softening relative to Case 3) and tripled (to 30, 20, and 10, respectively; ++ indicates greatly increased softening relative to Case 3). In Cases 6–10, the indicated button layer(s) were softened by dividing their μ and k1 values in the button center, middle, and periphery by 30, 20, and 10, respectively (** shows that the indicated layers were softened to the same degree). EDS, Ehlers-Danlos Syndrome-like; KC, keratoconus.
Fig 5
Fig 5. Effect of global or local softening on corneal vertical displacement (U, U2, mm) (a, c, e) and maximal principal strain (LE, Max.
Principal, MPa) (b, d, f) when the cornea is exposed to normal IOP. (a, b) The healthy cornea. (c, d) The cornea bearing an inferocentral button of tissue that was softened with a third of the softening previously applied in Fig 3 (i.e. μ and k1 in Bowman’s membrane and the stromal layers in the button center, middle, and periphery were divided by 10, 6.7, and 3.3, respectively). (e, f) An Ehlers-Danlos-like cornea where the whole cornea was softened by dividing μ and k1 in Bowman’s layer and the stromal layers by 3. Red and blue in (a, c, e) indicate high and low displacement, respectively. Red and blue in (b, d, f) indicate high and low strain, respectively. The position of the cornea without IOP is depicted by the dotted-line shape. The black arrows indicate how much the cornea thins as it deforms under IOP. Avg, average; IOP, intraocular pressure.
Fig 6
Fig 6. Effect of softening specific layers in an inferocentral button of tissue on vertical corneal displacement (U, U2, mm) (c, e, g) and maximal principal strain (S.
Max. Principal, MPa) (d, f, h). Gradual softening in the indicated button layer was achieved by dividing its μ and k1 values in the button center, middle, and periphery by 30, 20, and 10, respectively. (a, b) The healthy cornea. (c, d) Bowman’s membrane and the anterior stroma were softened. (e, f) Bowman’s membrane and the anterior and middle stromal layers were softened. (g, h) The middle and posterior stromal layers were softened. Red and blue in (a, c, e, g) indicate high and low displacement, respectively. Red and blue in (b, d, f, h) indicate high and low strain, respectively. The position of the cornea without IOP is depicted by the dotted-line shape. The black arrows indicate how much the cornea thins as it deforms under intraocular pressure. Avg, average.
Fig 7
Fig 7. Effect of increasing the dispersion of the collagen fibers in the posterior stroma (blue plot) and the posterior and middle stroma (orange plot) of the button on corneal displacement (μm).
Only kappa (fiber dispersion) was changed in the selected layer(s). Note that while the x axis shows only the degree of posterior dispersion, we also conducted a second analysis where the fibers in both the middle and posterior stroma were dispersed (orange plot). For this, kappa in the middle stroma was gradually increased from 0.16 to 0.33. (Kappa of 0 = perfectly aligned fibers; Kappa of 1/3 = fully isotropic fibers).
Fig 8
Fig 8. Depiction of the tension/compression states of the collagen fibers in the anterior and posterior cornea when the cornea is subjected to (a) intraocular pressure alone or (b) external loading such as eye rubbing that bends the cornea inward.
Fig 9
Fig 9. Effect of knuckle and fingertip rubbing on the maximal tensional stress (MPa) throughout the cornea.
(a, b) The cornea depicted in 3 dimensions (a, c) and 2-dimensional cross-section (b, d) to show the effect of rubbing with a rigid knuckle (a–b) or fingertip (c–d) on stress throughout the cornea. In (a and c), the black arrow indicates the direction of knuckle/finger movement. Descemet’s membrane and the endothelium are not displayed in these images. In (b and d), the unstressed cornea is indicated by the fine-line image. In (a–d), red indicates high stress areas. (e) Plot showing the distribution of maximal tensional stress on the various layers of the cornea during knuckle rubbing (blue) and fingertip rubbing (orange). Ant., anterior; Avg, average; Bow, Bowman’s layer; Des. & Endo, Descemet’s membrane and endothelium; Epi., epithelial layer; Mid., middle; Post., posterior; S, Max Principal, maximum principal strain.
Fig 10
Fig 10. Two-dimensional cross-section of the cornea showing the distribution of stresses (MPa) from finger rubbing.
(a) Radial stress (σrr). This indicates the radial tension towards or away from the central axis of the spherical coordinate system. (b) Hoop stress (σθθ). This indicates the circumferential tension in the tangential direction along the cornea. The zone with negative stress (blue) is the compressed anterior zone. The greatest tension is on the most bent zone of the cornea. (c) Shear stress, pushing one part of the structure in one direction and the other in the opposite direction (σrθ). Avg, average.

References

    1. Sridhar MS. Anatomy of cornea and ocular surface. Indian J Ophthalmol. 2018;66: 190–194. doi: 10.4103/ijo.IJO_646_17 - DOI - PMC - PubMed
    1. Chen S, Mienaltowski MJ, Birk DE. Regulation of corneal stroma extracellular matrix assembly. Exp Eye Res. 2015;133: 69–80. doi: 10.1016/j.exer.2014.08.001 - DOI - PMC - PubMed
    1. Morishige N, Takagi Y, Chikama T, Takahara A, Nishida T. Three-dimensional analysis of collagen lamellae in the anterior stroma of the human cornea visualized by second harmonic generation imaging microscopy. Invest Ophthalmol Vis Sci. 2011;52: 911–915. doi: 10.1167/iovs.10-5657 - DOI - PubMed
    1. Ubels DL, Dawson DG, Edelhauser HF. Adler’s physiology of the eye. Elsevier, editor. 2011.
    1. Cheng X, Petsche SJ, Pinsky PM. A structural model for the in vivo human cornea including collagen-swelling interaction. J R Soc Interface. 2015;12: 20150241. doi: 10.1098/rsif.2015.0241 - DOI - PMC - PubMed

Publication types