. 2023 Feb 2;18(2):e0281288.
doi: 10.1371/journal.pone.0281288. eCollection 2023.

Phylogeny analysis of whole protein-coding genes in metagenomic data detected an environmental gradient for the microbiota

Affiliations

Phylogeny analysis of whole protein-coding genes in metagenomic data detected an environmental gradient for the microbiota

Soichirou Satoh et al. PLoS One. .

Abstract

Environmental factors affect the growth of microorganisms and therefore alter the composition of microbiota. Correlative analysis of the relationship between metagenomic composition and the environmental gradient can help elucidate key environmental factors and establishment principles for microbial communities. However, a reasonable method to quantitatively compare whole metagenomic data and identify the primary environmental factors for the establishment of microbiota has not been reported so far. In this study, we developed a method to compare whole proteomes deduced from metagenomic shotgun sequencing data, and quantitatively display their phylogenetic relationships as metagenomic trees. We called this method Metagenomic Phylogeny by Average Sequence Similarity (MPASS). We also compared one of the metagenomic trees with dendrograms of environmental factors using a comparison tool for phylogenetic trees. The MPASS method correctly constructed metagenomic trees of simulated metagenomes and soil and water samples. The topology of the metagenomic tree of samples from the Kirishima hot springs area in Japan was highly similarity to that of the dendrograms based on previously reported environmental factors for this area. The topology of the metagenomic tree also reflected the dynamics of microbiota at the taxonomic and functional levels. Our results strongly suggest that MPASS can successfully classify metagenomic shotgun sequencing data based on the similarity of whole protein-coding sequences, and will be useful for the identification of principal environmental factors for the establishment of microbial communities. Custom Perl script for the MPASS pipeline is available at https://github.com/s0sat/MPASS.


Conflict of interest statement

The authors have declared that no competing interests exist.

Figures
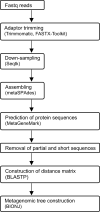
Fig 1
Fig 1. Overall framework of the Metagenomic Phylogeny by Average Sequence Similarity (MPASS) method.
Metagenomic fastq reads are assembled, and used to predict the protein-coding sequences. Down-sampling is performed to normalize the number of sequenced nucleotides. Incomplete and too short sequences are removed and the resultant proteome datasets are used to construct the distance matrix. Metagenomic trees are constructed using the neighbor-joining method. Quality filtering of fastq reads is optional, as appropriate.
Fig 2
Fig 2. Clustering of the first simulated metagenomic dataset.
Relative read amounts of five bacterial genomic sequences in the simulated metagenomic dataset (A). The horizontal axis indicates the sample number in the metagenomic tree; for example, sample 1 in Group 1 is G1-1 in the tree. Metagenomic tree based on the simulated metagenomes (B). The more complicated samples in each group, such as G1-9, G1-10, G2-7, G2-8, G3-9, and G3-10, are most deeply branched off from the corresponding clusters. Branch length indicates the nucleotide substitution rate as a percentage.
Fig 3
Fig 3. Clustering of the second simulated metagenomic dataset.
Relative read amounts of five bacteria in the simulated metagenomic dataset with random addition of Gaussian noise (A). Metagenomic tree based on the simulated metagenomes (B). The relative read amounts of the five bacteria in the G1-2 and G2-10 samples are significantly different from those of other samples in each group, which may explain why G1-2 and G2-10 clustered in G2 and G1, respectively.
Fig 4
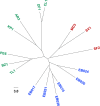
Fig 4. Metagenomic tree for 16 soil samples from three ecologically distinct groups.
Red, hot desert samples; blue, cold (polar) desert samples; green, green biome samples. In the green biome subcluster, the pH of each sampling site was: AR3 (pH 5.90), BZ1 (pH 5.12), CL1 (pH 5.68), DF1 (pH 5.37), KP1 (pH 6.37), PE6 (pH 4.12), and TL1 (pH 4.58) [20].
Fig 5
Fig 5. Metagenomic tree for 35 aquatic samples from six ecologically distinct groups.
Blue, offshore samples; purple, samples from the coastal areas; magenta, samples from submarine hydrothermal vent; orange, lake samples; green and red, two hot spring samples. In the subcluster of the Kirishima hot spring samples (red), the temperature at each sampling site was: G1 (85.5°C), I1 (88.0°C), K1 (84.5°C), K2 (94.7°C), M1 (96.8°C), N1 (68.0°C), N2 (89.1°C), T1 (84.0°C), and Y1 (90.4°C) [25]. In the subcluster of central India hot spring samples (green), the temperature at each sampling site was: BAN (55.0°C), CAN (43.5°C), CAP (52.1°C), TAT-1 (98.0°C), TAT-2 (61.5°C), TAT-3 (67.0°C), and TAT-4 (69.0°C) [29].
Fig 6
Fig 6. Similarities between the metagenomic tree and environmental properties of Kirishima hot spring samples.
The vertical axis indicates the symmetric difference between the metagenomic tree and a dendrogram for each environmental property. A low symmetric difference indicates that the metagenomic tree and the dendrogram are similar. Blue, water quality; orange, carbon concentration; red, nitrogen concentration; green, metal and ion concentration. TC, total carbon; TOC, total organic carbon; DOC, dissolved organic carbon; POC, particulate organic carbon; TN, total nitrogen; TON, total organic nitrogen; DON, dissolved organic nitrogen; PON, particulate organic nitrogen.
Fig 7
Fig 7. Conservation of protein sequences among metagenomes.
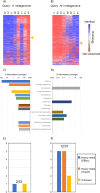
Heatmaps indicate the conservation of 1,000 major protein sequences in the I1 and N1 metagenomes in other metagenomes (A, B). Protein sequences are sorted in descending order by the Pearson correlation coefficients between conservation in other metagenomes and the branch length in the metagenomic tree. Yellow triangles indicate the position at which the correlation coefficient is 0.7, the cut-off point. Taxonomic composition of protein sequences that had similar distribution patterns as the Kirishima hot spring subcluster in the metagenomic tree (C, D). Numbers of the transporter protein sequences with the same distribution patterns of the proteins in Fig 7C-7F. Numbers of metal transporter proteins (numerator) and all transporters (denominator) are indicated above the bar plots. Proteins for the light-metal transporters were not observed. Data for the I1 homologs (Fig 7A, 7C, 7E) and N1 homologs (Fig 7B, 7D, 7F).

References

    1. Muyzer G, De Waal EC, Uitterlinden AG. Profiling of complex microbial populations by denaturing gradient gel electrophoresis analysis of polymerase chain reaction-amplified genes coding for 16S rRNA. Applied and environmental microbiology. 1993;59(3):695–700. doi: 10.1128/aem.59.3.695-700.1993 - DOI - PMC - PubMed
    1. Sogin ML, Morrison HG, Huber JA, Welch DM, Huse SM, Neal PR, et al.. Microbial diversity in the deep sea and the underexplored “rare biosphere”. Proceedings of the National Academy of Sciences. 2006;103(32):12115–20. - PMC - PubMed
    1. Poretsky R, Rodriguez-R LM, Luo C, Tsementzi D, Konstantinidis KT. Strengths and limitations of 16S rRNA gene amplicon sequencing in revealing temporal microbial community dynamics. PLOS ONE. 2014;9(4):e93827. doi: 10.1371/journal.pone.0093827 - DOI - PMC - PubMed
    1. Gilbert JA, Dupont CL. Microbial metagenomics: beyond the genome. Annual review of marine science. 2011;3:347–71. doi: 10.1146/annurev-marine-120709-142811 - DOI - PubMed
    1. Sharpton TJ. An introduction to the analysis of shotgun metagenomic data. Frontiers in plant science. 2014;5:209. doi: 10.3389/fpls.2014.00209 - DOI - PMC - PubMed

Publication types