. 2023 Mar 1;46(3):526-534.
doi: 10.2337/dc22-1297.

CGM Metrics Identify Dysglycemic States in Participants From the TrialNet Pathway to Prevention Study

Affiliations

CGM Metrics Identify Dysglycemic States in Participants From the TrialNet Pathway to Prevention Study

Darrell M Wilson et al. Diabetes Care. .

Abstract

Objective: Continuous glucose monitoring (CGM) parameters may identify individuals at risk for progression to overt type 1 diabetes. We aimed to determine whether CGM metrics provide additional insights into progression to clinical stage 3 type 1 diabetes.

Research design and methods: One hundred five relatives of individuals in type 1 diabetes probands (median age 16.8 years; 89% non-Hispanic White; 43.8% female) from the TrialNet Pathway to Prevention study underwent 7-day CGM assessments and oral glucose tolerance tests (OGTTs) at 6-month intervals. The baseline data are reported here. Three groups were evaluated: individuals with 1) stage 2 type 1 diabetes (n = 42) with two or more diabetes-related autoantibodies and abnormal OGTT; 2) stage 1 type 1 diabetes (n = 53) with two or more diabetes-related autoantibodies and normal OGTT; and 3) negative test for all diabetes-related autoantibodies and normal OGTT (n = 10).

Results: Multiple CGM metrics were associated with progression to stage 3 type 1 diabetes. Specifically, spending ≥5% time with glucose levels ≥140 mg/dL (P = 0.01), ≥8% time with glucose levels ≥140 mg/dL (P = 0.02), ≥5% time with glucose levels ≥160 mg/dL (P = 0.0001), and ≥8% time with glucose levels ≥160 mg/dL (P = 0.02) were all associated with progression to stage 3 disease. Stage 2 participants and those who progressed to stage 3 also exhibited higher mean daytime glucose values; spent more time with glucose values over 120, 140, and 160 mg/dL; and had greater variability.

Conclusions: CGM could aid in the identification of individuals, including those with a normal OGTT, who are likely to rapidly progress to stage 3 type 1 diabetes.


Conflict of interest statement

Duality of Interest. D.M.W. served on a data and safety monitoring board for Intrexon T1D Partners and is on the advisory board for Enable Biosciences. J.L.S. reports research support from the NIDDK and research support from Insulet and Medtronic outside the submitted work. She has served on advisory boards for Bigfoot Biomedical, Cecelia Health, Insulet, Medtronic Diabetes, and Vertex. She did consulting work for Cecelia Health, Eli Lilly, Lexicon, Insulet, and Medtronic. J.L.D. is a current employee of Janssen Research and Development, LLC. No other potential conflicts of interest relevant to this article were reported.

Figures

None
Graphical abstract
Figure 1
Figure 1
Dot plot violin charts for HbA1c and various CGM metrics between low-risk, stage 1, and stage 2 participants. A: Mean overall glucose level; B: mean daytime (values between 6:00 a.m. and midnight) glucose level; C: time spent ≥120 mg/dL (%); D: time spent ≥140 mg/dL (%); E: time spent ≥160 mg/dL (%); F: HbA1c (%); G: DySF (○, nonprogressors; ●, progressors).
Figure 2
Figure 2
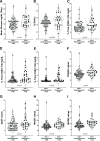
Dot plot violin charts for HbA1c and various CGM metrics between autoantibody-positive (AAb +) progressors and islet antibody-positive nonprogressors. A: Mean daytime (values between 6:00 a.m. and midnight) glucose level; B: HbA1c (%); C: time spent ≥120 mg/dL (%); D: time spent ≥140 mg/dL (%); E: time spent ≥160 mg/dL (%); F: CONGA; G: DySF; H: MAGE; and I: MODD (○, nonprogressors; ●, progressors). Note that the results seen with DySF may appear opposite those of the other metrics, but this is due to its ability to measure volatility. While some outliers may be seen, the averages for all the patients are in line with the other metrics.
Figure 3
Figure 3
Progression to type 1 diabetes (T1D) by time spent ≥140 mg/dL and ≥160 mg/dL. A: Time spent ≥140 mg/dL with cutoff ≥5% vs. <5%; B: time spent ≥140 mg/dL with cutoff ≥8% vs. <8%; C: time spent ≥160 mg/dL with cutoff ≥5% vs. <5%; and D: time spent ≥160 mg/dL with cutoff ≥8% vs. <8%. Follow-up time was defined as the time between baseline CGM and diabetes onset for the progressors or last visit/contact for those who did not develop type 1 diabetes. CR, cumulative risk.

References

    1. Kovatchev BP. Metrics for glycaemic control—from HbA1c to continuous glucose monitoring. Nat Rev Endocrinol 2017;13:425–436 - PubMed
    1. Nguyen M, Han J, Spanakis EK, Kovatchev BP, Klonoff DC. A review of continuous glucose monitoring-based composite metrics for glycemic control. Diabetes Technol Ther 2020;22:613–622 - PMC - PubMed
    1. Battelino T, Danne T, Bergenstal RM, et al. . Clinical targets for continuous glucose monitoring data interpretation: recommendations from the International Consensus on Time in Range. Diabetes Care 2019;42:1593–1603 - PMC - PubMed
    1. Verge CF, Gianani R, Kawasaki E, et al. . Prediction of type I diabetes in first-degree relatives using a combination of insulin, GAD, and ICA512bdc/IA-2 autoantibodies. Diabetes 1996;45:926–933 - PubMed
    1. Acevedo-Calado MJ, Pietropaolo SL, Morran MP, et al. .; Type 1 Diabetes TrialNet Study Group . Autoantibodies directed toward a novel IA-2 variant protein enhance prediction of type 1 diabetes. Diabetes 2019;68:1819–1829 - PMC - PubMed

Publication types