. 2023 Feb 1;111(3):328-344.e7.
doi: 10.1016/j.neuron.2023.01.007.

A cellular taxonomy of the adult human spinal cord

Affiliations

A cellular taxonomy of the adult human spinal cord

Archana Yadav et al. Neuron. .

Abstract

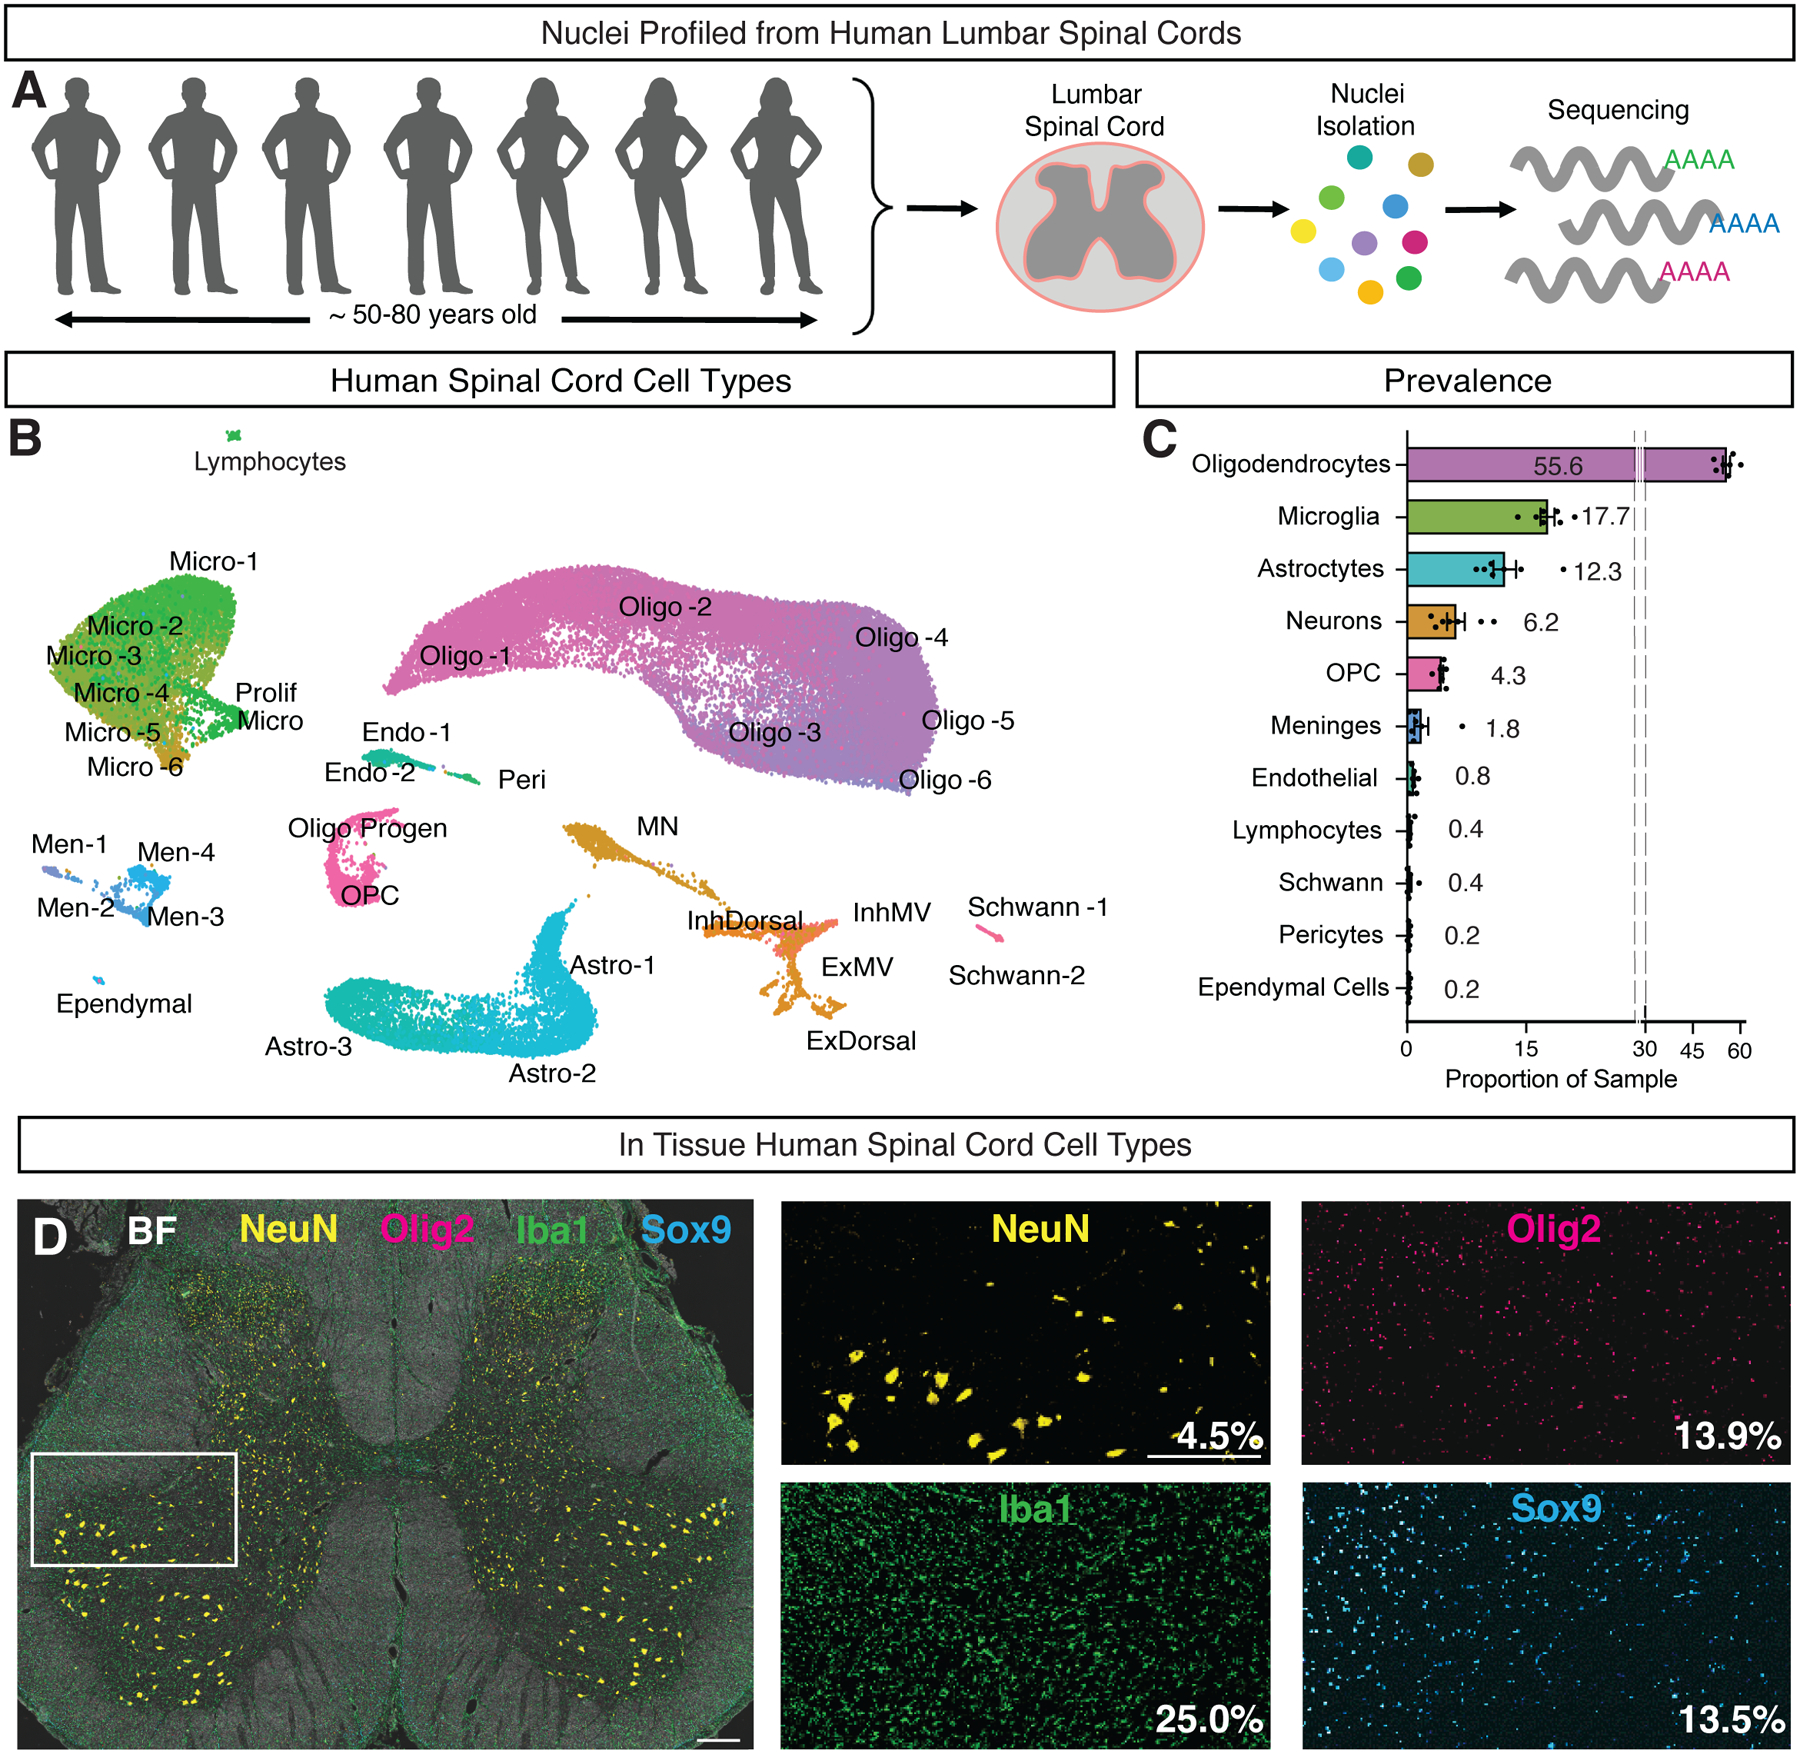
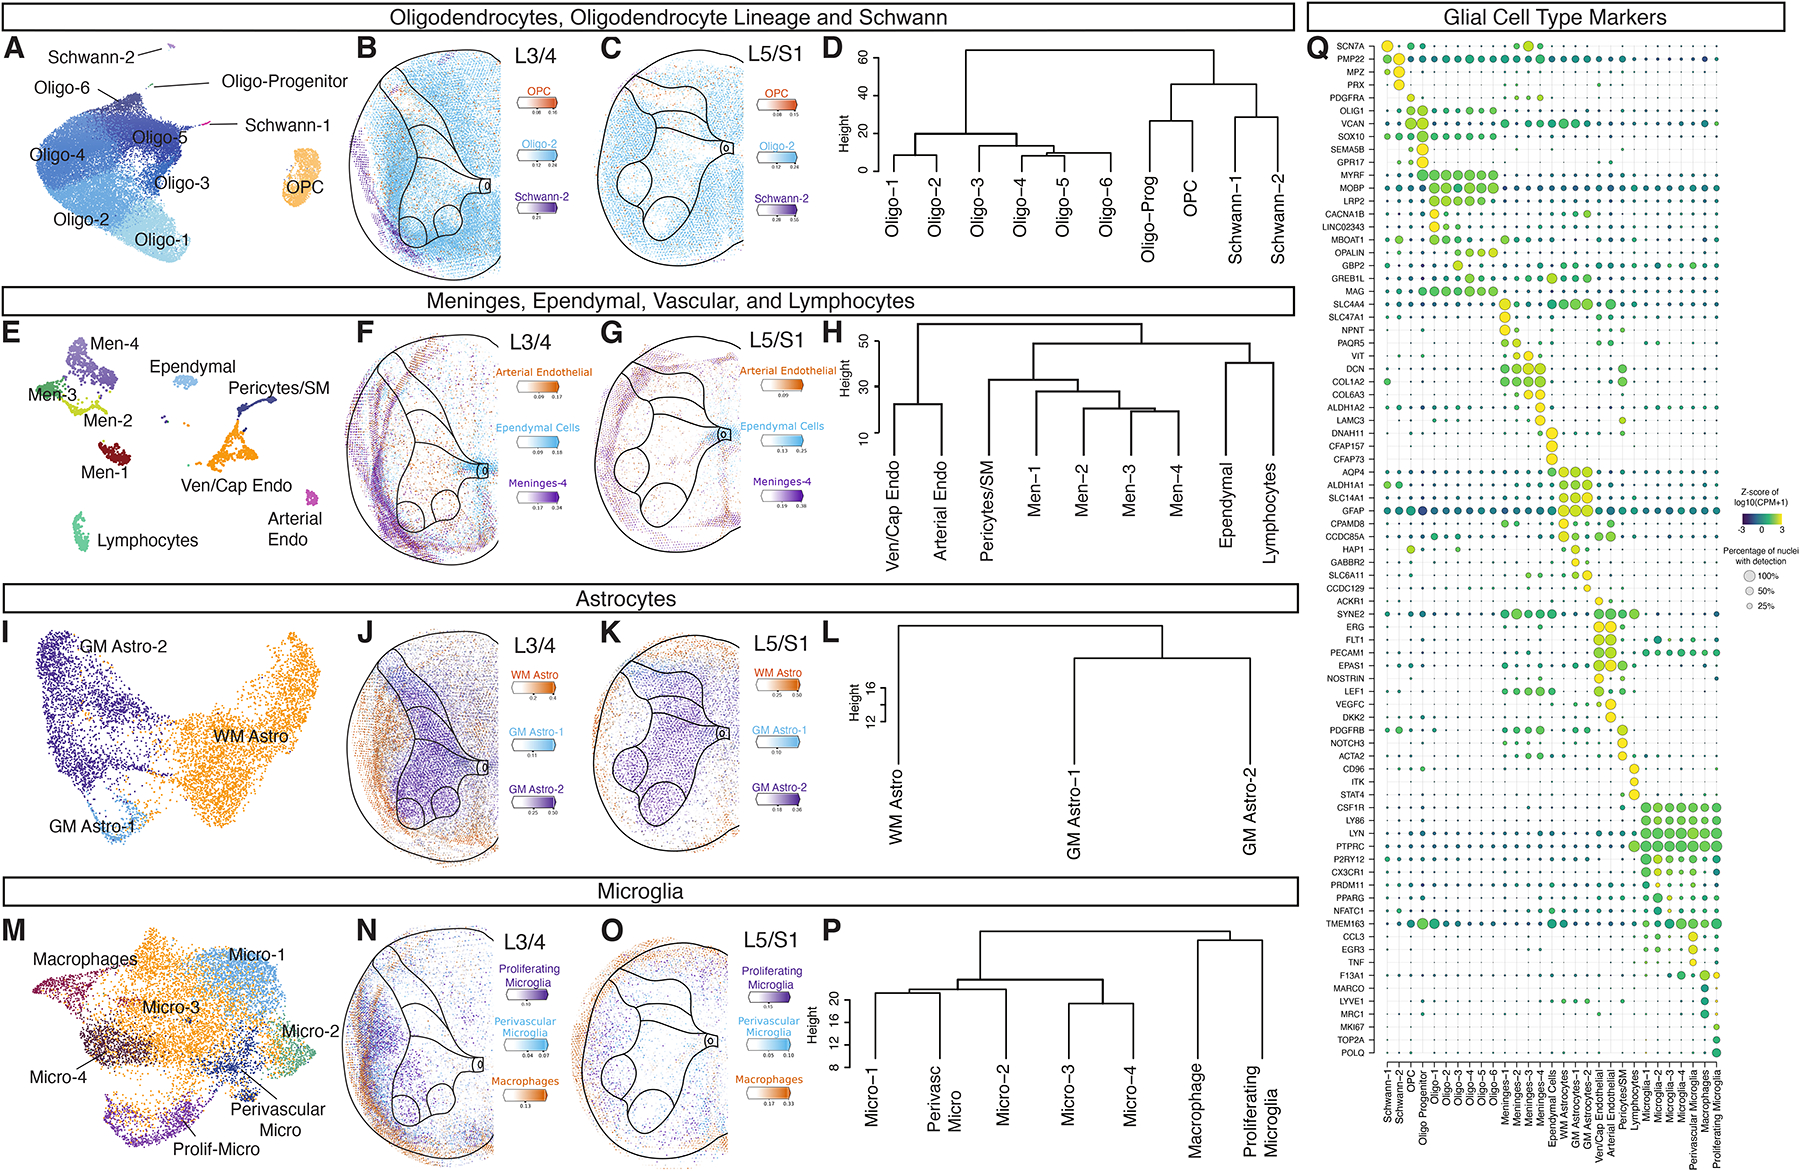
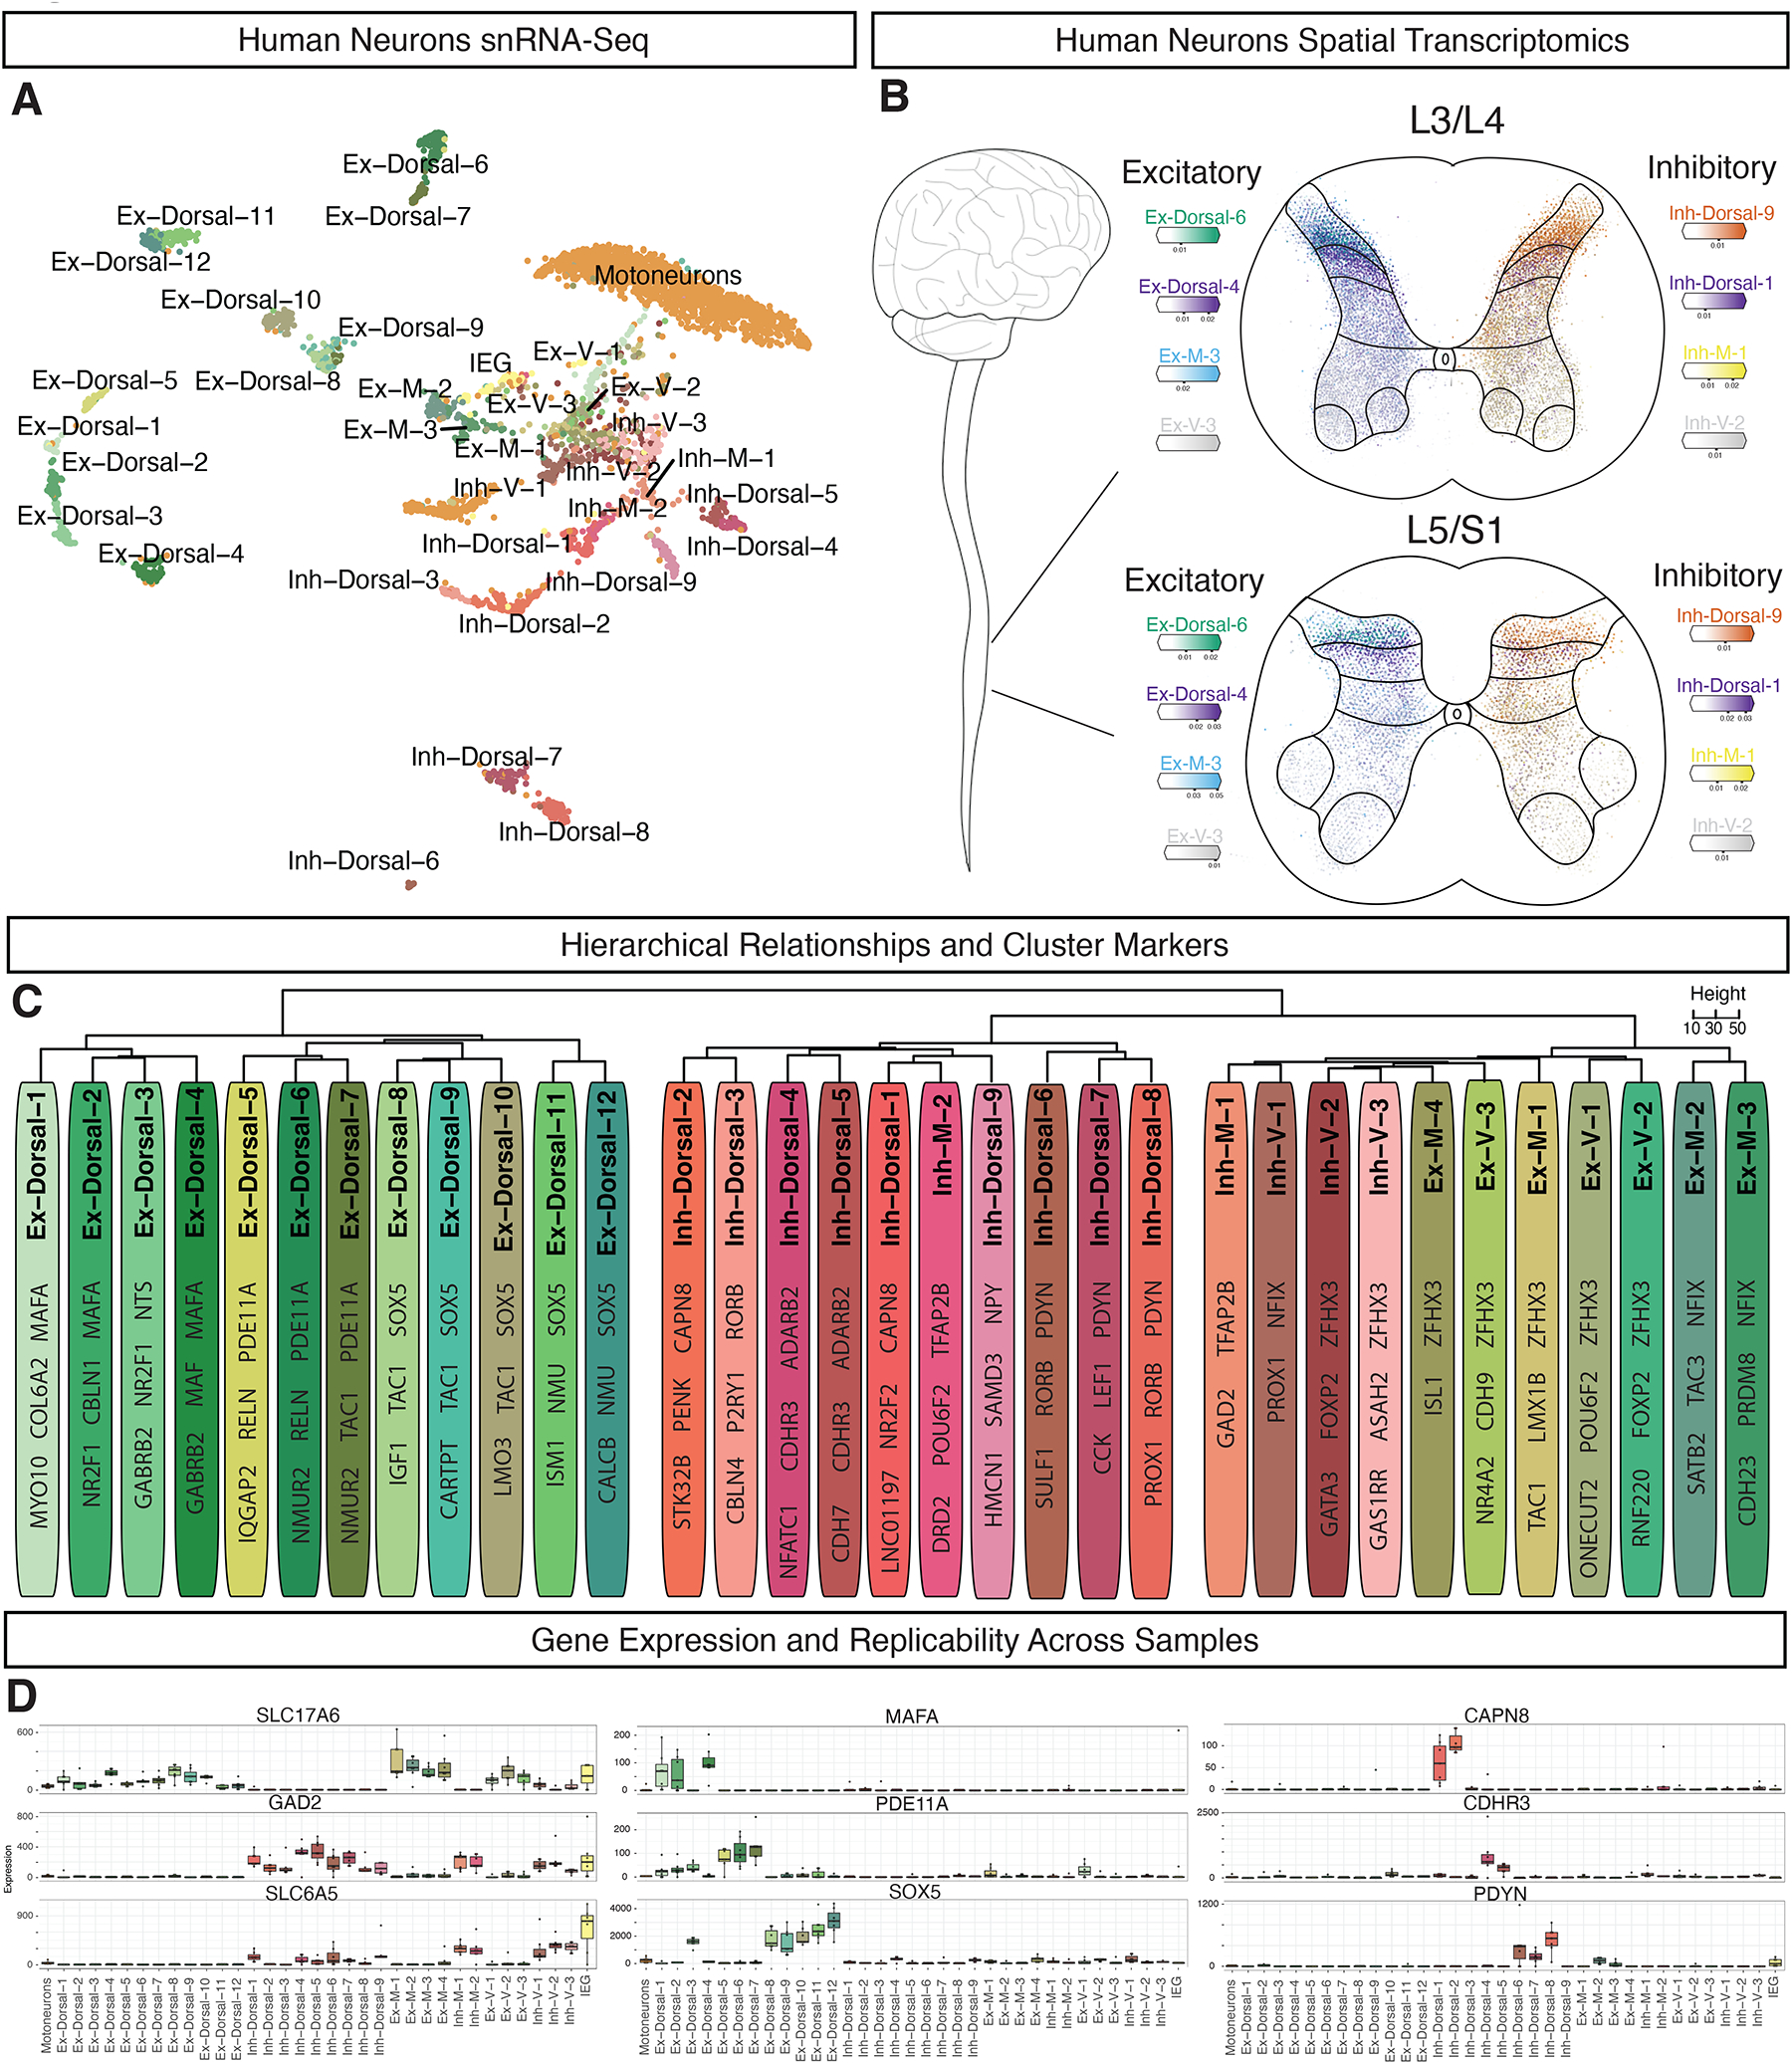
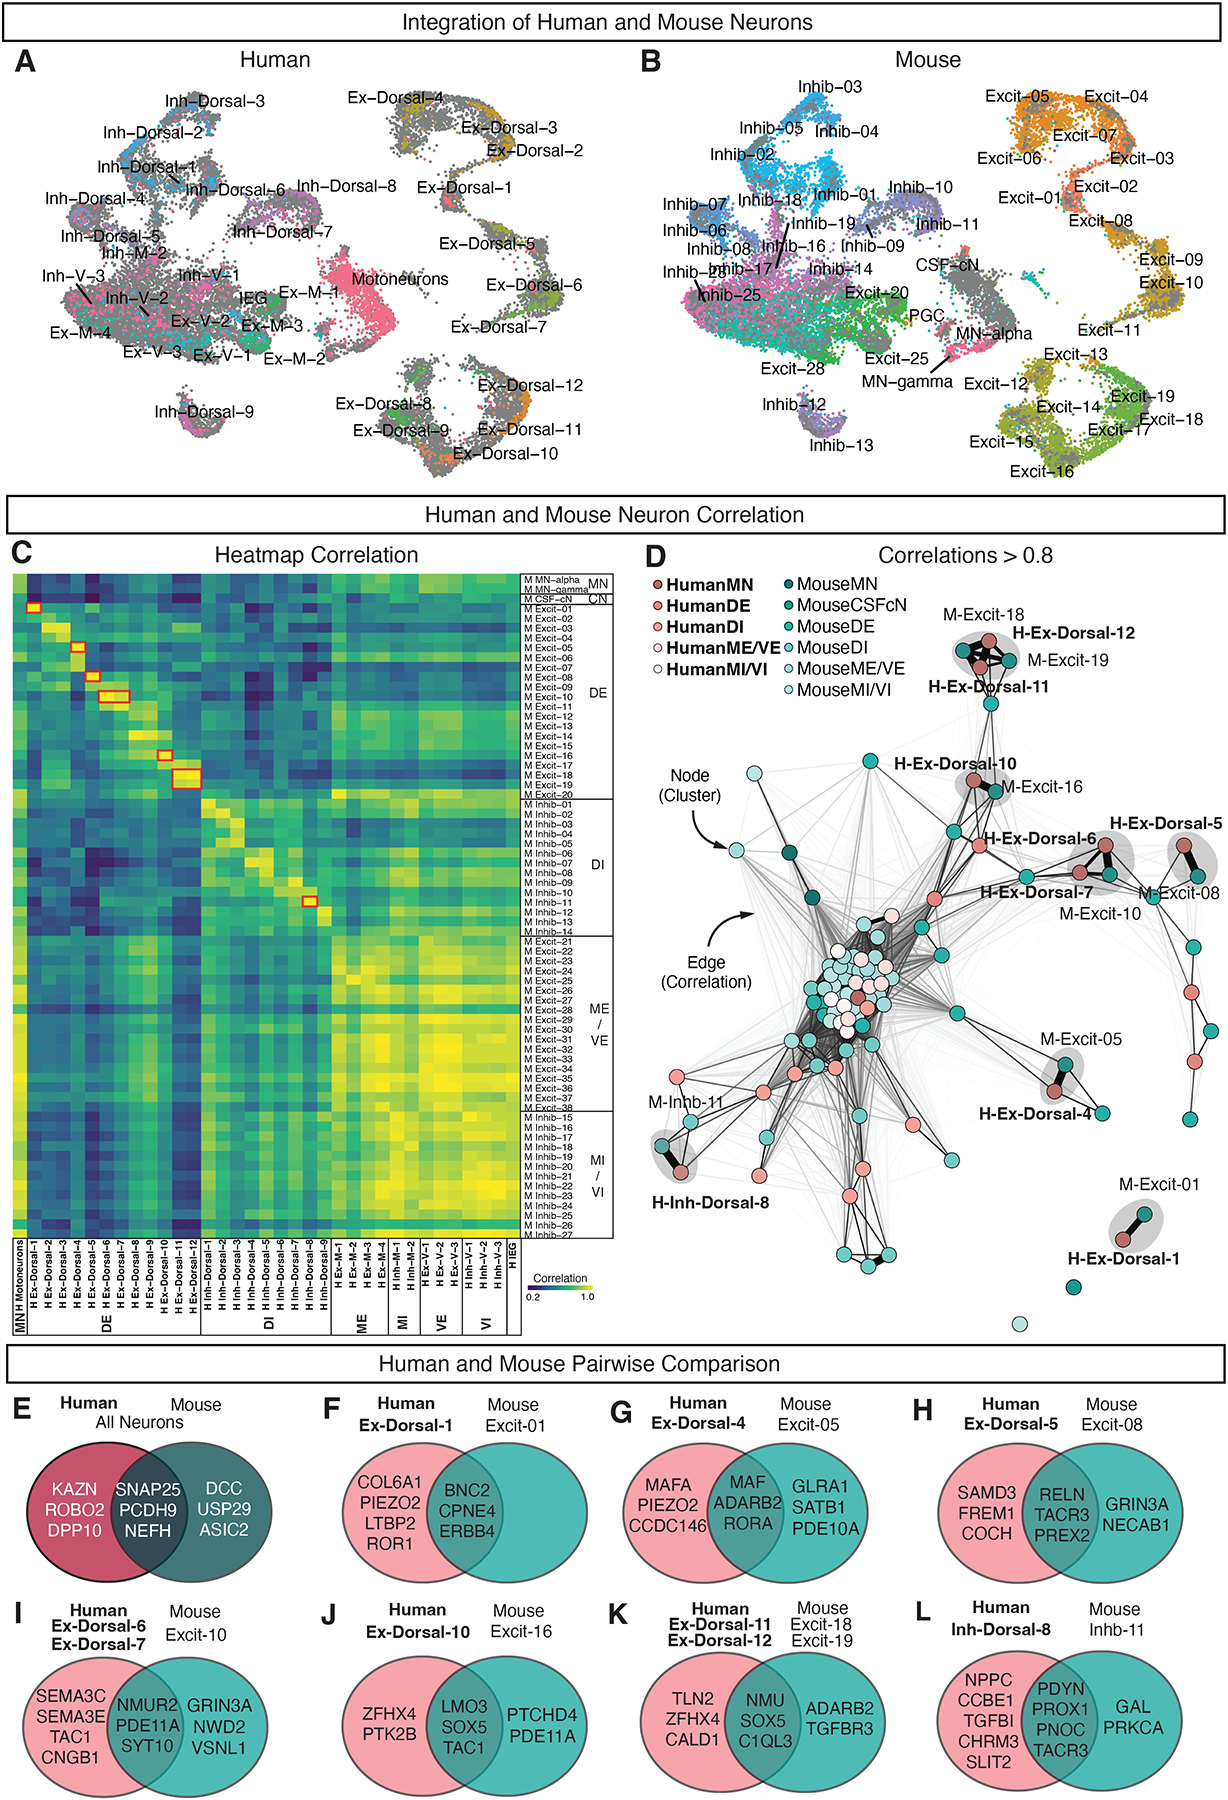
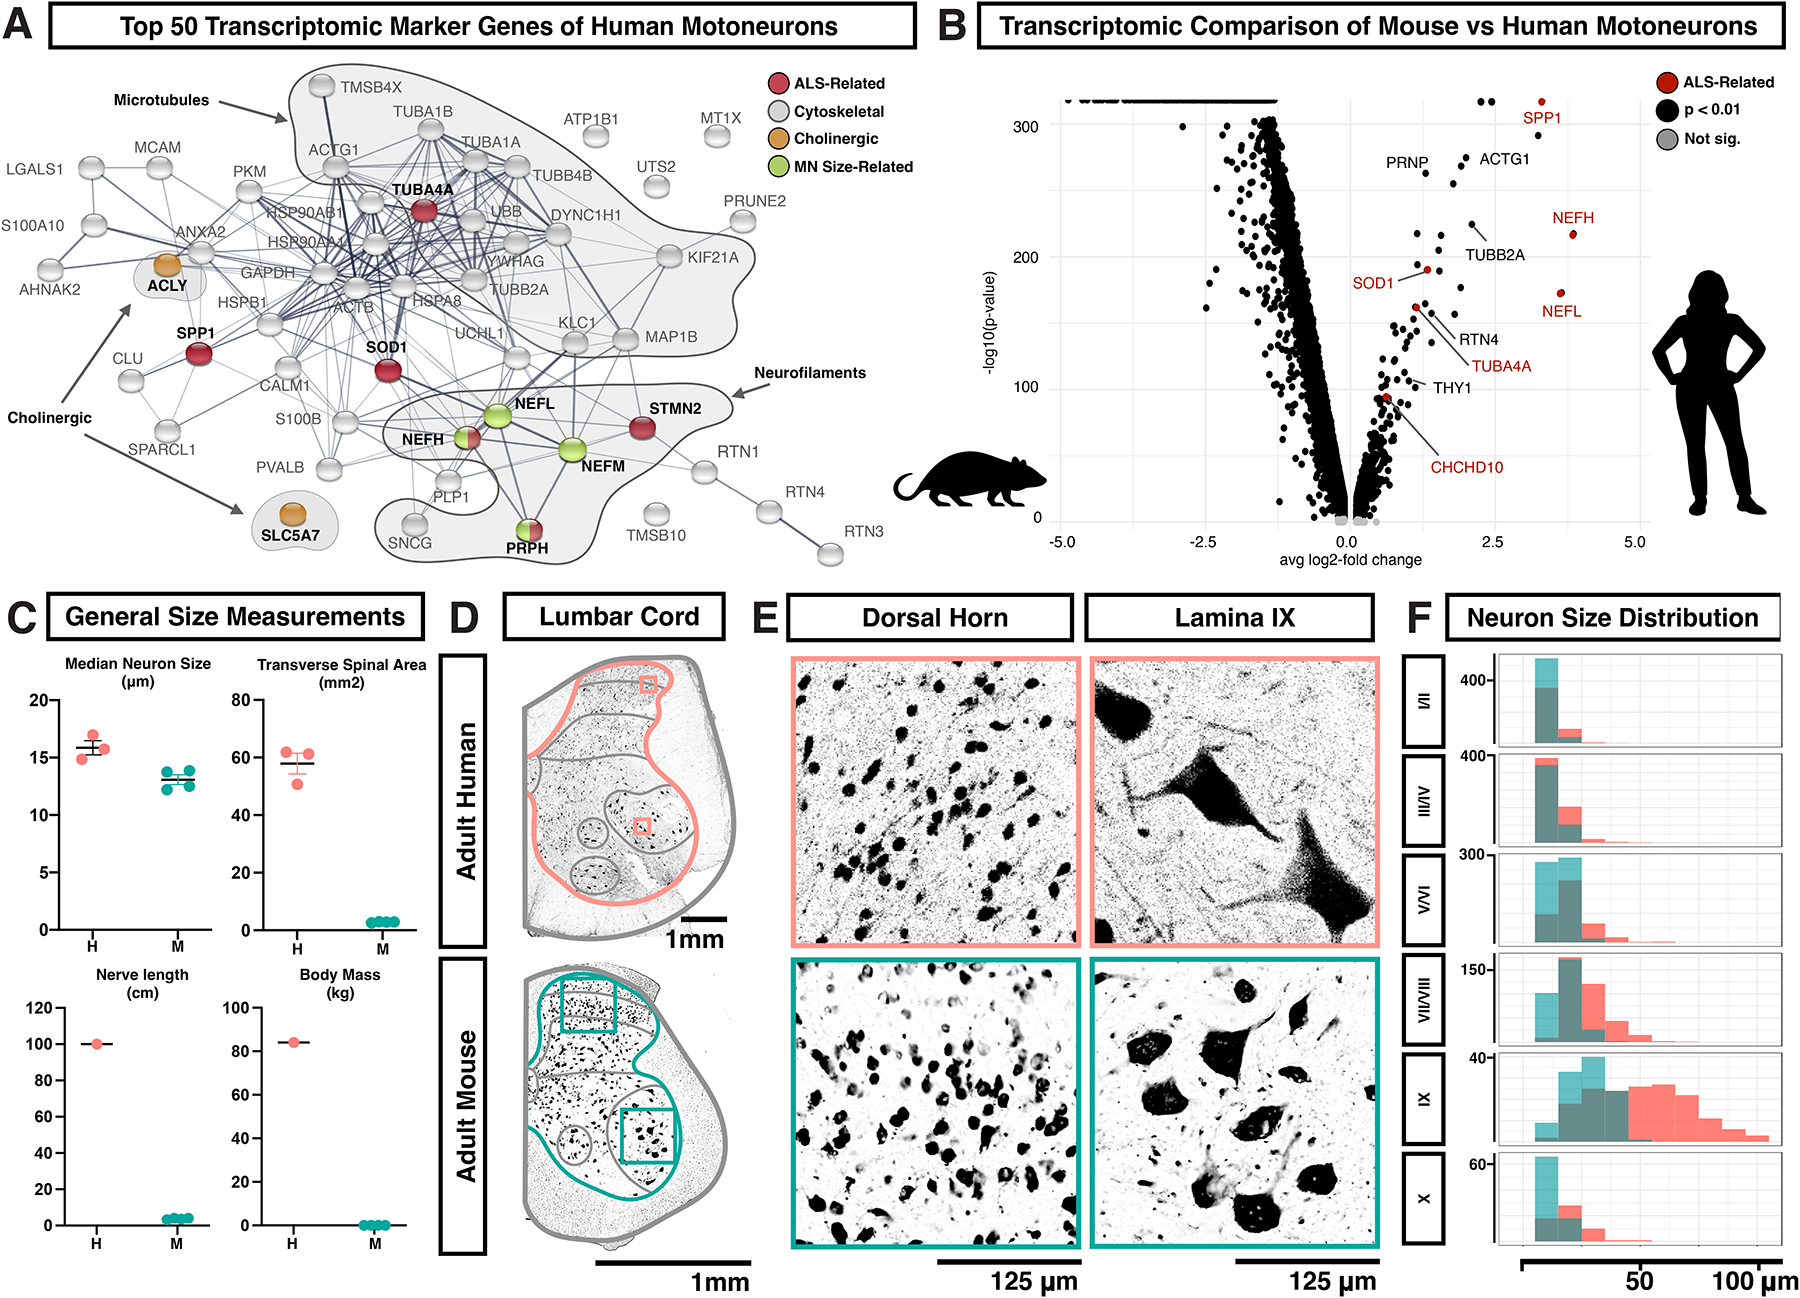
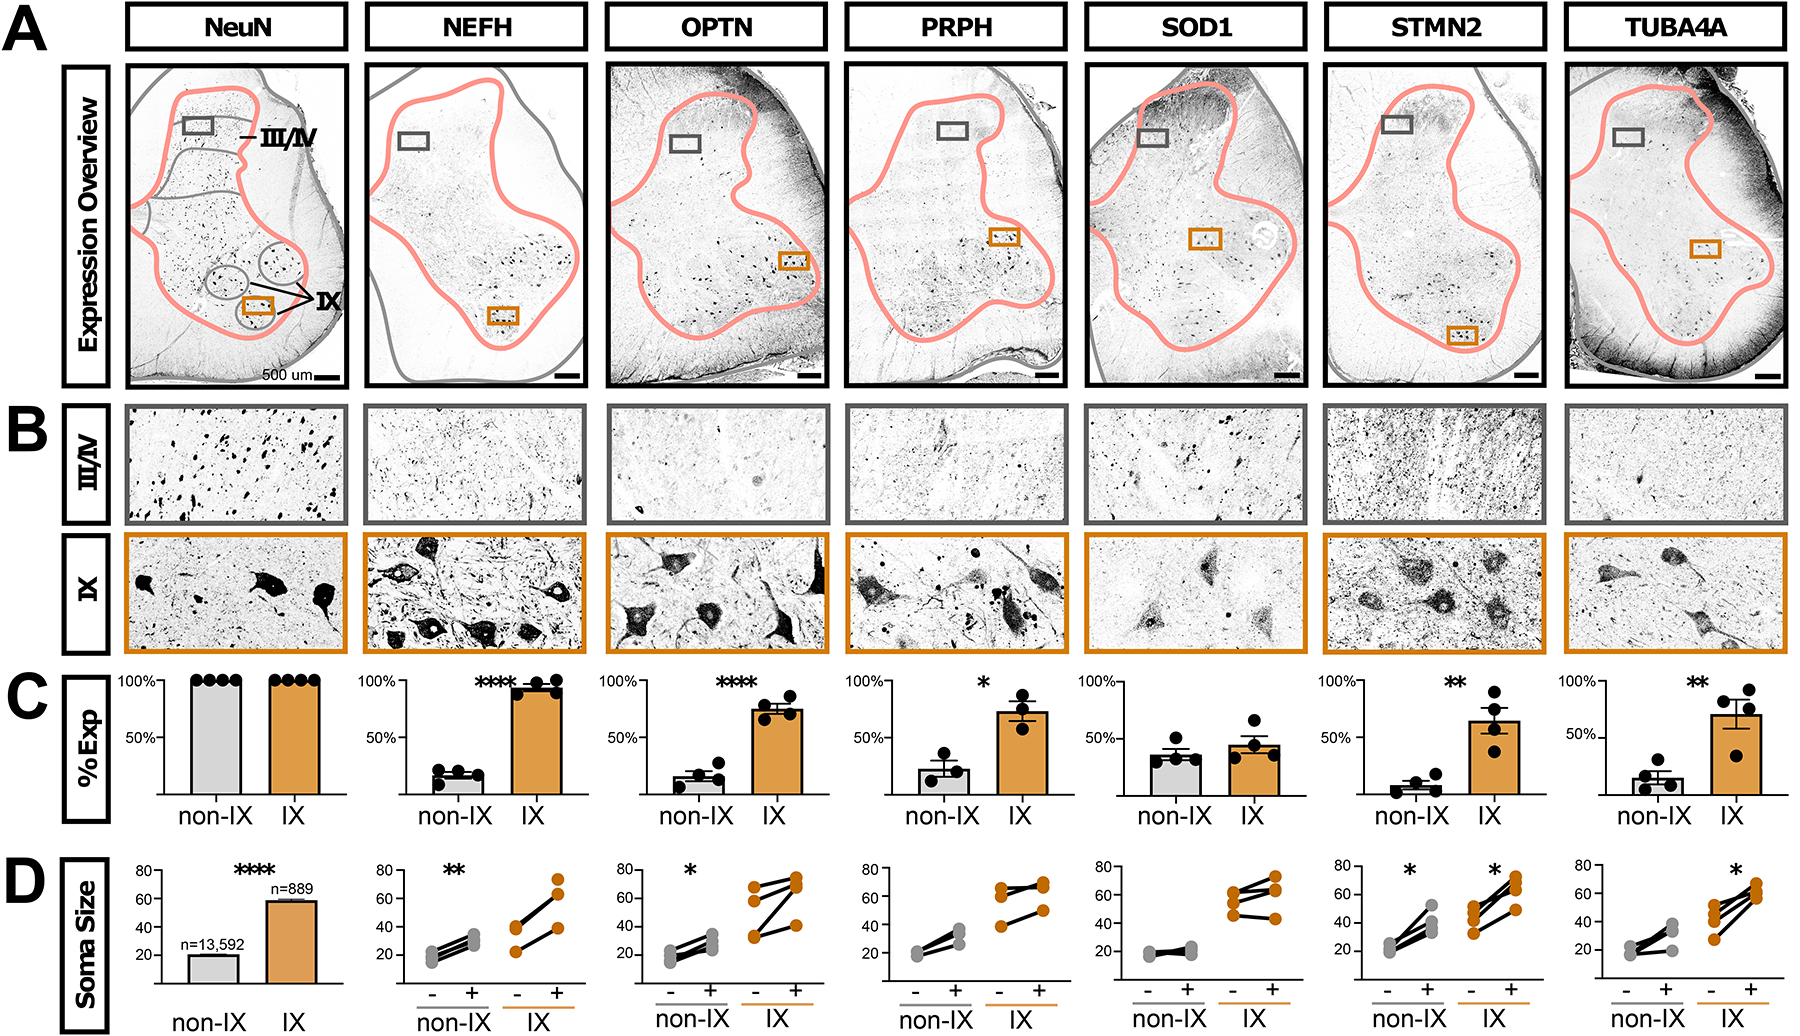
The mammalian spinal cord functions as a community of cell types for sensory processing, autonomic control, and movement. While animal models have advanced our understanding of spinal cellular diversity, characterizing human biology directly is important to uncover specialized features of basic function and human pathology. Here, we present a cellular taxonomy of the adult human spinal cord using single-nucleus RNA sequencing with spatial transcriptomics and antibody validation. We identified 29 glial clusters and 35 neuronal clusters, organized principally by anatomical location. To demonstrate the relevance of this resource to human disease, we analyzed spinal motoneurons, which degenerate in amyotrophic lateral sclerosis (ALS) and other diseases. We found that compared with other spinal neurons, human motoneurons are defined by genes related to cell size, cytoskeletal structure, and ALS, suggesting a specialized molecular repertoire underlying their selective vulnerability. We include a web resource to facilitate further investigations into human spinal cord biology.

Keywords: ALS; cell types; human spinal cord; motoneuron; single cell sequencing; spatial transcriptomics.


Conflict of interest statement

Declaration of interests M.A.N.’s participation in this project was part of a competitive contract awarded to Data Tecnica International LLC by the National Institutes of Health to support open science research. He also currently serves on the scientific advisory board for Clover Therapeutics and is an advisor to Neuron23 Inc.

Figures

Fig. 1:
Fig. 1:. A single cell catalog of the human spinal cord reveals the gene expression signature of human motoneurons.
A, Lumbar spinal cord tissue was obtained from seven subjects and processed for single nucleus RNA-sequencing. B, UMAP plot showing the major cell classes of the human spinal cord. Cells of the oligodendrocyte lineage are shown in pink/purple and include two populations of Schwann cells (Schwann-1 and Schwann–2), oligodendrocyte precursor cells (OPC), progenitors (Oligo Progen), and six groups of oligodendrocytes (Oligo-1 through Oligo-6). Microglia are shown in green and include a putatively proliferating population (Prolif Micro), five groups of microglia (Micro-1 through Micro-4 and Perivascular Microglia) as well as a population of macrophages. Astrocytes are shown in turquoise and include three populations (WM Astro, GM Astro-1 and GM Astro-2). Meninges are shown in blue and include four populations (Men-1 through Men-4). Vascular cells are shown in teal and include two groups of endothelial cells (Venous/Capillary Endo and Arterial Endo) and pericytes/smooth muscle cells (Peri/SMC). Ependymal cells are shown in cyan. Neurons are shown in orange and include seven broad classes based on their neurotransmitter status and putative location: motoneurons (MN), excitatory dorsal neurons (ExDorsal), inhibitory dorsal neurons (InhDorsal), excitatory mid neurons (ExM), excitatory ventral neurons (EV), inhibitory mid neurons (InhM), and inhibitory ventral neurons (InhV). C, Bar plot showing the proportion of each cluster in each donor (N=7). Error bars are ± s.e.m. D, Multiplexed immunohistochemistry of the lumbar human spinal cord, stained for NeuN (yellow), IBA1 (green), SOX9 (turquoise), and OLIG2 (pink). Brightfield (BF) is shown in white. Mean percent of DAPI+ cells expressing NeuN, OLIG2, IBA1 and SOX9 are noted in the bottom right corner of each inset (N = 2). Scale bars are 500 μm. See also Supplemental Figures S1–S6.
Fig. 2:
Fig. 2:. Glial and support cell types in the human spinal cord.
Glial cell types including Oligodendrocytes (A-D), Meninges, Ependymal, Vascular and Lymphocyte Cells (E-H), Astrocytes (I-L), Microglia and Macrophages (M-P). For each cell class, the UMAP shows the subtypes, the spatial feature plots show Cell2Location predictions, and the dendrogram depicts the relationships between the subtypes. Individual Cell2Location prediction for each cell type can be found in Supplemental Figure S7 and S8. Dendrograms were calculated using the top 2,000 highly variable genes from each population and Ward’s method. Q, Dot plot of markers for glial subtypes showing average expression (color) and percent expressed (dot size). See also Supplemental Figures S7–S9.
Fig. 3:
Fig. 3:. Neuronal cell types in the human spinal cord.
A, UMAP plot of human spinal neurons showing 35 populations. B, Cell2Location predictions on spatial transcriptomics data showing selected excitatory (left) and inhibitory (right) cell types at both L3/4 and L5/S1 segmental levels. C, Dendogram showing the relationship of neuronal subtypes, calculated using the top 2,000 highly variable genes and Ward’s method. For each cluster, 2–3 marker genes are listed. D, Neurotransmitter status markers SLC17A6, GAD2, and SLC6A5 (left column), dorsal excitatory markers MAFA, PDE11A, and SOX5 (middle column), and dorsal inhibitory markers CAPN8, CDHR3, and PDYN (right column). Box plots show the median expression of each gene in each cluster (Counts per Million of Unique Molecular Identifiers) per donor (N = 7), as well as the 25th and 75th percentile of expression, and whiskers show the most extreme point within 1.5 times the interquartile range. See also Supplemental Figures S10–S13.
Fig. 4:
Fig. 4:. Overall relationships among dorsal and ventral neuronal populations in human and mouse lumbar spinal cord.
A, Distributions of percell Silhouette scores in human and mouse spinal cord neurons, separated into dorsal and ventral groups. Higher silhouette scores indicate that cells belong to more clearly separated clusters. Cluster-level silhouette scores are shown in Supplemental Fig. S11. Two-way ANOVA, followed by Mann-Whitney tests for human and mouse dorsal vs ventral distributions were p < 0.0001, ****. B-C, UMAP of human neurons (B) and mouse neurons (C) colored by Silhouette score. D, Median gene expression correlation (Pearson’s R) of each cluster to other clusters, using the top 2,000 highly variable genes. Two-way ANOVA, followed by Mann-Whitney tests for human and mouse dorsal vs ventral distributions were p < 0.0001, ****. E-F, Heatmap of pairwise gene expression correlations (Pearson’s R) of human spinal cord clusters (E) and mouse spinal cord clusters (F, Russ et al.). Correlation is colored from purple (low) to yellow (high). See also Supplemental Figure S14.
Fig. 5:
Fig. 5:. Relationships between human and mouse spinal cord neuronal populations.
A-B, UMAP plots of integrated human and mouse spinal neuron data sets, colored by clusters from (A) human data set and (B) mouse data set (Russ et al.). C, Heatmap of correlations values (Pearson’s R) between human clusters (columns) and mouse clusters (rows). Correlations were calculated using the top 2,000 highly variable genes from the integrated mouse-human data set. Red boxes highlight 7 pairs of clusters shown in E-L. Human clusters are bolded and mouse clusters are in regular font. D, Quotient graph showing neuronal clusters as nodes connected by edges. Edges represent correlations greater than 0.8 between human and mouse neuronal clusters. Edge thickness and length reflect correlation values, with greater correlations having thicker and shorter edges. Human clusters (bold, pink) and mouse clusters (teal) are shown. Grey circles highlight 7 pairs of clusters shown in E-L. E-L, Venn diagrams represent differentially expressed genes using the Wilcoxon Rank Sum test. The overlap in the two circles represents top genes enriched in both of the selected pair(s) of human and mouse neurons compared to all other human and mouse neurons, while human or mouse top enriched genes are shown in pink or teal circles, respectively. No differentially expressed genes were found for Mouse Excit-01. See also Supplemental Figures S15–S17.
Fig. 6.
Fig. 6.. Human motoneurons are characterized by genes associated with ALS, cell structure, and increased cell size.
A, Association network plot constructed using the String protein database for the top 50 marker genes of human motoneurons, with selected categories highlighted (cholinergic transmission, orange; ALS, red; genes whose over-expression in mice causes enlargement and/or degeneration of motoneurons, green; cytoskeletal components, gray). B, Volcano plot showing genes enriched in either lumbar motoneurons from adult mice or lumbar motoneurons from adult humans. Genes are plotted by the average change in expression (avg log2-fold change) and by the statistical strength of the difference (-log10(p-value)) with significant genes in black and significant ALS-related genes in red. C, Gross anatomical and neuronal measurements of the human (H) and mouse (M) lumbar spinal cords, including median neuron size (μm), transverse area of the spinal cord (mm2), maximum nerve length (cm), and body mass (kg). D, Transverse sections of one side of the adult lumbar human (above) and mouse (below) spinal cords, with antibody labeling for NeuN. Images are representative of data from three subjects. Scale bars are 1 mm. Boxes indicate the regions shown in panel E. Gray lines indicate the laminar/regional boundaries used in panel F. E, Higher magnification view of NeuN labeled spinal neurons from panel D in the human (above) and mouse (below). The left-side images are from the dorsal horn and the right-side images are of putative motoneurons in lamina IX. Scale bars are 125 μm. F, Histogram showing the count distribution of neuron Feret distance in human (pink) and mouse (teal) across the different lamina regions of the adult lumbar spinal cord. Measurements are given in μm and the count scale is shown at the right of each plot. Bonferroni-adjusted Wilcoxon Rank Sum test p-values and Bhattacharyya Coefficients (BC) for human vs mouse distributions are as follows. I/II: p=7.5e-27, BC=0.93, III/IV: p=4.0e-12, BC=0.96, V/VI: p=3.2e-30, BC=0.89, VII/VIII: p=5.7e-49, BC=0.80, IX: p=1.6e-19, BC=0.71, X: p=9.5e-10, BC=0.92. See also Supplemental Figures S18–S23.
Fig. 7.
Fig. 7.. ALS-related proteins are enriched in human motoneurons.
A, Antibody staining on adult human lumbar spinal cord against NeuN (RBFOX3 gene, general neural marker) and the ALS-related genes NEFH, OPTN, PRPH, SOD1, STMN2, and TUBA4A. Gray matter outlines are shown in pink and boundaries of lamina I/II, III/IV, V/VI, VII/VIII, IX, and X are shown in gray. Boxes indicate the enlarged images in panel. A, Images are representative of data from three subjects (two male and one female). Scale bars are 500 μm. B, Inset of the images in panel A, from the boxed region in laminae III/IV or lamina IX. The width of the insets is 500 μm. C, Quantification of the percent of NeuN+ neurons that co-expressed the indicated proteins in either all neurons not in lamina IX (non-IX) or those in lamina IX. The mean ± s.e.m. are shown. The plotted values and number of cells counted in each subject and category are available in Supplemental Table S7). Paired t-test results are shown where * indicates p < 0.05, ** indicates p < 0.005, **** indicates p < 0.0001. D, The sizes of NeuN+ neurons are shown for each indicated protein. For NeuN, 100% of cells were positive, by definition, and the total counts and sizes (mean ± s.e.m.) are shown for neurons not in lamina IX (non-IX) or those in lamina IX. For all other indicated proteins, the Feret distance sizes are shown for all neurons that did not (−) or did (+) express the indicated protein (mean Feret distance in μm). Each line joins values within one subject. There is an unpaired value for NEFH because we did not detect neurons in lamina IX that did not express NEFH. The plotted values and number of cells measured in each subject and category are available in Supplemental Table S7. Paired two-tailed t-test p-values, after Benjamini-Hochberg FDR correction, are shown where * indicates p < 0.05, ** indicates p < 0.005. **** indicates p < 0.0001. See also Supplemental Figures S24 and S25.

References

    1. Arnold ES, and Fischbeck KH (2018). Spinal muscular atrophy. Handb Clin Neurol 148, 591–601. 10.1016/b978-0-444-64076-5.00038-7. - DOI - PubMed
    1. Kawamura Y, Dyck PJ, Shimono M, Okazaki H, Tateishi J, and Doi H (1981). Morphometric comparison of the vulnerability of peripheral motor and sensory neurons in amyotrophic lateral sclerosis. J Neuropathol Exp Neurol 40, 667–675. 10.1097/00005072-198111000-00008. - DOI - PubMed
    1. Ravits J, Appel S, Baloh RH, Barohn R, Brooks BR, Elman L, Floeter MK, Henderson C, Lomen-Hoerth C, Macklis JD, et al. (2013). Deciphering amyotrophic lateral sclerosis: what phenotype, neuropathology and genetics are telling us about pathogenesis. Amyotroph Lateral Scler Frontotemporal Degener 14 Suppl 1, 5–18. 10.3109/21678421.2013.778548. - DOI - PMC - PubMed
    1. Alkaslasi MR, Piccus ZE, Hareendran S, Silberberg H, Chen L, Zhang Y, Petros TJ, and Le Pichon CE (2021). Single nucleus RNA-sequencing defines unexpected diversity of cholinergic neuron types in the adult mouse spinal cord. Nat Commun 12, 2471. 10.1038/s41467-021-22691-2. - DOI - PMC - PubMed
    1. Blum JA, Klemm S, Shadrach JL, Guttenplan KA, Nakayama L, Kathiria A, Hoang PT, Gautier O, Kaltschmidt JA, Greenleaf WJ, and Gitler AD (2021). Single-cell transcriptomic analysis of the adult mouse spinal cord reveals molecular diversity of autonomic and skeletal motor neurons. Nat Neurosci 24, 572–583. 10.1038/s41593-020-00795-0. - DOI - PMC - PubMed

Publication types