. 2023 Feb 2;6(4):e202201539.
doi: 10.26508/lsa.202201539. Print 2023 Apr.

Plant mobile domain proteins ensure Microrchidia 1 expression to fulfill transposon silencing

Affiliations

Plant mobile domain proteins ensure Microrchidia 1 expression to fulfill transposon silencing

Lucas Jarry et al. Life Sci Alliance. .

Abstract

Silencing of transposable elements (TEs) is an essential process to maintain genomic integrity within the cell. In Arabidopsis, together with canonical epigenetic pathways such as DNA methylation and modifications of histone tails, the plant mobile domain (PMD) proteins MAINTENANCE OF MERISTEMS (MAIN) and MAIN-LIKE 1 (MAIL1) are involved in TE silencing. In addition, the MICRORCHIDIA (MORC) ATPases, including MORC1, are important cellular factors repressing TEs. Here, we describe the genetic interaction and connection between the PMD and MORC pathways by showing that MORC1 expression is impaired in main and mail1 mutants. Transcriptomic analyses of higher order mutant plants combining pmd and morc1 mutations, and pmd mutants in which MORC1 expression is restored, show that the silencing defects of a subset of TEs in pmd mutants are most likely the consequence of MORC1 down-regulation. Besides, a significant fraction of up-regulated TEs in pmd mutants are not targeted by the MORC1 pathway.


Conflict of interest statement

The authors declare that they have no conflict of interest.

Figures

Figure 1.
Figure 1.. MORC1 is down-regulated in pmd and pp7l mutants.
(A) UpSet plot analyses allowing to visualize in a matrix layout the intersections of down-regulated gene datasets in the main-3 hypomorphic mutant, main-2, mail1-1, pp7l-2 single-null, and mail1-1 pp7l-2 double-null mutants as described in reference . (B) Relative expression of MORC1 mRNA levels assayed by reverse transcription coupled to quantitative PCR (RT–qPCR) in corresponding pmd and pp7l mutants and complementing lines. RT–qPCR analyses were normalized using the housekeeping RHIP1 gene, and transcript levels are represented relative to WT Columbia (Col) or ATCOPIA28::GFP in WT controls (16). Error bars indicate SD based on three independent biological replicates. Source data are available for this figure.
Figure 2.
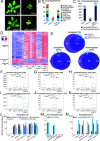
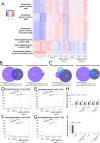
Figure 2.. TE silencing defects are not aggravated by combining pmd and morc1 mutations.
(A) Representative pictures of 3-wk-old main-2, morc1-2 single, and main-2 morc1-2 double mutants in comparison with WT Col plant. (B) Number of up-regulated TEs in main-2, morc1-2, and main-2 morc1-2, classified by the TE superfamily. (C) Number of misregulated genes in main-2, morc1-2, and main-2 morc1-2. (D) Heatmap showing misregulated loci in several biological replicates of main-2, morc1-2, and main-2 morc1-2 in comparison with WT Col. * represents loci that are commonly misregulated in the three mutant backgrounds. ** represents loci that are misregulated in main-2 morc1-2. (E) Venn diagram analyses representing the overlaps between misregulated loci in main-2, morc1-2, and main-2 morc1-2. Fisher’s exact test statistically confirmed the significance of overlaps (P < 10−3). (F, G, H) Boxplot analyses between main-2, morc1-2, and main-2 morc1-2 mutants in comparison with WT Col showing average RPKM values of up-regulated TEs (F), up-regulated genes (G), and down-regulated genes (H) in main-2. (I, J, K) Same as (F, G, H) using misregulated loci in main-2 morc1-2 as defined by ** in panel (D). P-values were calculated using a Wilcoxon test; n.s, not significant; *P < 0.05; **P < 10−6; and ***P < 10−12. (L, M, N) Relative expression analyses of up-regulated TEs, down-regulated genes, and up-regulated genes in the different genotypes assayed by RT–qPCR. RT–qPCR analyses were normalized using the housekeeping RHIP1 gene, and transcript levels in the different mutants are represented relative to WT Col. Error bars indicate SD based on three independent biological replicates. Source data are available for this figure.
Figure S1.
Figure S1.
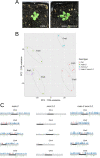
Fig S1 supporting Fig 2. (A) Pictures of 3-wk-old mail1-1 single and mail1-1 morc1-2 double mutants. (B) Principal component analyses of RNA-seq data showing clustering of biological replicates of main-2, morc1-2, main-2 morc1-2, and WT Col plants. The batch effect because of data separated in two independent experiments was eliminated in the principal component analyses. (C) Chromosomal distributions of misregulated loci in main-2, morc1-2, and main-2 morc1-2 over WT Col. Chromosome arms are depicted in light gray, and pericentromeric regions, in dark gray as defined in reference . Up-regulated genes and TEs are represented in blue and red, respectively; down-regulated genes are represented in green. Log2 fold change ≥2 or ≤−2, adjusted P < 0.01.
Figure 3.
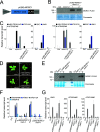
Figure 3.. pUBQ-MORC1 transgene can complement the silencing defects of several TEs in morc1, main, and mail1 mutants.
(A) Schematic representation of the pUBQ-MORC1 transgene. MORC1 CDS-3xFLAG is under the control of UBQ10 promoter and octopine synthase terminator. (B) Western blots using anti-FLAG antibody showing the accumulation of FLAG-tagged MORC1 protein in two pUBQ- independent MORC1/morc1-2 lines. WT Col and morc1-2 plants are used as negative controls. Coomassie staining of the membrane is used as a loading control; kD, kilodalton. (C) Relative expression levels of up-regulated TEs and DNA-methylated genes in the two pUBQ-MORC1/morc1-2 lines and morc1-2 control plants assayed by RT–qPCR. RT–qPCR analyses were normalized using the housekeeping RHIP1 gene, and transcript levels in the two genetic backgrounds are represented relative to WT Col. Error bars indicate SD based on three independent biological replicates. (D) Pictures of 3-wk-old pUBQ-MORC1/main-2, pUBQ-MORC1/mail1-1, and corresponding untransformed pmd mutants. (E) Same as (B) using two independent lines of pUBQ-MORC1/main-2 and pUBQ-MORC1/mail1-1 and WT Col, main-2, and mail1-1 as controls. (F, G) Same as (C) using pUBQ-MORC1/main-2 and pUBQ-MORC1/mail1-1 lines in comparison with main-2 and mail1-1 mutants and relative to WT Col. Source data are available for this figure.
Figure S2.
Figure S2.
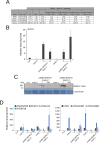
Fig S2 supporting Fig 3. (A) Reads Per Kilobase of transcript per Million mapped reads (RPKM) of MAIN, MAIL1, MORC1, and UBQ10 in WT Col, main-2, mail1-1, and four independent pUBQ-MORC1/pmd lines. (B) Relative expression analyses of MORC1 in the four independent pUBQ-MORC1/pmd lines using main-2 and mail1-1 as respective controls, and relative to WT Col. RT–qPCR analyses were normalized using the housekeeping RHIP1 gene. Error bars indicate SD based on three independent biological replicates. (C) Western blot using anti-FLAG antibody to detect FLAG-tagged MORC1 protein in different pUBQ-MORC1/main-2 and pUBQ-MORC1/mail1-1 lines. WT Col, main-2, and mail1-1 are used as negative controls. (D) Relative expression levels of up-regulated TEs and up-regulated DNA-methylated genes in different pUBQ-MORC1/pmd lines assayed by RT–qPCR. RT–qPCR analyses were normalized using the housekeeping RHIP1 gene, and transcript levels in the different mutants are represented relative to WT Col. Error bars indicate SD based on three independent biological replicates.
Figure 4.
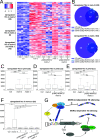
Figure 4.. Rescuing MORC1 expression in pmd mutants efficiently restores the silencing of a fraction of TEs.
(A) Heatmap representing up-regulated TEs in main-2 and mail1-1 mutants and their expression levels in four independent pUBQ-MORC1/pmd lines. (B) Venn diagram analyses showing the overlaps between down-regulated TEs in pUBQ-MORC1/main-2 or pUBQ-MORC1/mail1-1 lines over their respective mutant backgrounds and up-regulated TEs in main-2 or mail1-1 over WT Col. Fisher’s exact test statistically confirmed the significance of overlaps (P < 10−3). (C) Boxplot analyses between main-2 and mail1-1 showing average RPKM values of up-regulated TEs in main-2 and mail1-1 union in comparison with WT Col. (D, E) Boxplot analyses between two independent pUBQ-MORC1/main-2 (D) or pUBQ-MORC1/mail1-1 (E) lines and their respective pmd mutants showing average RPKM values of up-regulated TEs in main-2 and mail1-1 union in comparison with WT Col. (F) Same as (D, E) for up-regulated TEs in morc1-2 as defined in Fig 2. (C, D, E, F) P-values of panels (C, D, E, F) were calculated using a Wilcoxon test; n.s, not significant; *P < 0.05; **P < 10−6; and ***P < 10−12. (G) In this model explaining the connection between the PMD and MORC1 pathways to repress TEs, MORC1 transcription requires the MAIN/MAIL1/PP7L complex. This latter could either directly recognize the “DOWN” motif located within the MORC1 promoter (CATGCAGTTT) or be recruited by an elusive transcription factor at this genomic location. Alternatively, MORC1 expression would indirectly depend on the MAIN/MAIL1/PP7L complex through the action of a downstream transcription factor. Upon translation, the MORC1 protein associates with other MORC proteins to ensure efficient silencing of a subset of TEs (MORC1-dependent TE silencing). Importantly, the silencing of a significant fraction of TEs requires another pathway independent of MORC1 yet to be deciphered. This MORC1-independent TE silencing pathway could directly involve the PMD proteins or another factor regulated by the MAIN/MAIL1/PP7L complex. Source data are available for this figure.
Figure S3.
Figure S3.
Fig S3 supporting Fig 4. (A) Heatmap representing up-regulated and down-regulated genes in main-2 and mail1-1 mutants and their expression levels in four independent pUBQ-MORC1/pmd lines. (B) Venn diagram analyses showing the intervals between down-regulated genes in pUBQ-MORC1/main-2 or pUBQ-MORC1/mail1-1 lines over their respective mutant backgrounds and up-regulated genes in main-2 or mail1-1 over WT Col. (C) Same as (B) for up-regulated genes in pUBQ-MORC1/main-2 or pUBQ-MORC1/mail1-1 lines and down-regulated genes in main-2 or mail1-1. Fisher’s exact test statistically confirmed the significance of overlaps (P < 10−3), except for the interval between down-regulated genes in main-2 and up-regulated genes in pUBQ-MORC1/main-2 line 1. (D, E) Boxplot analyses between two independent pUBQ-MORC1/main-2 (D) or pUBQ-MORC1/mail1-1 (E) lines and their respective pmd mutants showing average RPKM values of up-regulated genes in main-2 or mail1-1 in comparison with WT Col as depicted in panel (A). (F, G) Same as (D, E) for down-regulated genes in main-2 or mail1-1. P-values were calculated using a Wilcoxon test; n.s, not significant; *P < 0.05; and ***P < 10−12. (H, I) Relative expression levels of several up-regulated (H) and down-regulated (I) genes in pmd mutants in the four pUBQ-MORC1/pmd lines. RT–qPCR analyses were normalized using the housekeeping RHIP1 gene, and transcript levels in the different mutants are represented relative to WT Col. Error bars indicate SD based on three independent biological replicates.
Figure S4.
Figure S4.
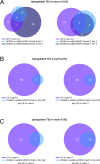
Fig S4 supporting Fig 4. (A) Venn diagram analyses showing the intervals between down-regulated TEs in pUBQ-MORC1/main-2 or pUBQ-MORC1/mail1-1 lines over their respective mutant backgrounds and up-regulated TEs in morc1-2 over WT Col. (B, C) Same as (A) for up-regulated TEs in pp7l-2 (B) or in the hypomorphic main-3 mutant (C) as defined in reference . Fisher’s exact test statistically confirmed the significance of overlaps (P < 10−3).

Similar articles

Cited by

References

    1. Nicolau M, Picault N, Moissiard G (2021) The evolutionary volte-face of transposable elements: From harmful jumping genes to major drivers of genetic innovation. Cells 10: 2952. 10.3390/cells10112952 - DOI - PMC - PubMed
    1. Grewal SIS, Jia S (2007) Heterochromatin revisited. Nat Rev Genet 8: 35–46. 10.1038/nrg2008 - DOI - PubMed
    1. Slotkin RK, Martienssen R (2007) Transposable elements and the epigenetic regulation of the genome. Nat Rev Genet 8: 272–285. 10.1038/nrg2072 - DOI - PubMed
    1. Deniz O, Frost JM, Branco MR (2019) Regulation of transposable elements by DNA modifications. Nat Rev Genet 20: 417–431. 10.1038/s41576-019-0106-6 - DOI - PubMed
    1. Law JA, Jacobsen SE (2010) Establishing, maintaining and modifying DNA methylation patterns in plants and animals. Nat Rev Genet 11: 204–220. 10.1038/nrg2719 - DOI - PMC - PubMed

Publication types

MeSH terms