. 2023 Feb 1;37(3-4):86-102.
doi: 10.1101/gad.349803.122. Epub 2023 Feb 2.

WDR5 represents a therapeutically exploitable target for cancer stem cells in glioblastoma

Affiliations

WDR5 represents a therapeutically exploitable target for cancer stem cells in glioblastoma

Kelly Mitchell et al. Genes Dev. .

Abstract

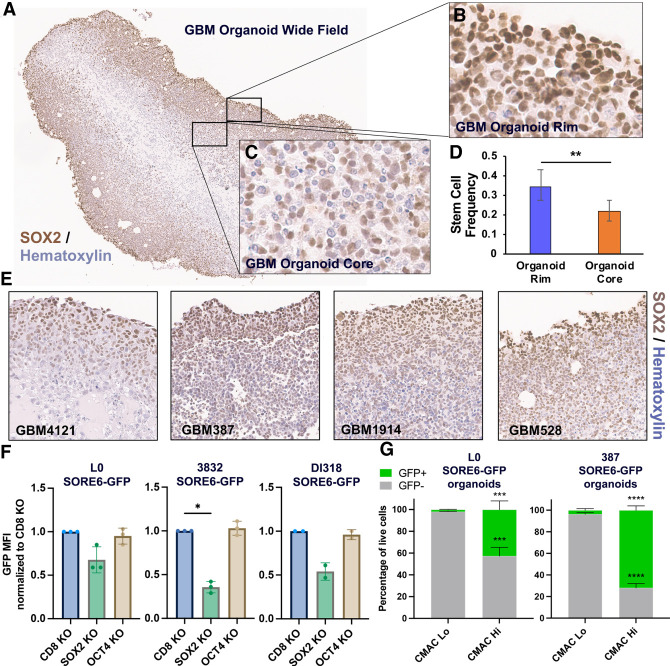
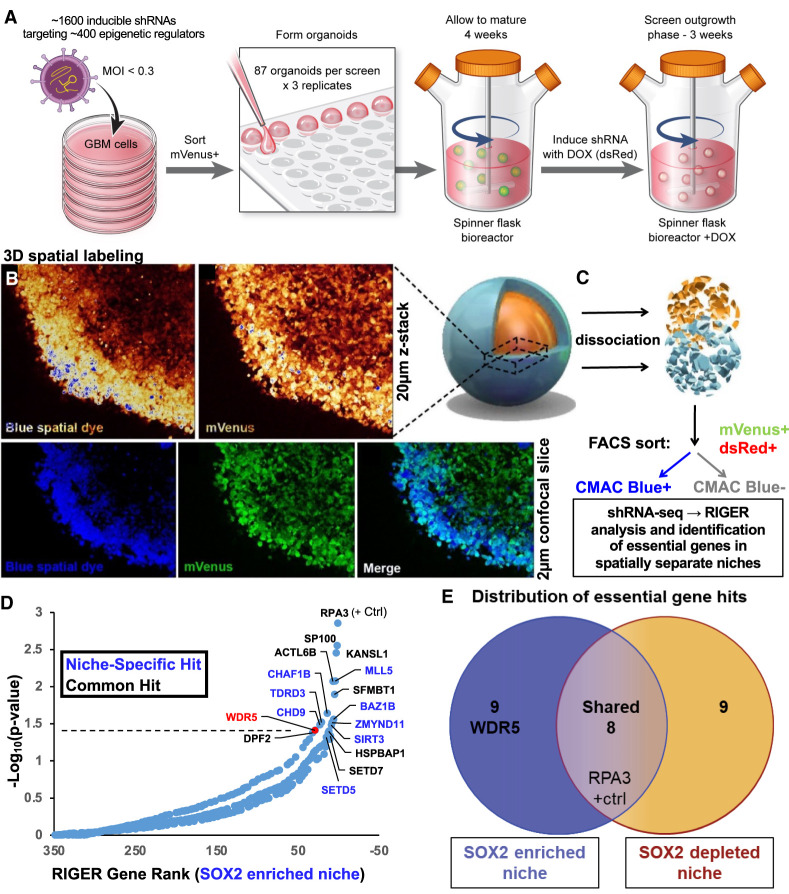
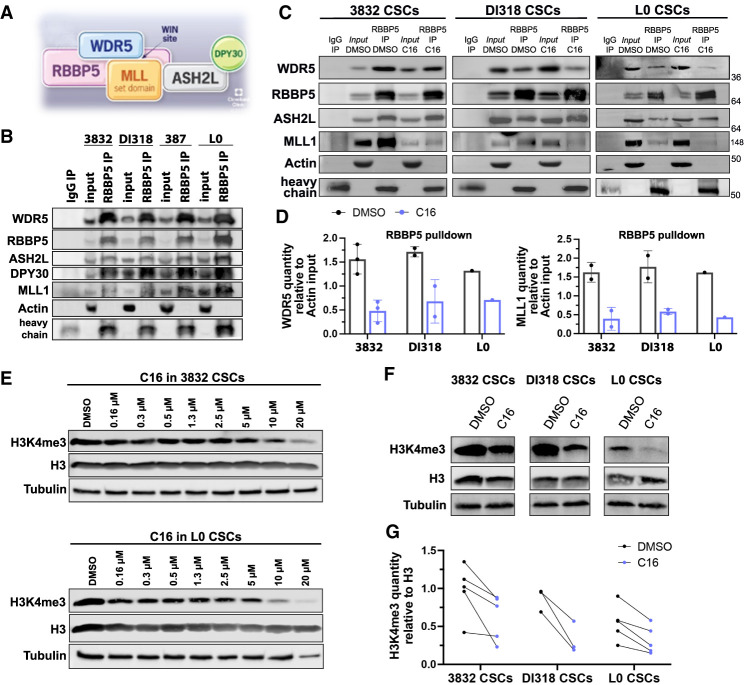
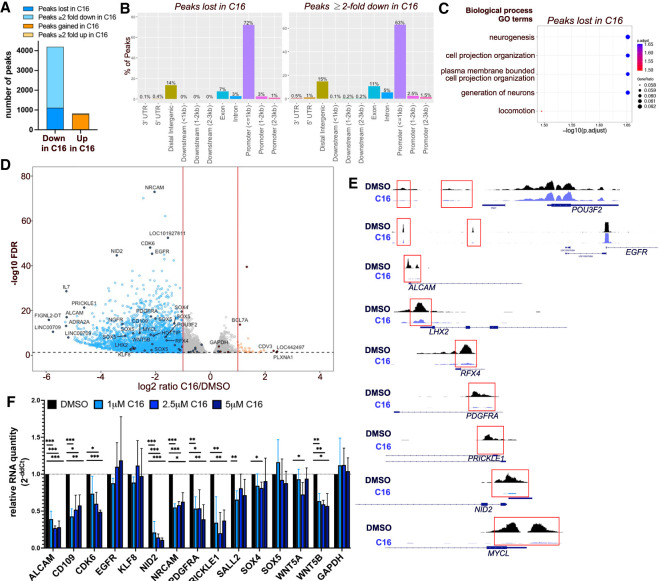
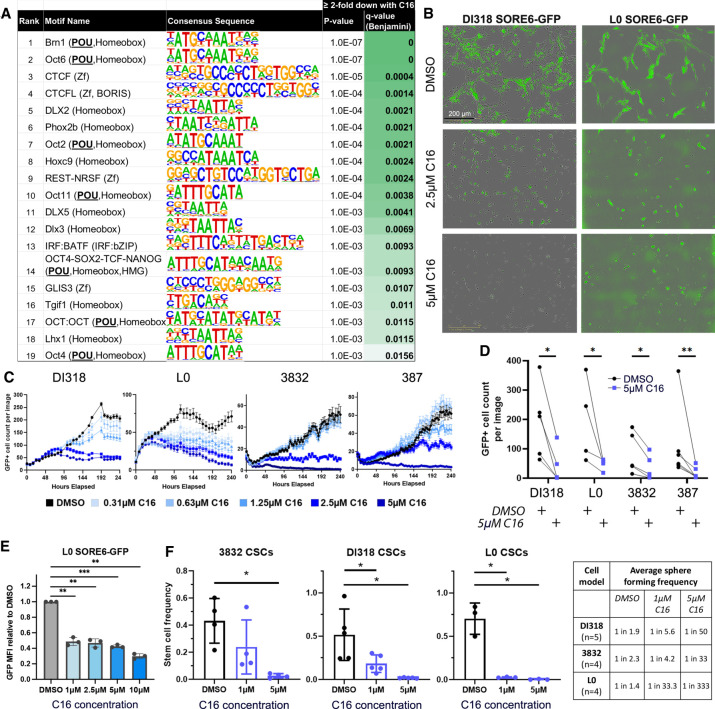
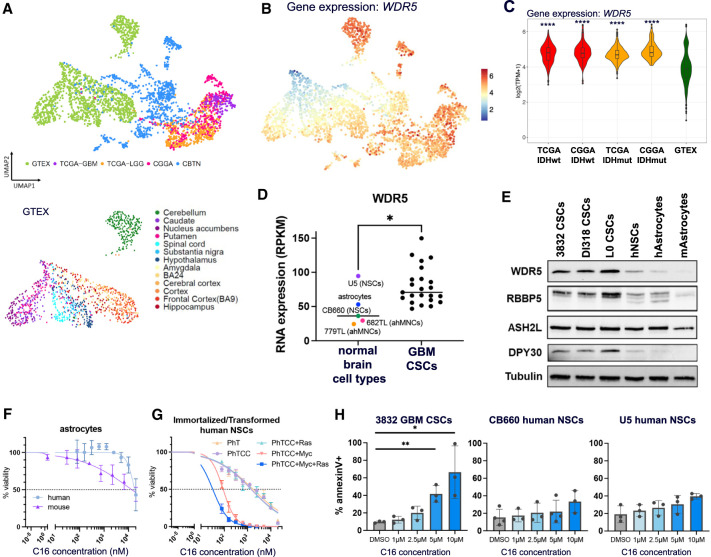
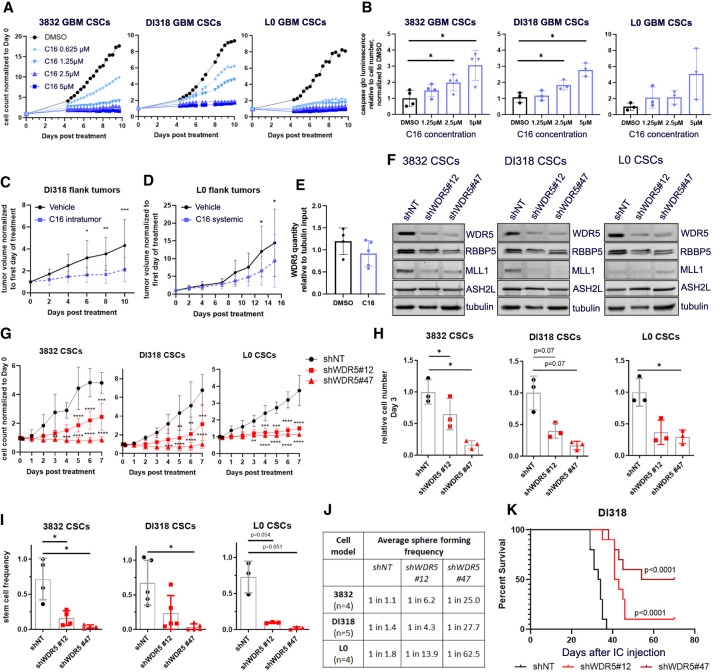
Glioblastomas (GBMs) are heterogeneous, treatment-resistant tumors driven by populations of cancer stem cells (CSCs). However, few molecular mechanisms critical for CSC population maintenance have been exploited for therapeutic development. We developed a spatially resolved loss-of-function screen in GBM patient-derived organoids to identify essential epigenetic regulators in the SOX2-enriched, therapy-resistant niche and identified WDR5 as indispensable for this population. WDR5 is a component of the WRAD complex, which promotes SET1 family-mediated Lys4 methylation of histone H3 (H3K4me), associated with positive regulation of transcription. In GBM CSCs, WDR5 inhibitors blocked WRAD complex assembly and reduced H3K4 trimethylation and expression of genes involved in CSC-relevant oncogenic pathways. H3K4me3 peaks lost with WDR5 inhibitor treatment occurred disproportionally on POU transcription factor motifs, including the POU5F1(OCT4)::SOX2 motif. Use of a SOX2/OCT4 reporter demonstrated that WDR5 inhibitor treatment diminished cells with high reporter activity. Furthermore, WDR5 inhibitor treatment and WDR5 knockdown altered the stem cell state, disrupting CSC in vitro growth and self-renewal, as well as in vivo tumor growth. These findings highlight the role of WDR5 and the WRAD complex in maintaining the CSC state and provide a rationale for therapeutic development of WDR5 inhibitors for GBM and other advanced cancers.

Keywords: epigenetics; glioblastoma; stem cell.


Figures

Figure 1.
Figure 1.
SOX2 is enriched in the highly proliferative rim region of patient-derived GBM organoids. (AC) SOX2 IHC shows enrichment of SOX2+ cells in the GBM organoid rim. (D) Stem cell behavior (sphere formation) shown by limiting dilution assay in cells isolated from the organoid rim and core. Error bars are 95% confidence intervals. P-value was determined by χ2 test. (E) SOX2 IHC of four different patient-derived GBM organoid specimens. Fields of view (20× magnification) for individual specimens are shown. (F) SOX2 and OCT4 were knocked out via CRISPR:Cas9 in SORE6-GFP transduced GBM CSCs, and SORE6-GFP reporter expression was measured by flow cytometry. Bars represent geometric mean fluorescence intensity (MFI) for GFP relative to CD8A control, ±SD; symbols are biological replicates. P-values were determined by two-tailed, paired t-tests. (G) GBM organoids derived from SORE6-GFP transduced GBM CSCs were regionally labeled with the CellTracker blue CMAC fluorescent dye, dissociated, and analyzed by flow cytometry to measure GFP expression in the CMAC+ and CMAC niches. Error bars are SD; n = 3 biological replicates per line. P-values were determined by two-tailed, unpaired t-tests.
Figure 2.
Figure 2.
Spatial functional genomics screening defines genes essential in cancer niches. (AC) GBM CSCs were infected with an inducible shRNA library targeting epigenetic modifiers (mVenus reporter) and grown into organoids. (A) shRNAs were induced with doxycycline (leading to dsRed reporter expression), and after 3 wk, organoids were incubated with CellTracker blue CMAC fluorescent dye to label the entire outer rim region. Live confocal imaging of screened GBM528 organoids was used to verify proper spatial labeling prior to subsequent dissociation. (B) Z-stacks showing labeling intensity (pseudocolored) and individual image slices showing labeling overlap are shown using a 20× objective. (C) Subsequently, single cells were isolated from the organoids and separated into rim (CMAC+) or core (CMAC) populations by FACS, and then DNA was isolated for barcode sequencing and analysis. (D) Rank-ordered list of genes targeted in the shRNA screen, ranked by depletion of the shRNA in the SOX2-enriched niche (CMAC+). The dotted line represents P = 0.05 as determined by RIGER analysis of all hairpin sequences and replicates. Niche-specific hits are in blue, and common hits (including RPA3-positive control) are shown in black. (E) Venn diagram of screen hits showing localization in SOX2-enriched or SOX2-depleted niches or common to both regions.
Figure 3.
Figure 3.
WDR5 inhibition reduces the interaction between WDR5 and WRAD complex members and diminishes the H3K4me3 mark. (A) Model of the WRAD complex indicating points of protein–protein interactions, based on structures solved in Xue et al. (2019). (B) Immunoprecipitation of RBBP5 in GBM CSCs. Immunoblotting was performed for WRAD complex members and MLL1. Inputs are 10%. Representative experiments are shown. (C) Immunoprecipitation of RBBP5 after C16 inhibitor treatment (5 µM for 24 h) in GBM CSC models. Immunoblotting was performed for WRAD complex and MLL1. Inputs are 10%. Representative experiments are shown. (D) Related to C. Quantification of WDR5 and MLL1 immunoprecipitated by RBBP5, relative to actin quantity from each sample's input. Circles are biological replicates. (E) Western blots showing H3K4me3 levels in whole-cell lysates after C16 treatment for 72 h at different doses in CSC models. Representative experiments are shown. (F) Western blots showing H3K4me3 levels in whole-cell lysates after C16 treatment (5 µM for 72 h). Representative experiments are shown. (G) Quantification of H3K4me3, relative to H3 quantity after C16 treatment (5 µM for 72 h). Circles are biological replicates; lines connect DMSO- and C16-treated specimens from the same experiment.
Figure 4.
Figure 4.
WDR5 inhibition leads to H3K4me3 loss at essential CSC genes. (A) Number of H3K4me3 CUT&Tag peaks lost, gained, decreased, or increased (log2FC ≤ −1 or log2FC ≥ 1) after C16 treatment (3 μM for 72 h) of DI318 cells. (B) Bar plot showing distribution of peaks in gene regions that were lost in the C16 group (unique to the DMSO group) or reduced twofold or greater in the C16 treatment group. (C) MSigDB gene set annotations enriched among CUT&Tag peaks lost in the C16 treatment group. (D) Volcano plot of differential H3K4me3 peaks detected by CUT&Tag in DI318 CSCs. Blue dots represent H3K4me3 peaks reduced twofold or greater (log2FC ≤ −1) with C16 treatment, and orange circles are H3K4me3 peaks increased twofold or greater (log2FC ≥ 1) with C16 treatment. Multiple peaks (circles) may map to the same gene. (E) Representative H3K4me3 peaks from CUT&Tag at the indicated genes (from Integrative Genomics Viewer). (F) qPCR for specified genes in DI318 CSCs treated with the indicated doses of C16 for 72 h. Bars represent mean expression of n = 3 biological replicates, normalized to ACTB levels by ddCt method, ±SD.
Figure 5.
Figure 5.
WDR5 inhibition leads to H3K4me3 loss preferentially at POU domain DNA binding motifs, diminishes SORE6 reporter+ cells, and compromises GBM CSC self-renewal. (A) Top DNA binding motifs enriched within H3K4me3 peaks reduced (log2FC ≤ −1) with C16 treatment. Enrichment P-values were computed using the HOMER motif analysis tool set with all significant peaks from DiffBind analysis as background. (BD) GBM CSC models transduced with the SORE6-GFP reporter were treated with C16. (B) Representative images of day 7 after treatment. (C) GFP+ cell numbers were quantified over 10 d using IncuCyte live-cell imaging. One representative time course experiment is shown for each CSC model. Average GFP+ cell count per image is plotted at each time point, ±SEM per image. Multiple images were taken per well with n = 3 technical replicates (wells). (D) GFP+ cell numbers at day 7 after treatment with 5 µM C16. Each line is a biological replicate. P-values were determined by two-tailed, paired t-tests. (E) GFP intensity of live L0 SORE6-GFP cells after C16 treatment for 3 d. (F) In vitro limiting dilution analysis of CSCs in the presence of C16. Bars represent mean sphere formation frequency, ±SD; symbols are biological replicates. Sphere formation frequency from multiple independent replicates is shown in the table. For E and F, P-values were determined by one-way ANOVA and post-hoc Dunnett's multiple comparisons test.
Figure 6.
Figure 6.
WDR5 is more highly expressed in human GBM patient tumors than normal brains, and WDR5 inhibition is preferentially detrimental to malignant cells. (A) UMAP projection showing normal brain tissue and brain tumor sample source. (GTEx) Normal brain tissue samples from the Genotype–Tissue Expression Project, (TCGA) The Cancer Genome Atlas, (CGGA) the Chinese Glioma Genome Atlas, (CBTN) the Children's Brain Tumor Network. (B) UMAP projection of gene expression for WDR5 on Brain-UMAP. Scale bar is log2(TPM + 1). (C) RNA expression of WDR5 in selected tumor and normal groups. P-values of each group compared with GTEx were determined by unpaired t-tests with correction for multiple comparisons. (D) WDR5 expression from RNA sequencing of normal brain cell types and GBM lines. Each point represents average expression from multiple sequencing replicates. (E) WRAD complex member expression in CSCs, human NSCs, and human (h) and mouse (m) astrocytes. Mouse cells are primary astrocytic stem cells. Human astrocytes are h-TERT immortalized. (F,G) Astrocytes and immortalized/transformed CB660 human NSCs were treated with a range of concentrations of WDR5 inhibitor C16. After 7 d, viable cell counts were measured by CellTiter Glo viability assay. Values represent mean luminescence values normalized to DMSO-treated cells. One representative curve per cell model is shown. Average IC50 values and number of replicates are shown in Table 1. Key for immortalized/transformed NSC-CB660 cells: (PhT) addition of dominant-negative p53DD and hTERT; (PhTCC) dominant-negative p53DD, hTERT, CyclinD1, and CDK4R24C; (Myc) c-Myc; and (Ras) H-RasV12. (H) Human GBM CSCs or NSCs were treated with WDR5 inhibitor C16 for 4 d and assessed for apoptosis by annexinV and DAPI staining by flow cytometry. Error bars are ±SD; circles are biological replicates. P-values were determined by one-way ANOVA and post-hoc Dunnett's multiple comparisons test.
Figure 7.
Figure 7.
Pharmacologic and genetic inhibition of WDR5 reduces GBM CSC growth, self-renewal, and in vivo tumor growth. (A) Proliferation of WDR5 inhibitor C16-treated CSCs over 10 d, measured by IncuCyte live-cell imaging. Values represent mean fold change in cell count relative to day 0, ±SD; n = 3 technical replicates; one representative experiment is shown per CSC model. (B) GBM CSCs were treated with a range of concentrations of C16 and subjected to caspase 3/7 Glo luminescence assay after 4 d to measure caspase 3/7 activity. Bars represent fold change in caspase 3/7 activity per cell relative to the average for DMSO-treated cells, ±SD; circles are biological replicates. P-values were determined by one-way ANOVA and post-hoc Dunnett's multiple comparisons test. (C) Five-hundred-thousand DI318 CSCs were implanted into the flanks of mice, and once tumors developed, 3 mg/kg C16 was injected into the tumors daily. n = 10 per group. (D) Five-hundred-thousand L0 CSCs were implanted into the flanks of mice, and once tumors developed, 10 mg/kg C16 was injected intraperitoneally daily. n = 9 (DMSO); n = 10 (C16). For C and D, tumor volume over time normalized to tumor size at day 0 is shown. P-values were determined by two-tailed, unpaired t-test comparing means per group at each time point. (E) Immunoprecipitation of RBBP5 and immunoblot for WDR5 were performed on flank tumor lysates isolated from treated mice in D. Symbols are individual mice. WDR5 quantity in RBBP5 pull-down relative to tubulin quantity in input (10%) is plotted. (F) Short hairpin RNA-mediated targeting of WDR5 with two nonoverlapping short hairpins in CSC models. Western blots show the level of WDR5 protein in CSCs infected with a nontargeting (shNT) control virus or WDR5 knockdown (KD) viruses. (G) Proliferation of WDR5 KD and shNT control CSCs over 7 d, determined by IncuCyte live-cell imaging. Values represent mean fold change in cell count relative to day 0, ±SD; n = 3 biological replicates, P-values were determined by two-tailed, unpaired t-tests comparing means per group at each time point. (H) Equal numbers of WDR5 KD and shNT control CSCs were plated, and viable cell counts were measured by CellTiter Glo luminescence viability assay after 72 h. Bars represent mean luminescence values relative to the average for shNT control cells, ±SD; circles are biological replicates, (I) In vitro limiting dilution analysis was performed on WDR5 KD and shNT control CSCs. Bars represent mean sphere formation frequency, ±SD; symbols are biological replicates. For H and I, P-values were determined by one-way ANOVA and post-hoc Dunnett's multiple comparisons test. (J) Related to I, mean sphere formation frequency for each group is shown. (K) Kaplan–Meier survival plot of mice intracranially implanted with WDR5 KD or shNT control CSCs. P-values indicate comparisons between shNT and shWDR5 and were determined by log rank analysis. n = 10 per group; median survival shNT: 33.5 d; shWDR5 #12: 42 d; shWDR5 #47: 62 d.

References

    1. Alicea-Velázquez NL, Shinsky SA, Loh DM, Lee JH, Skalnik DG, Cosgrove MS. 2016. Targeted disruption of the interaction between WD-40 repeat protein 5 (WDR5) and mixed lineage leukemia (MLL)/SET1 family proteins specifically inhibits MLL1 and SETd1A methyltransferase complexes. J Biol Chem 291: 22357–22372. 10.1074/jbc.M116.752626 - DOI - PMC - PubMed
    1. Alvarado AG, Thiagarajan PS, Mulkearns-Hubert EE, Silver DJ, Hale JS, Alban TJ, Turaga SM, Jarrar A, Reizes O, Longworth MS, et al. 2017. Glioblastoma cancer stem cells evade innate immune suppression of self-renewal through reduced TLR4 expression. Cell Stem Cell 20: 450–461.e4. 10.1016/j.stem.2016.12.001 - DOI - PMC - PubMed
    1. Ang YS, Tsai SY, Lee DF, Monk J, Su J, Ratnakumar K, Ding J, Ge Y, Darr H, Chang B, et al. 2011. Wdr5 mediates self-renewal and reprogramming via the embryonic stem cell core transcriptional network. Cell 145: 183–197. 10.1016/j.cell.2011.03.003 - DOI - PMC - PubMed
    1. Arora S, Szulzewsky F, Jensen M, Nuechterlein N, Pattwell SS, Holland EC. 2023. An RNA seq-based reference landscape of human normal and neoplastic brain. bioRxiv. 10.1101/2023.01.03.522658 - DOI - PMC - PubMed
    1. Benayoun BA, Pollina EA, Ucar D, Mahmoudi S, Karra K, Wong ED, Devarajan K, Daugherty AC, Kundaje AB, Mancini E, et al. 2014. H3k4me3 breadth is linked to cell identity and transcriptional consistency. Cell 158: 673–688. 10.1016/j.cell.2014.06.027 - DOI - PMC - PubMed

Publication types

MeSH terms

Substances

LinkOut - more resources