. 2023 Feb 2;14(1):560.
doi: 10.1038/s41467-023-36058-2.

The AAA+ chaperone VCP disaggregates Tau fibrils and generates aggregate seeds in a cellular system

Affiliations

The AAA+ chaperone VCP disaggregates Tau fibrils and generates aggregate seeds in a cellular system

Itika Saha et al. Nat Commun. .

Abstract

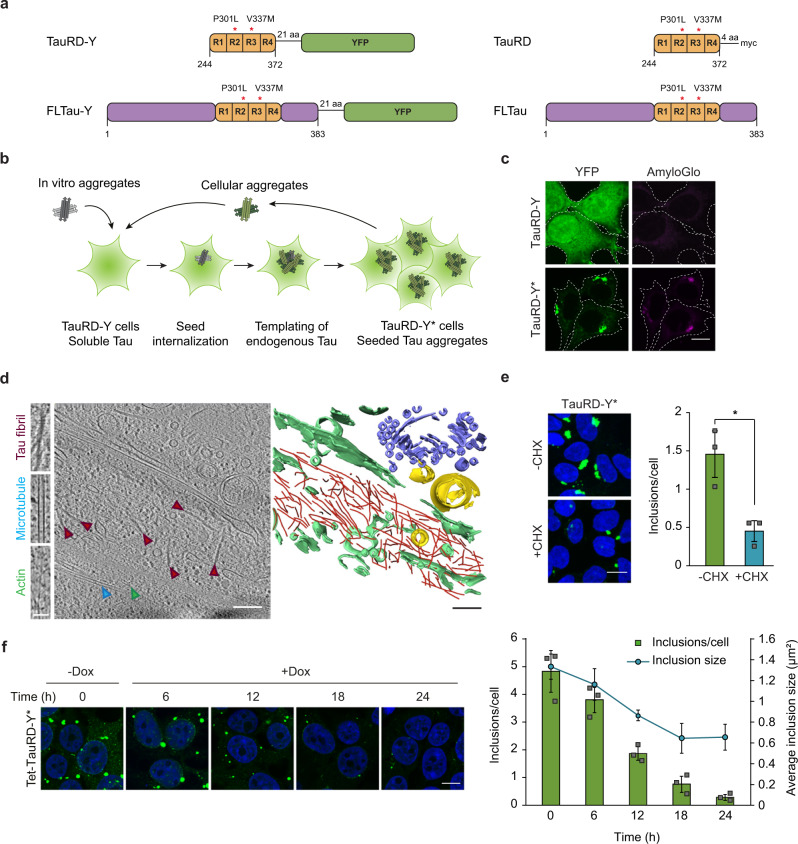
Amyloid-like aggregates of the microtubule-associated protein Tau are associated with several neurodegenerative disorders including Alzheimer's disease. The existence of cellular machinery for the removal of such aggregates has remained unclear, as specialized disaggregase chaperones are thought to be absent in mammalian cells. Here we show in cell culture and in neurons that the hexameric ATPase valosin-containing protein (VCP) is recruited to ubiquitylated Tau fibrils, resulting in their efficient disaggregation. Aggregate clearance depends on the functional cooperation of VCP with heat shock 70 kDa protein (Hsp70) and the ubiquitin-proteasome machinery. While inhibition of VCP activity stabilizes large Tau aggregates, disaggregation by VCP generates seeding-active Tau species as byproduct. These findings identify VCP as a core component of the machinery for the removal of neurodegenerative disease aggregates and suggest that its activity can be associated with enhanced aggregate spreading in tauopathies.


Conflict of interest statement

The authors declare no competing interests.

Figures

Fig. 1
Fig. 1. TauRD-Y forms amyloid-like aggregates that are cleared from cells.
a Schematic representation of Tau constructs used in this study. TauRD-Y, the repeat domain, and FLTau-Y, the 0N4R isoform of full-length (FL) Tau with two frontotemporal dementia-associated mutations, P301L and V337M, fused to YFP via 21 amino acid (aa) linkers or without YFP. b Schematic representation of aggregate seeding. Extracellular addition of preformed Tau aggregates induces templating of intracellular Tau into aggregates that propagate with cell division. Aggregate seeds may be generated in vitro or contained in cell lysate. TauRD-Y, naïve cells containing soluble TauRD-Y; TauRD-Y*, cells containing TauRD-Y aggregates. c Staining of TauRD-Y and TauRD-Y* cells with the amyloid-specific dye Amylo-Glo (magenta). White dashed lines indicate cell boundaries. Scale bar, 10 µm. d TauRD-Y aggregates are fibrillar in structure. Left, a 1.7 nm thick tomographic slice of a TauRD inclusion from TauRD-Y* cells is shown. Red, blue and green arrowheads indicate representative TauRD-Y fibril, microtubule and actin, respectively. Right, 3D rendering of corresponding tomogram showing TauRD-Y fibrils (red), Golgi (purple), mitochondria (yellow) and ER (green). Scale bars, 200 nm, inset 40 nm. e Aggregate clearance. Left, TauRD-Y* cells were treated for 24 h with cycloheximide (CHX; 50 µg/mL) where indicated. Nuclei were counterstained with DAPI (blue). Scale bar, 10 µm. Right, quantification of TauRD-Y foci. Mean ± s.d.; n = 3; 500–600 cells analyzed per experiment; *p < 0.05 (p = 0.0151) from two-tailed Student’s paired t-test. f Left, representative images of Tet-TauRD-Y* cells treated with doxycycline (Dox; 50ng/mL) for the indicated times. Right, quantification of inclusions per cell and average inclusion size (µm2). Mean ± s.d.; n = 3. Scale bar, 10 µm. Source data are provided as a Source Data file.
Fig. 2
Fig. 2. Disaggregation of Tau aggregates is dependent on VCP activity.
a Volcano plot of TauRD-Y interactome from TauRD-Y and TauRD-Y* cells. Unlabeled green and blue symbols represent proteasome subunits of 19 S and 20 S, respectively. VCP and its cofactors are highlighted. P-values from one-sample test. b Association of VCP with TauRD-Y inclusions. Immunofluorescence staining of VCP (red) and YFP fluorescence of TauRD-Y (green) in TauRD-Y and TauRD-Y* cells. Representative images from at least three independent experiments are shown. Scale bar, 10 µm. c Filter trap analysis of lysates from Tet-TauRD-Y* cells treated for 24 h with doxycycline (Dox; 50 ng/mL) alone or in combination with NMS-873 (NMS; 2.5 µM) or Epoxomicin (Epox; 50 nM). Aggregated and total TauRD-Y levels were determined by immunoblotting against GFP. GAPDH served as loading control. Representative blots from at least three independent experiments are shown. d Left, representative images of Tet-TauRD-Y* cells treated as in (c). Scale bar, 10 µm. Right, quantification of the number of TauRD-Y inclusions per cell. Mean ± s.d.; n = 4; 300–600 cells analyzed per experiment. *p < 0.05 (+ Dox vs + Dox + NMS, p = 0.0019); **p < 0.01 (+ Dox vs + Dox + Epox, p = 0.0004) from two-tailed Student’s paired t-test. e Association of VCP with FLTau inclusions. Immunofluorescence staining of VCP (red) and Tau with Tau-5 antibody (green) in FLTau and FLTau* cells. Representative images from three independent experiments are shown. Scale bar, 10 µm. f Filter trap analysis of lysates from Tet-FLTau* cells treated for 24 h with doxycycline (Dox; 50 ng/mL) alone or in combination with NMS-873 (NMS; 2.5 µM) or Epoxomicin (Epox; 50 nM). Aggregated and total FLTau levels were determined by immunoblotting using AT8 and Tau-5 antibodies, respectively. GAPDH served as the loading control. Representative blots from at least three independent experiments are shown. Source data are provided as a Source Data file.
Fig. 3
Fig. 3. Disaggregation of TauRD-Y aggregates in primary neurons is dependent on VCP activity.
a Schematic representation of experimental timeline in primary neurons. DIV, days in vitro. b Association of VCP with TauRD-Y inclusions in primary neurons. Immunofluorescence staining of VCP (red) and YFP fluorescence of TauRD-Y (green). Arrows point to TauRD-Y inclusions containing VCP. Representative images from three independent experiments are shown. Scale bars, 10 µm. c Fibrillar TauRD-Y aggregates in primary neurons. Left, a 1.4 nm thick tomographic slice of a TauRD inclusion from neurons is shown. Red arrowheads indicate TauRD-Y fibrils. Right, 3D rendering of corresponding tomogram showing TauRD-Y fibrils (red), vesicles (blue), and ER (green). A representative tomogram from two independent experiments is shown. Scale bar, 350 nm. d Toxicity of TauRD-Y aggregation in primary neurons. Untransduced neurons or neurons transduced with TauRD-Y were treated with cell lysates containing TauRD-Y aggregates where indicated. Viability was measured 4 days later using an MTT assay. Mean ± s.d.; n = 3; *p < 0.05 (Control + Seed vs TauRD-Y + Seed, p = 0.0184; TauRD-Y - Seed vs TauRD-Y + Seed, p = 0.0142); n.s. non-significant (Control - Seed vs Control + Seed, p = 0.2074) from two-way ANOVA with Tukey post hoc test. e Left, representative images of primary neurons expressing TauRD-Y, exposed to cell lysates containing TauRD-Y aggregates and treated for 4 h with NMS-873 (NMS; 0.5 µM) where indicated. Dashed lines indicate the contours of the cells. Scale bars, 20 µm. Right, quantification of area occupied by TauRD-Y aggregates as a percentage of the cell body area. Mean ± s.d.; n = 3; **p < 0.01 (+ Seed + DMSO vs + Seed + NMS, p = 0.0098); n.s. non-significant (- Seed + DMSO vs - Seed + NMS, p = 0.2998) from unpaired t test. Source data are provided as a Source Data file.
Fig. 4
Fig. 4. Ubiquitination is necessary for VCP recruitment and disaggregation.
a Immunoprecipitation of TauRD-Y from lysates of control HEK cells, TauRD-Y, and TauRD-Y* cells in the presence of 0.1% SDS using anti-GFP beads. Eluates were analyzed by immunoblotting with antibodies against GFP and K48-linked ubiquitin chains (UbK48). The TauRD-Y band shows the unmodified protein and arrowheads point at increments in ubiquitin conjugation (Ub1-Ub4). Representative blots from two independent experiments are shown. b Inhibition of ubiquitylation of TauRD inclusions. TauRD-Y* cells were treated for 12 h with MLN7243 (MLN; 0.5 µM) followed by immunofluorescence analysis with a UbK48 antibody (red). Representative images from two independent experiments are shown. c Inhibition of TauRD ubiquitylation prevents VCP association. TauRD-Y* cells were treated as in (b). VCP (red) was visualized by immunofluorescence. Representative images from two independent experiments are shown. Scale bars, 10 µm. d Filter trap analysis of lysates from Tet-TauRD-Y* cells treated for 24 h with 50 ng/mL doxycycline alone or in combination with 0.2 µM MLN7243 or 50 nM Epoxomicin. Aggregated and total TauRD-Y levels were determined by immunoblotting against GFP. GAPDH served as a loading control. Representative blots from two independent experiments are shown.
Fig. 5
Fig. 5. Effects of VCP mutants on Tau disaggregation.
a Schematic representation of VCP variants used in this study. Wild type (WT), D395G (DG), A232E (AE), R155H (RH) and E305Q/E578Q (EQ/EQ) VCP were tagged with a C-terminal myc-tag. Red asterisks indicate relative positions of the mutations. b Association of transiently expressed VCP variants with TauRD-Y inclusions. Immunofluorescence staining of myc (red) and YFP fluorescence of TauRD-Y (green) in TauRD-Y* cells. Representative images from two independent experiments are shown. Scale bar, 10 µm. c Filter trap analysis of lysates from Tet-TauRD-Y* cells transiently transfected with empty vector (EV) or indicated VCP variants for 24 h, and treated for another 24 h with doxycycline (Dox; 50 ng/mL). Aggregated TauRD-Y and overexpressed VCP levels were determined by immunoblotting against GFP and myc, respectively. GAPDH served as loading control. Representative blots from three independent experiments are shown. d Left, representative images of Tet-TauRD-Y* cells treated as in (c). Scale bar, 10 µm. Right, quantification of aggregate foci. Mean ± s.d.; n = 3; > 400 cells analyzed per experiment; *p < 0.05 (EV + Dox vs EQ/EQ + Dox, p = 0.0209) from two-tailed Student’s paired t-test. Source data are provided as a Source Data file.
Fig. 6
Fig. 6. VCP-mediated disaggregation generates seeding-competent TauRD-Y species.
a Experimental scheme to assess the effects of inhibitors of VCP, Hsp70, proteasome, and ubiquitylation on the level of TauRD-Y aggregate seeds in TauRD-Y* cells. b Flow cytometry analysis of aggregate seeding in TauRD-TY reporter cells after the addition of lysates from TauRD-Y* cells treated with NMS (VCP inhibitor), VER (Hsp70 inhibitor), Epox (proteasome inhibitor) and MLN (ubiquitylation inhibitor). Fold changes with respect to DMSO-treated cells are shown. Mean ± s.d.; NMS and Epox n = 4, VER n = 5, MLN n = 3; ***p < 0.001 (DMSO vs NMS, p = 8.69 × 10−7; DMSO vs MLN, p = 4.2 × 10−5) from one-way ANOVA with Tukey post hoc test. c Flow cytometry analysis of aggregate seeding in TauRD-TY reporter cells after addition of lysates from TauRD-Y* cells transfected with empty vector (EV), wild-type (WT), D395G (DG) and ATPase deficient E305Q/E578Q (EQ/EQ) VCP constructs. Fold changes with respect to EV transfected cells are shown. Mean ± s.d. n = 3; ***p < 0.001 (EV vs EQ/EQ, p = 0.0007) from one-way ANOVA with Tukey post hoc test. d Left, fractionation of TauRD-Y from DMSO and NMS-873 treated lysates of TauRD-Y* cells by size exclusion chromatography (SEC). Equal amounts of total lysate protein were analyzed. Y-axis represents the relative amount of TauRD-Y in the high molecular weight (HMW) and the low molecular weight (LMW) fractions quantified by immunoblotting. Right, the ratio of TauRD-Y in HMW/LMW fractions. Mean ± s.d.; n = 3. **p < 0.01 (p = 0.002) from two-tailed Student’s paired t-test. Source data are provided as a Source Data file.
Fig. 7
Fig. 7. Model of VCP-mediated disaggregation of amyloid-like Tau aggregates.
Modification of aggregates with K48-linked ubiquitin chains allows the recruitment of VCP. VCP may extract ubiquitylated Tau monomer from fibril ends or from within fibrils. Monomers are directly targeted for proteasomal degradation. Extraction from internal sites results in fibril fragmentation and the generation of oligomers that act as seeds for aggregation. Completion of oligomer disaggregation may be accomplished by the 19 S proteasome, perhaps with the participation of Hsp70 system (grey). Hsp70 may also contribute to aggregate clearance by preventing re-aggregation of disaggregation products.

References

    1. Goedert M, Eisenberg DS, Crowther RA. Propagation of Tau aggregates and neurodegeneration. Annu. Rev. Neurosci. 2017;40:189–210. - PubMed
    1. Strang KH, Golde TE, Giasson BI. MAPT mutations, tauopathy, and mechanisms of neurodegeneration. Lab. Investig. 2019;99:912–928. - PMC - PubMed
    1. Lewis J, et al. Neurofibrillary tangles, amyotrophy and progressive motor disturbance in mice expressing mutant (P301L) Tau protein. Nat. Genet. 2000;25:402–405. - PubMed
    1. Allen B, et al. Abundant Tau filaments and nonapoptotic neurodegeneration in transgenic mice expressing human P301S Tau protein. J. Neurosci. 2002;22:9340–9351. - PMC - PubMed
    1. Santacruz K, et al. Tau suppression in a neurodegenerative mouse model improves memory function. Science. 2005;309:476–481. - PMC - PubMed

Publication types