. 2023 Mar;24(3):516-530.
doi: 10.1038/s41590-023-01419-y. Epub 2023 Feb 2.

Phosphoinositide acyl chain saturation drives CD8+ effector T cell signaling and function

Affiliations

Phosphoinositide acyl chain saturation drives CD8+ effector T cell signaling and function

Joy Edwards-Hicks et al. Nat Immunol. 2023 Mar.

Abstract

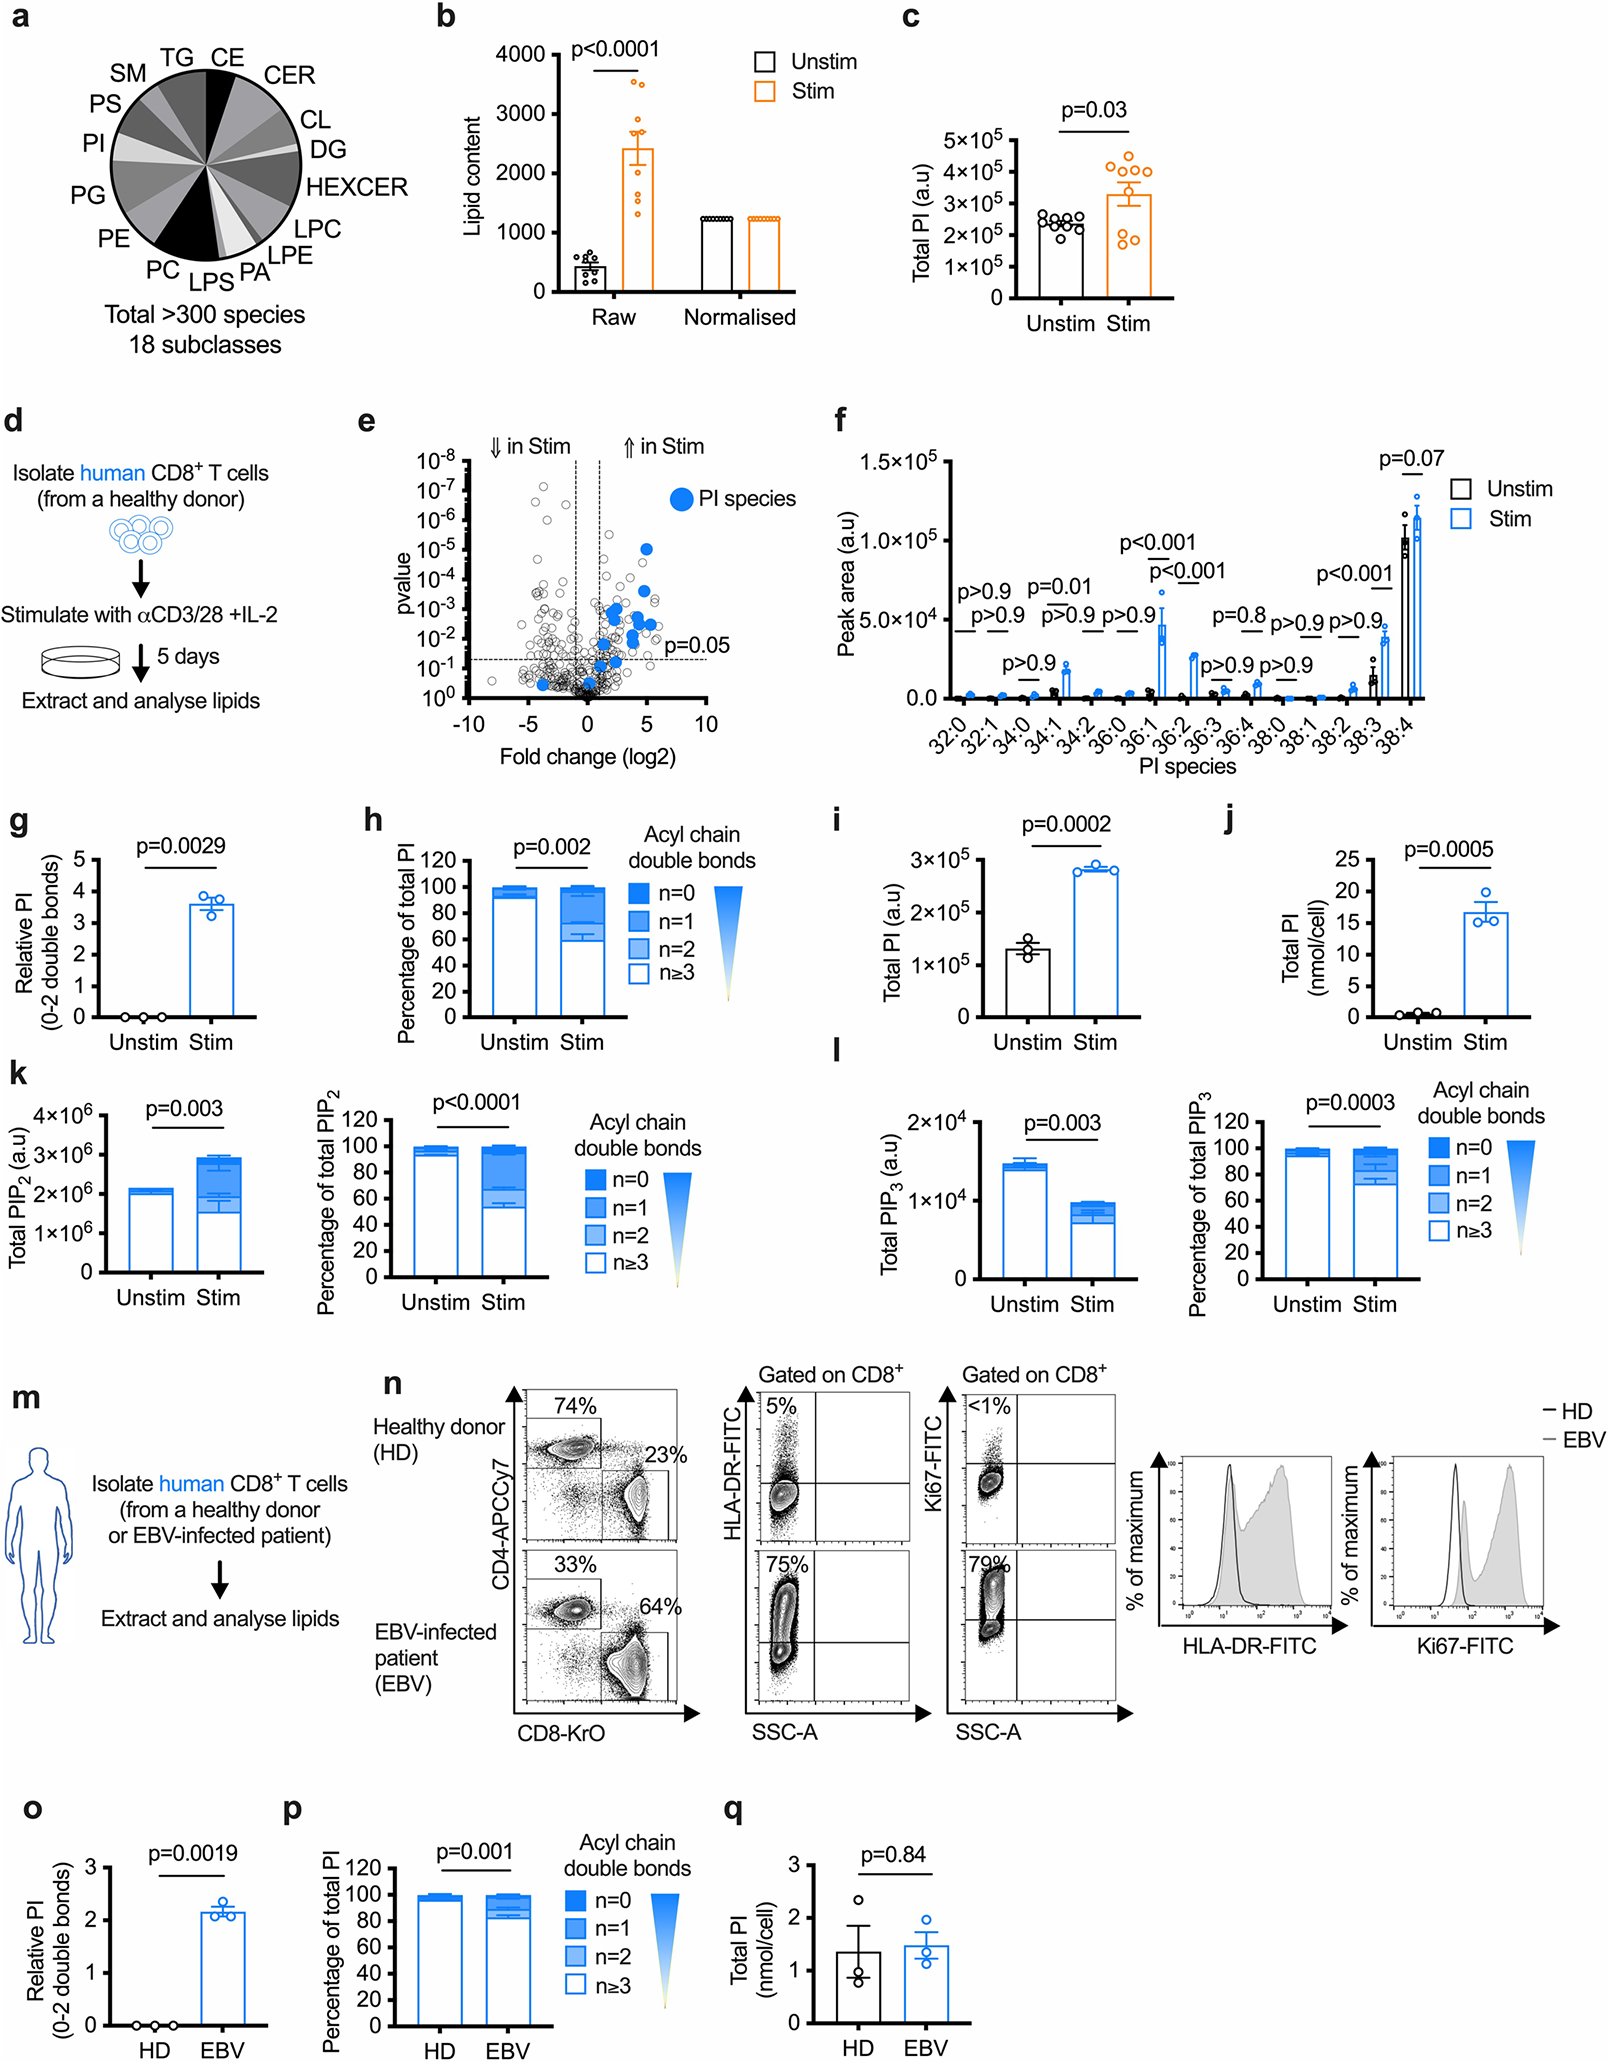
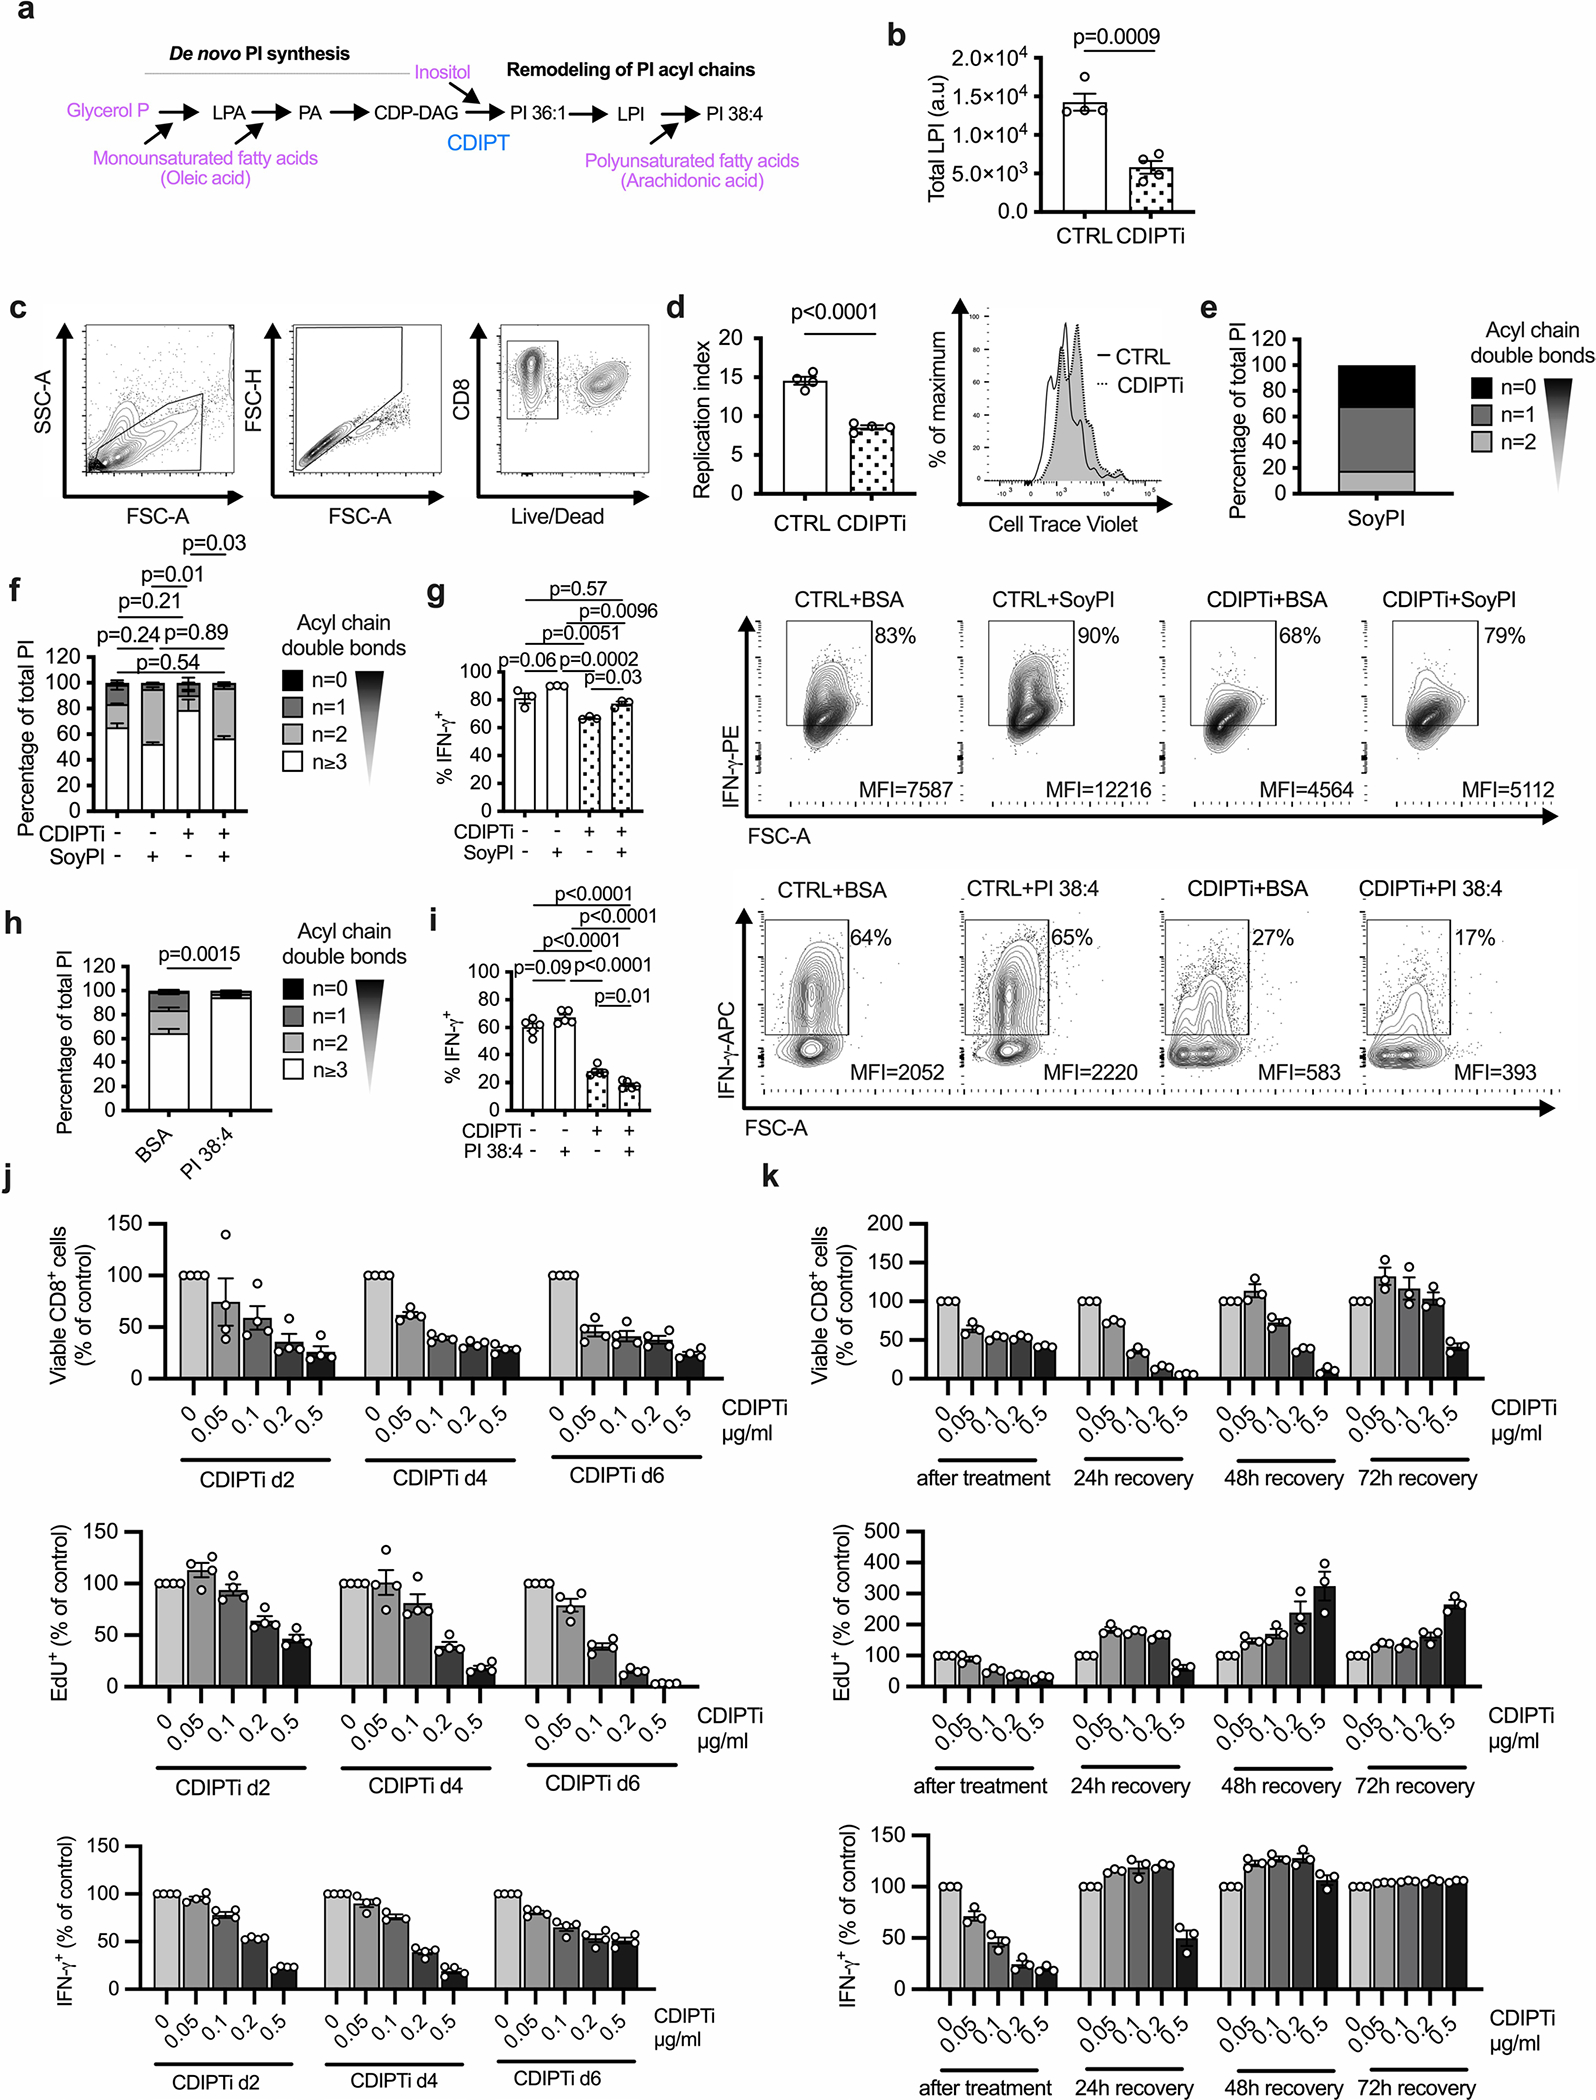
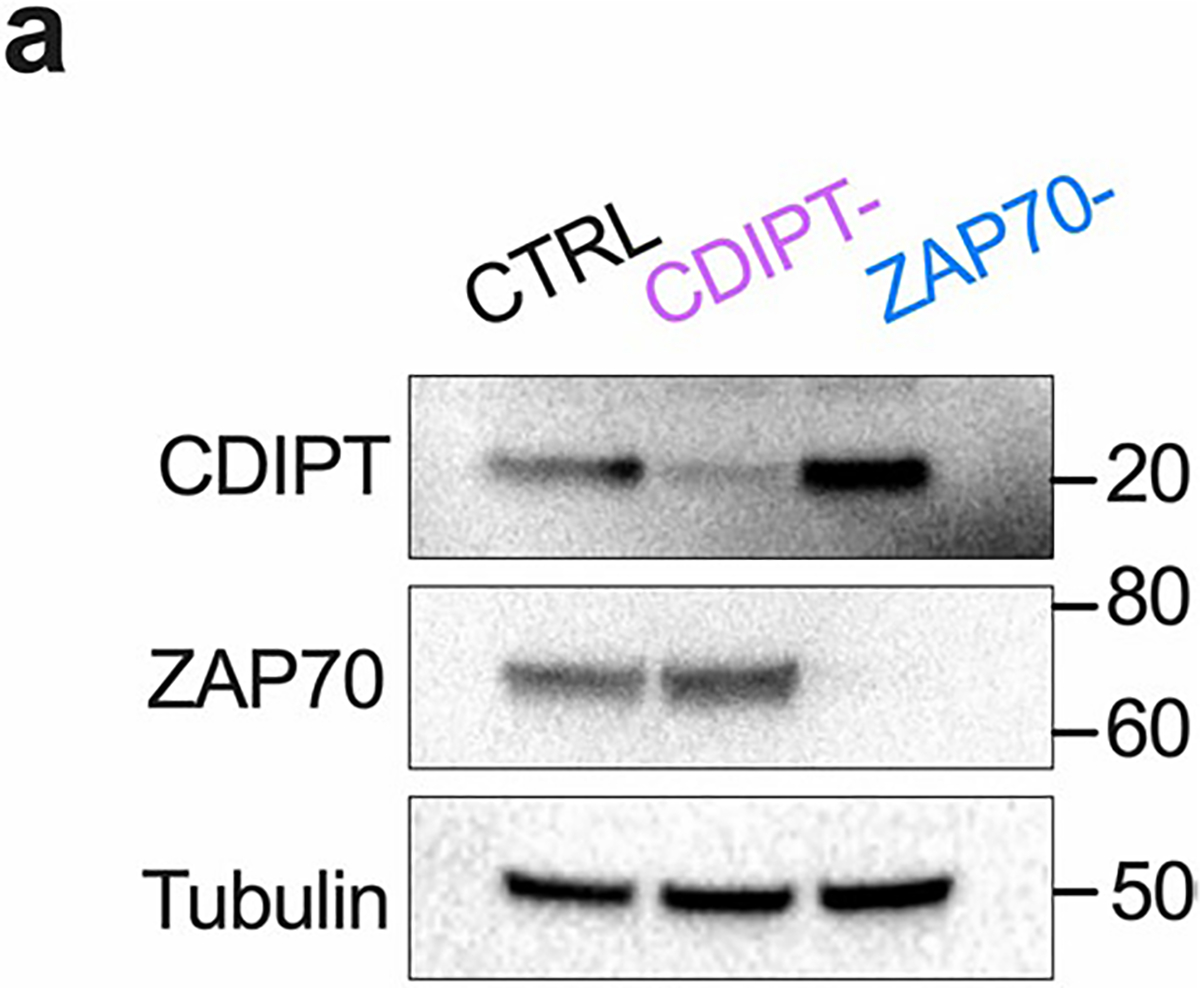
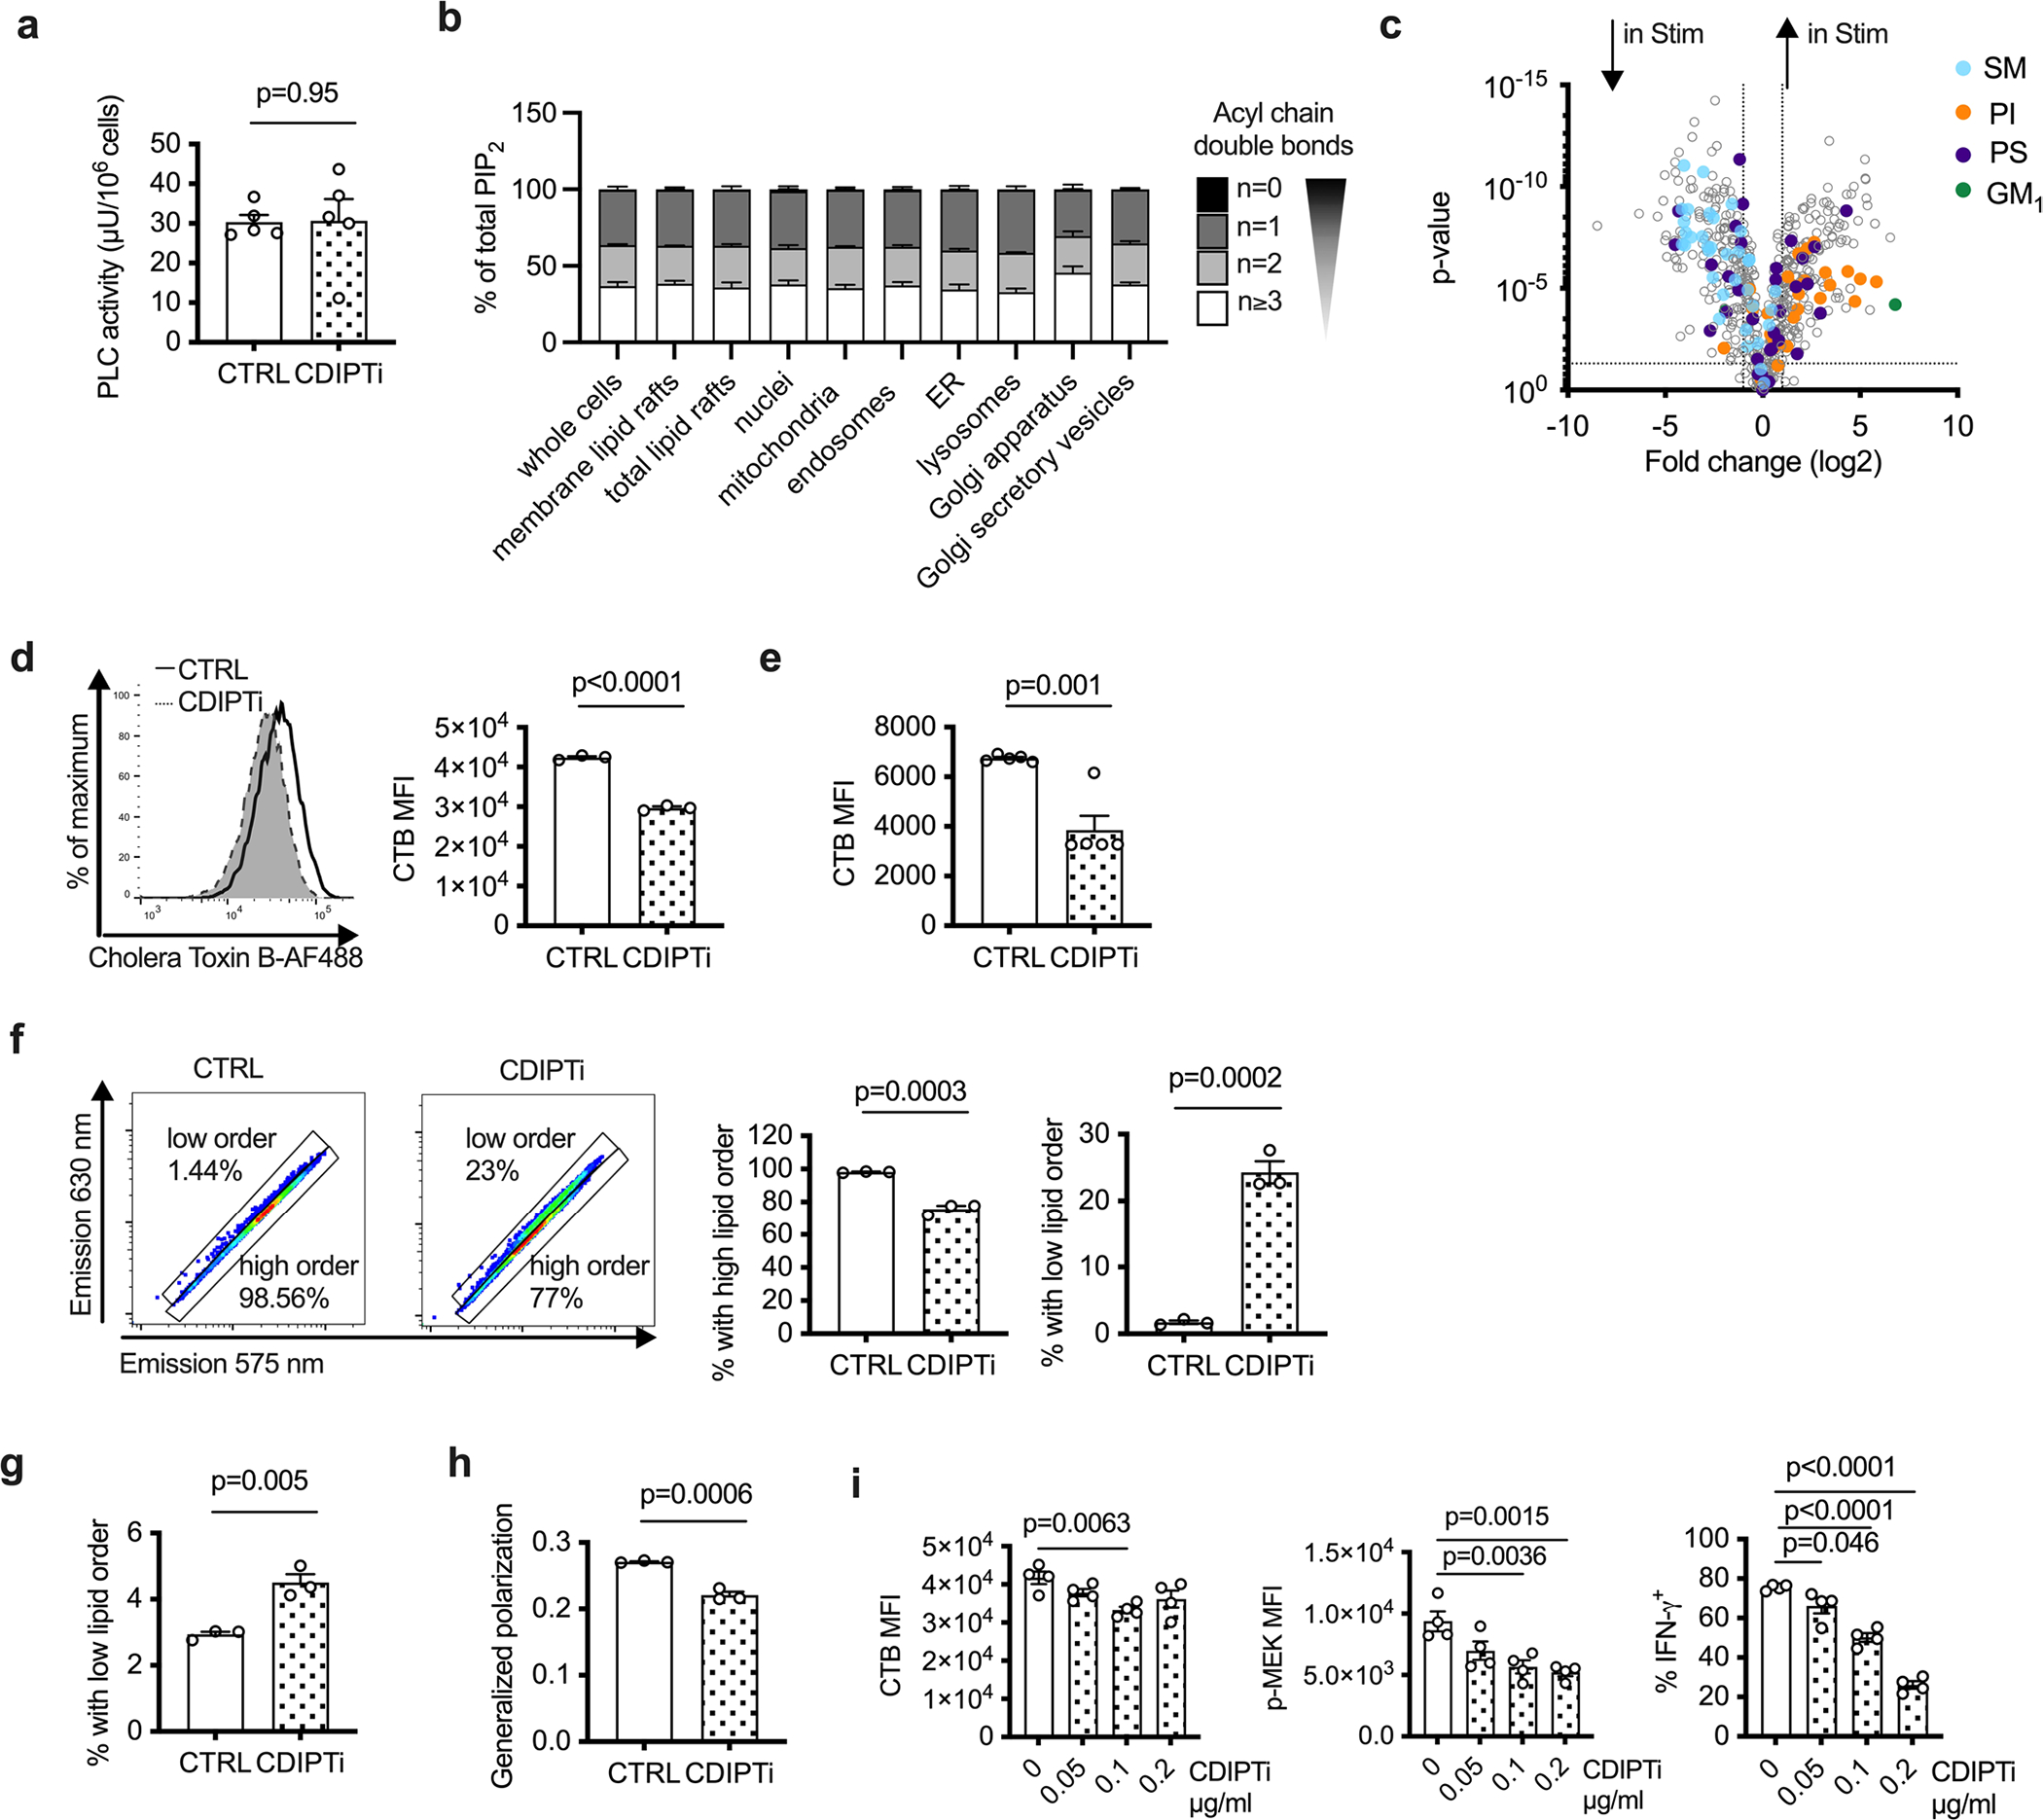
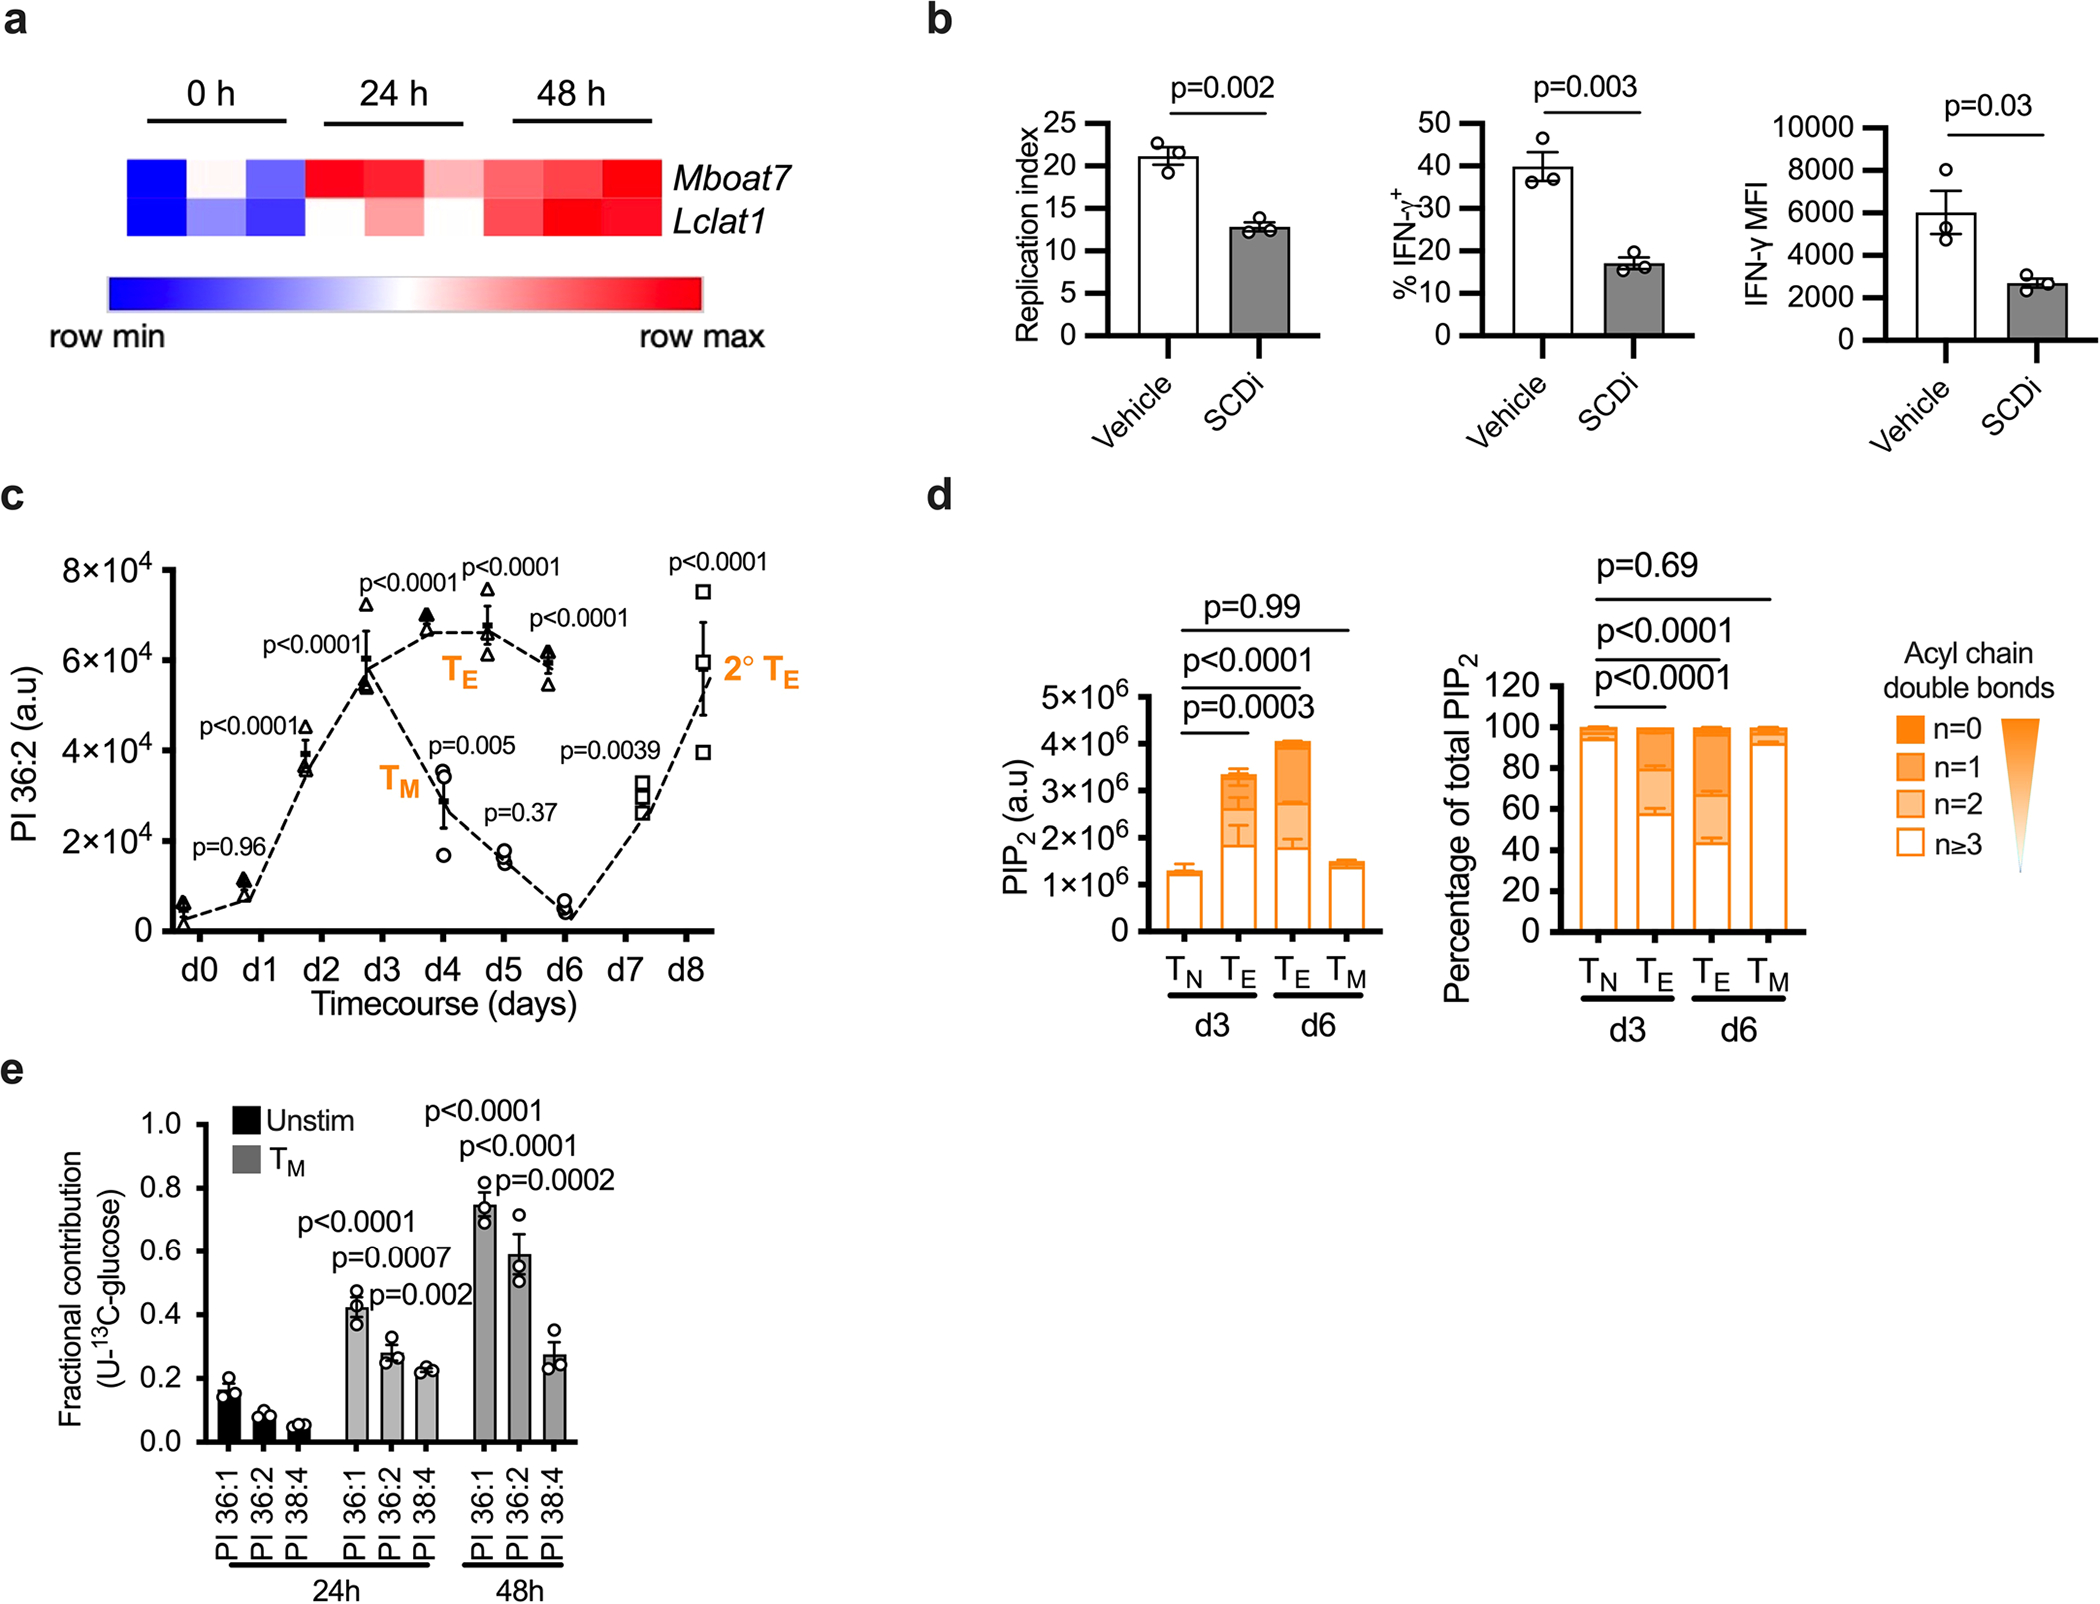
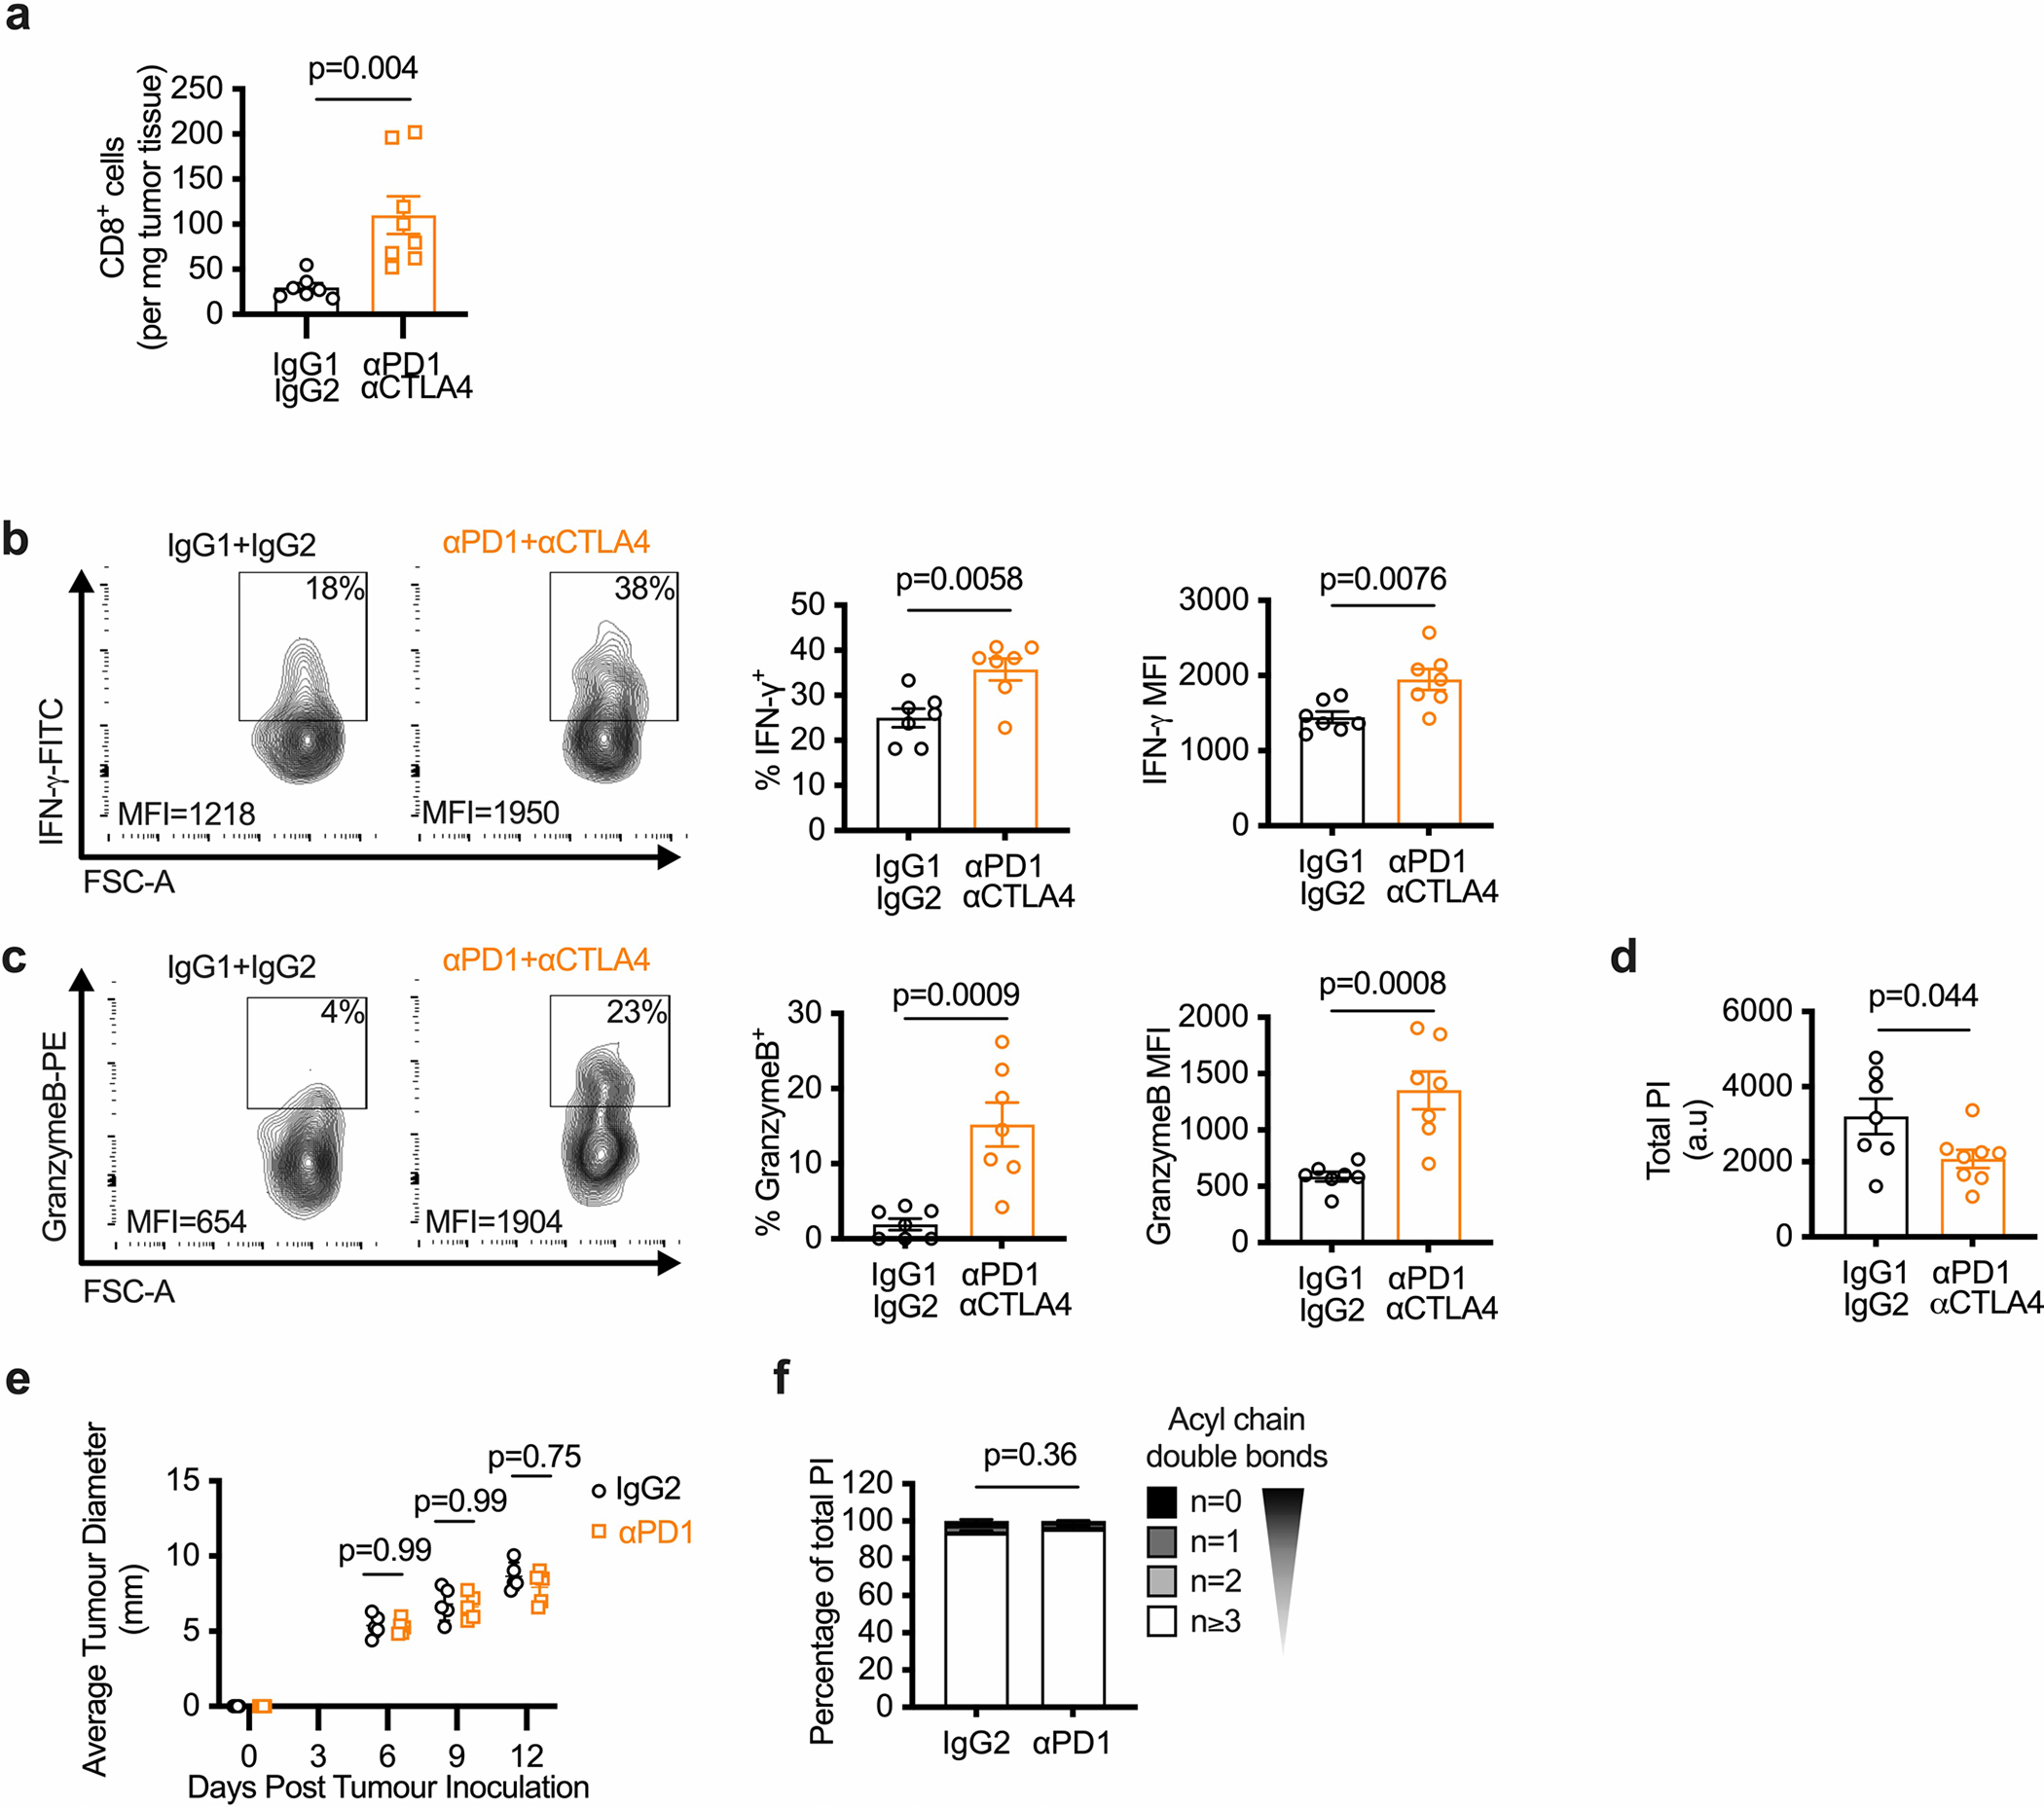
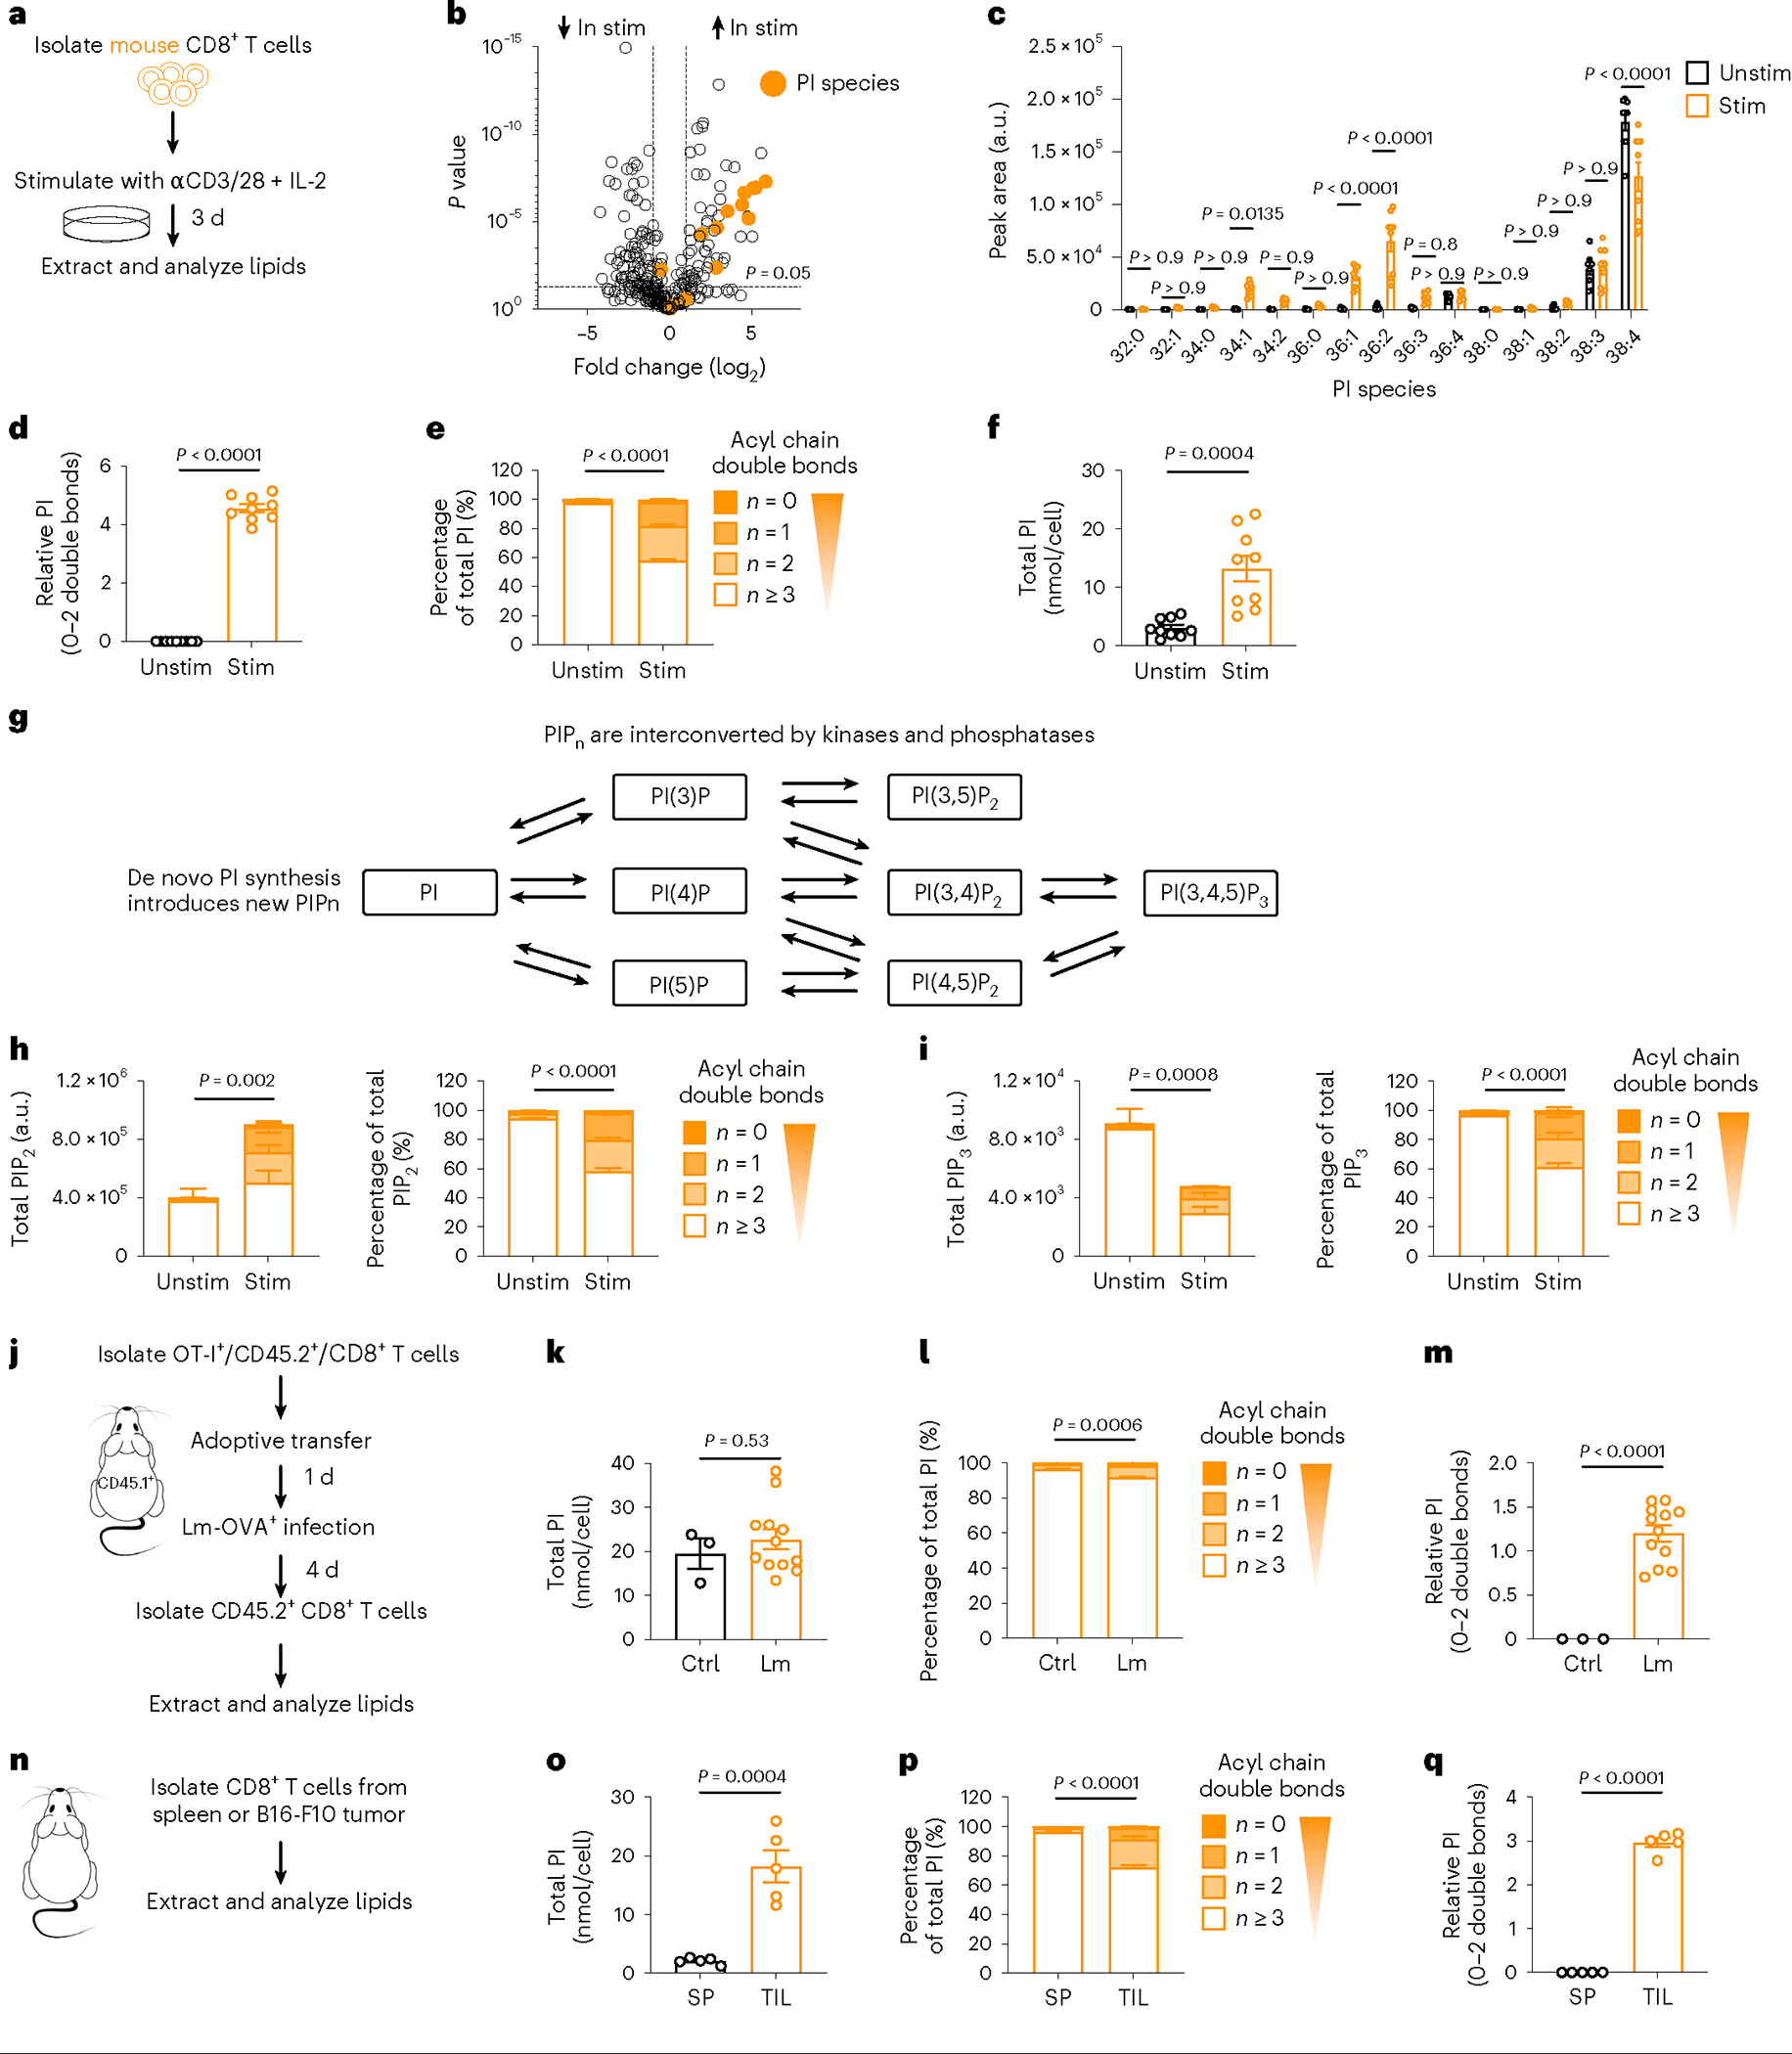
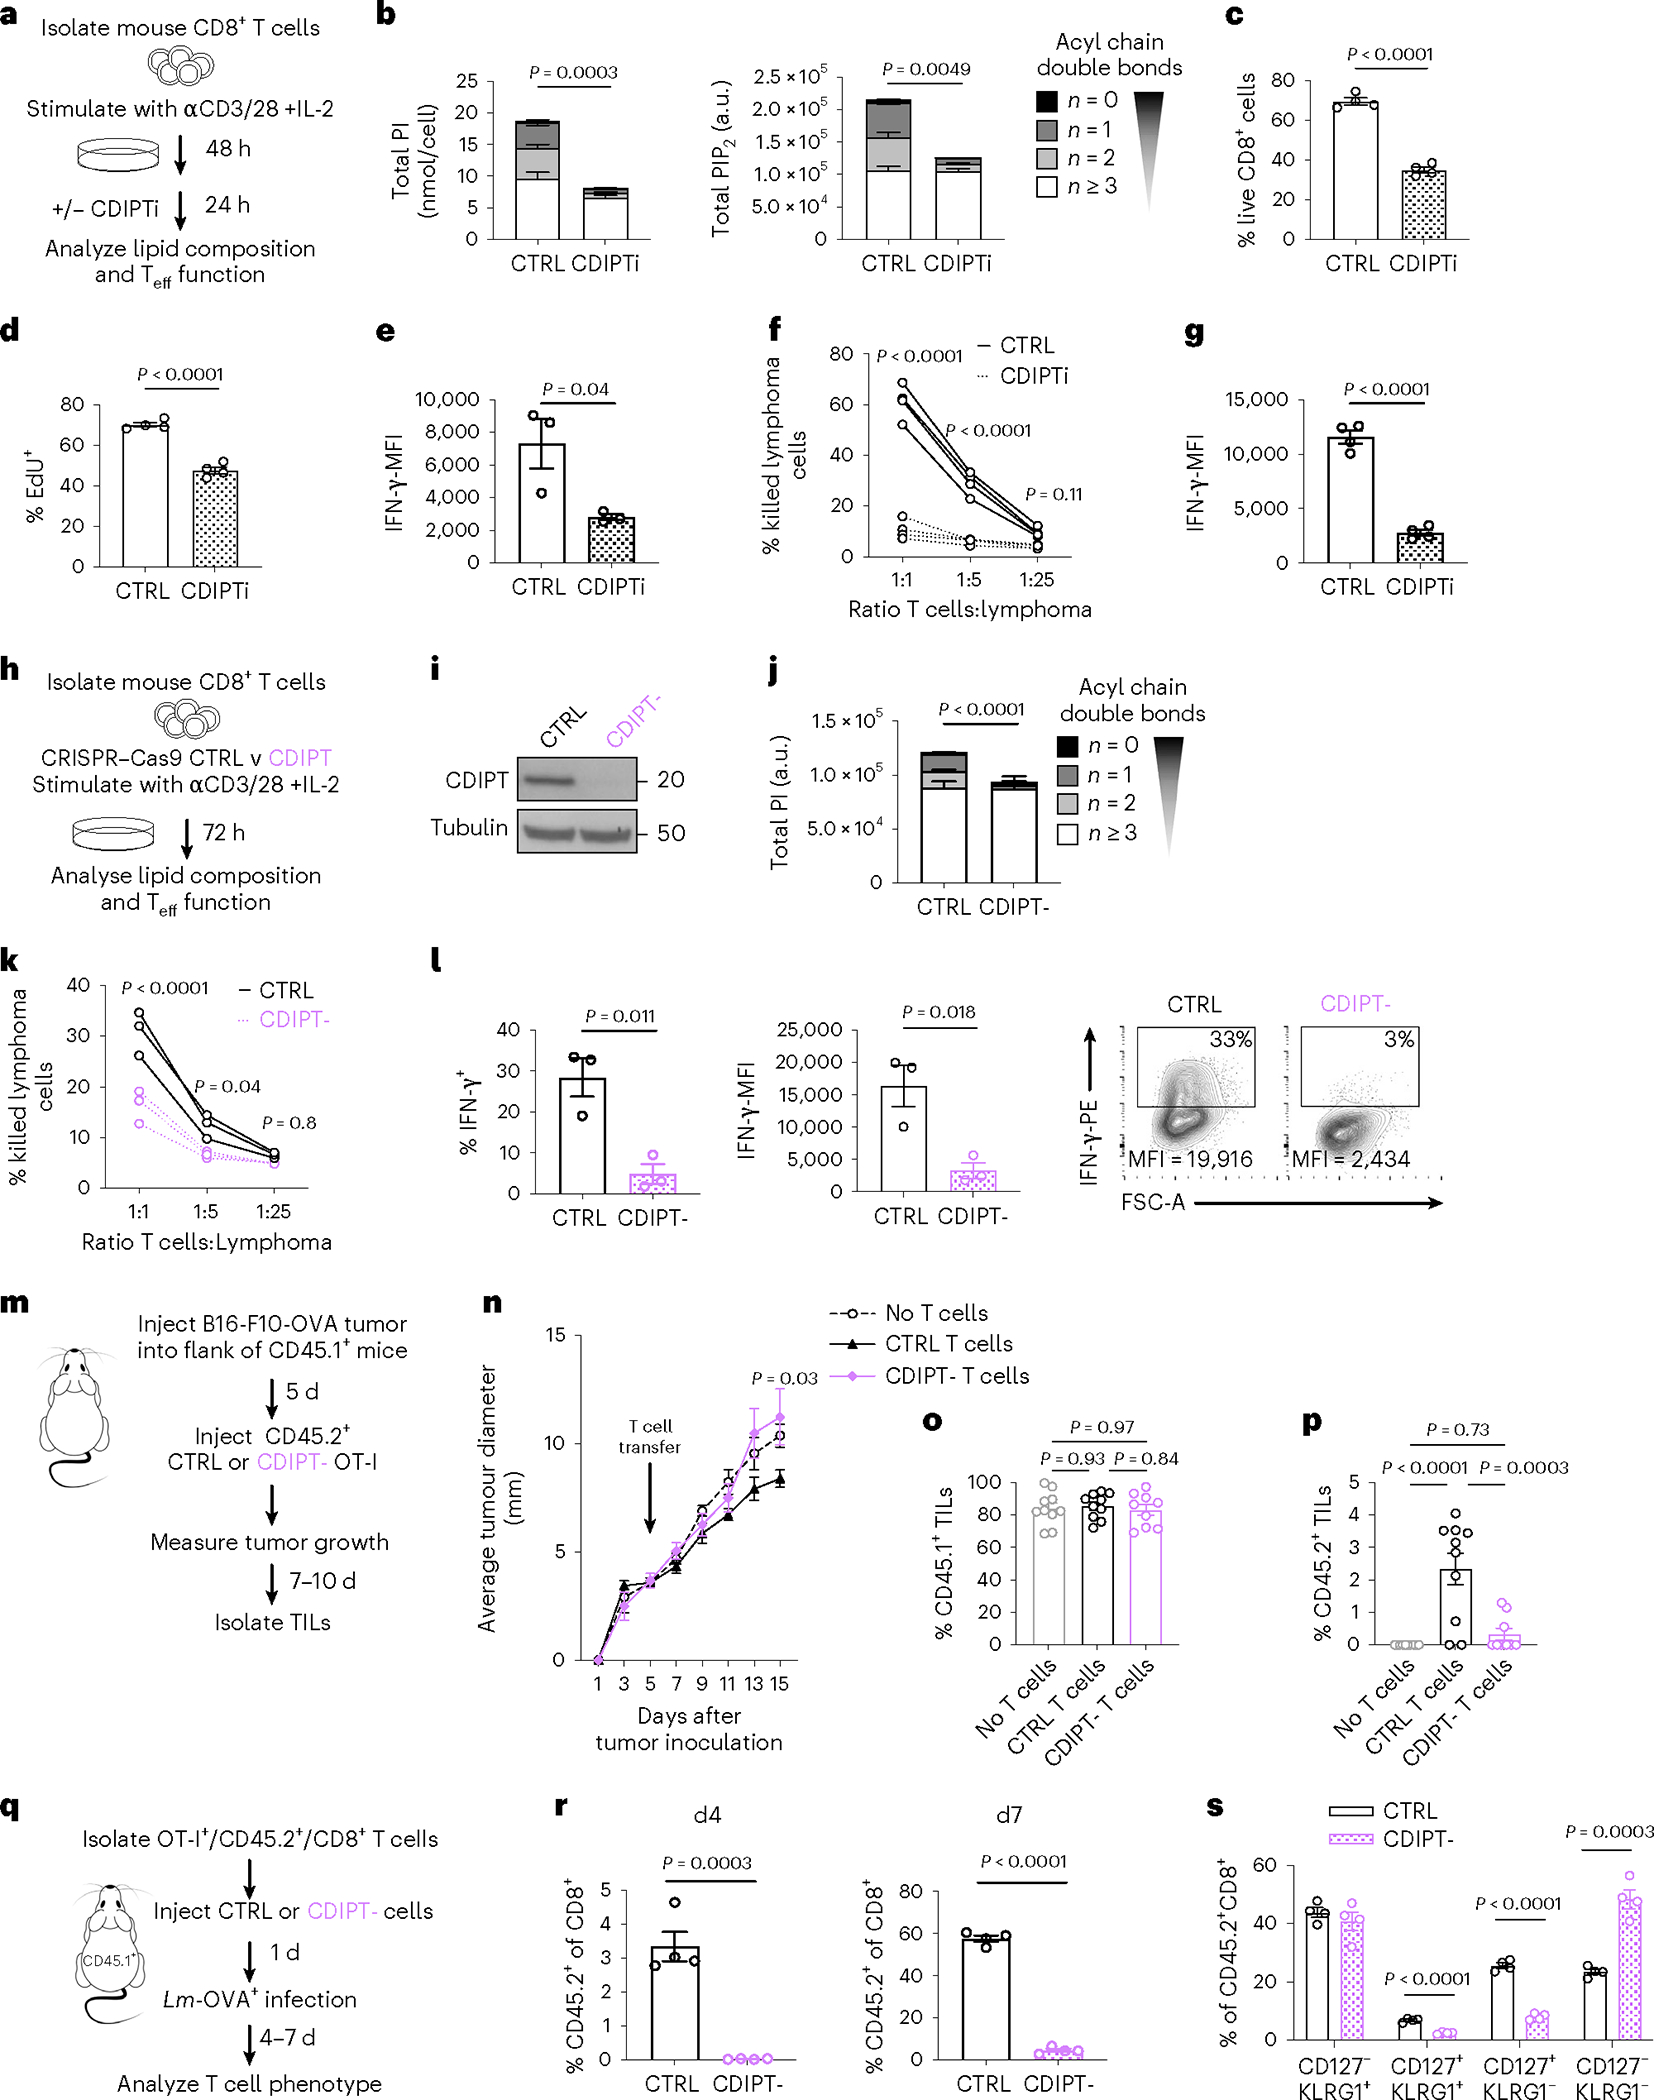
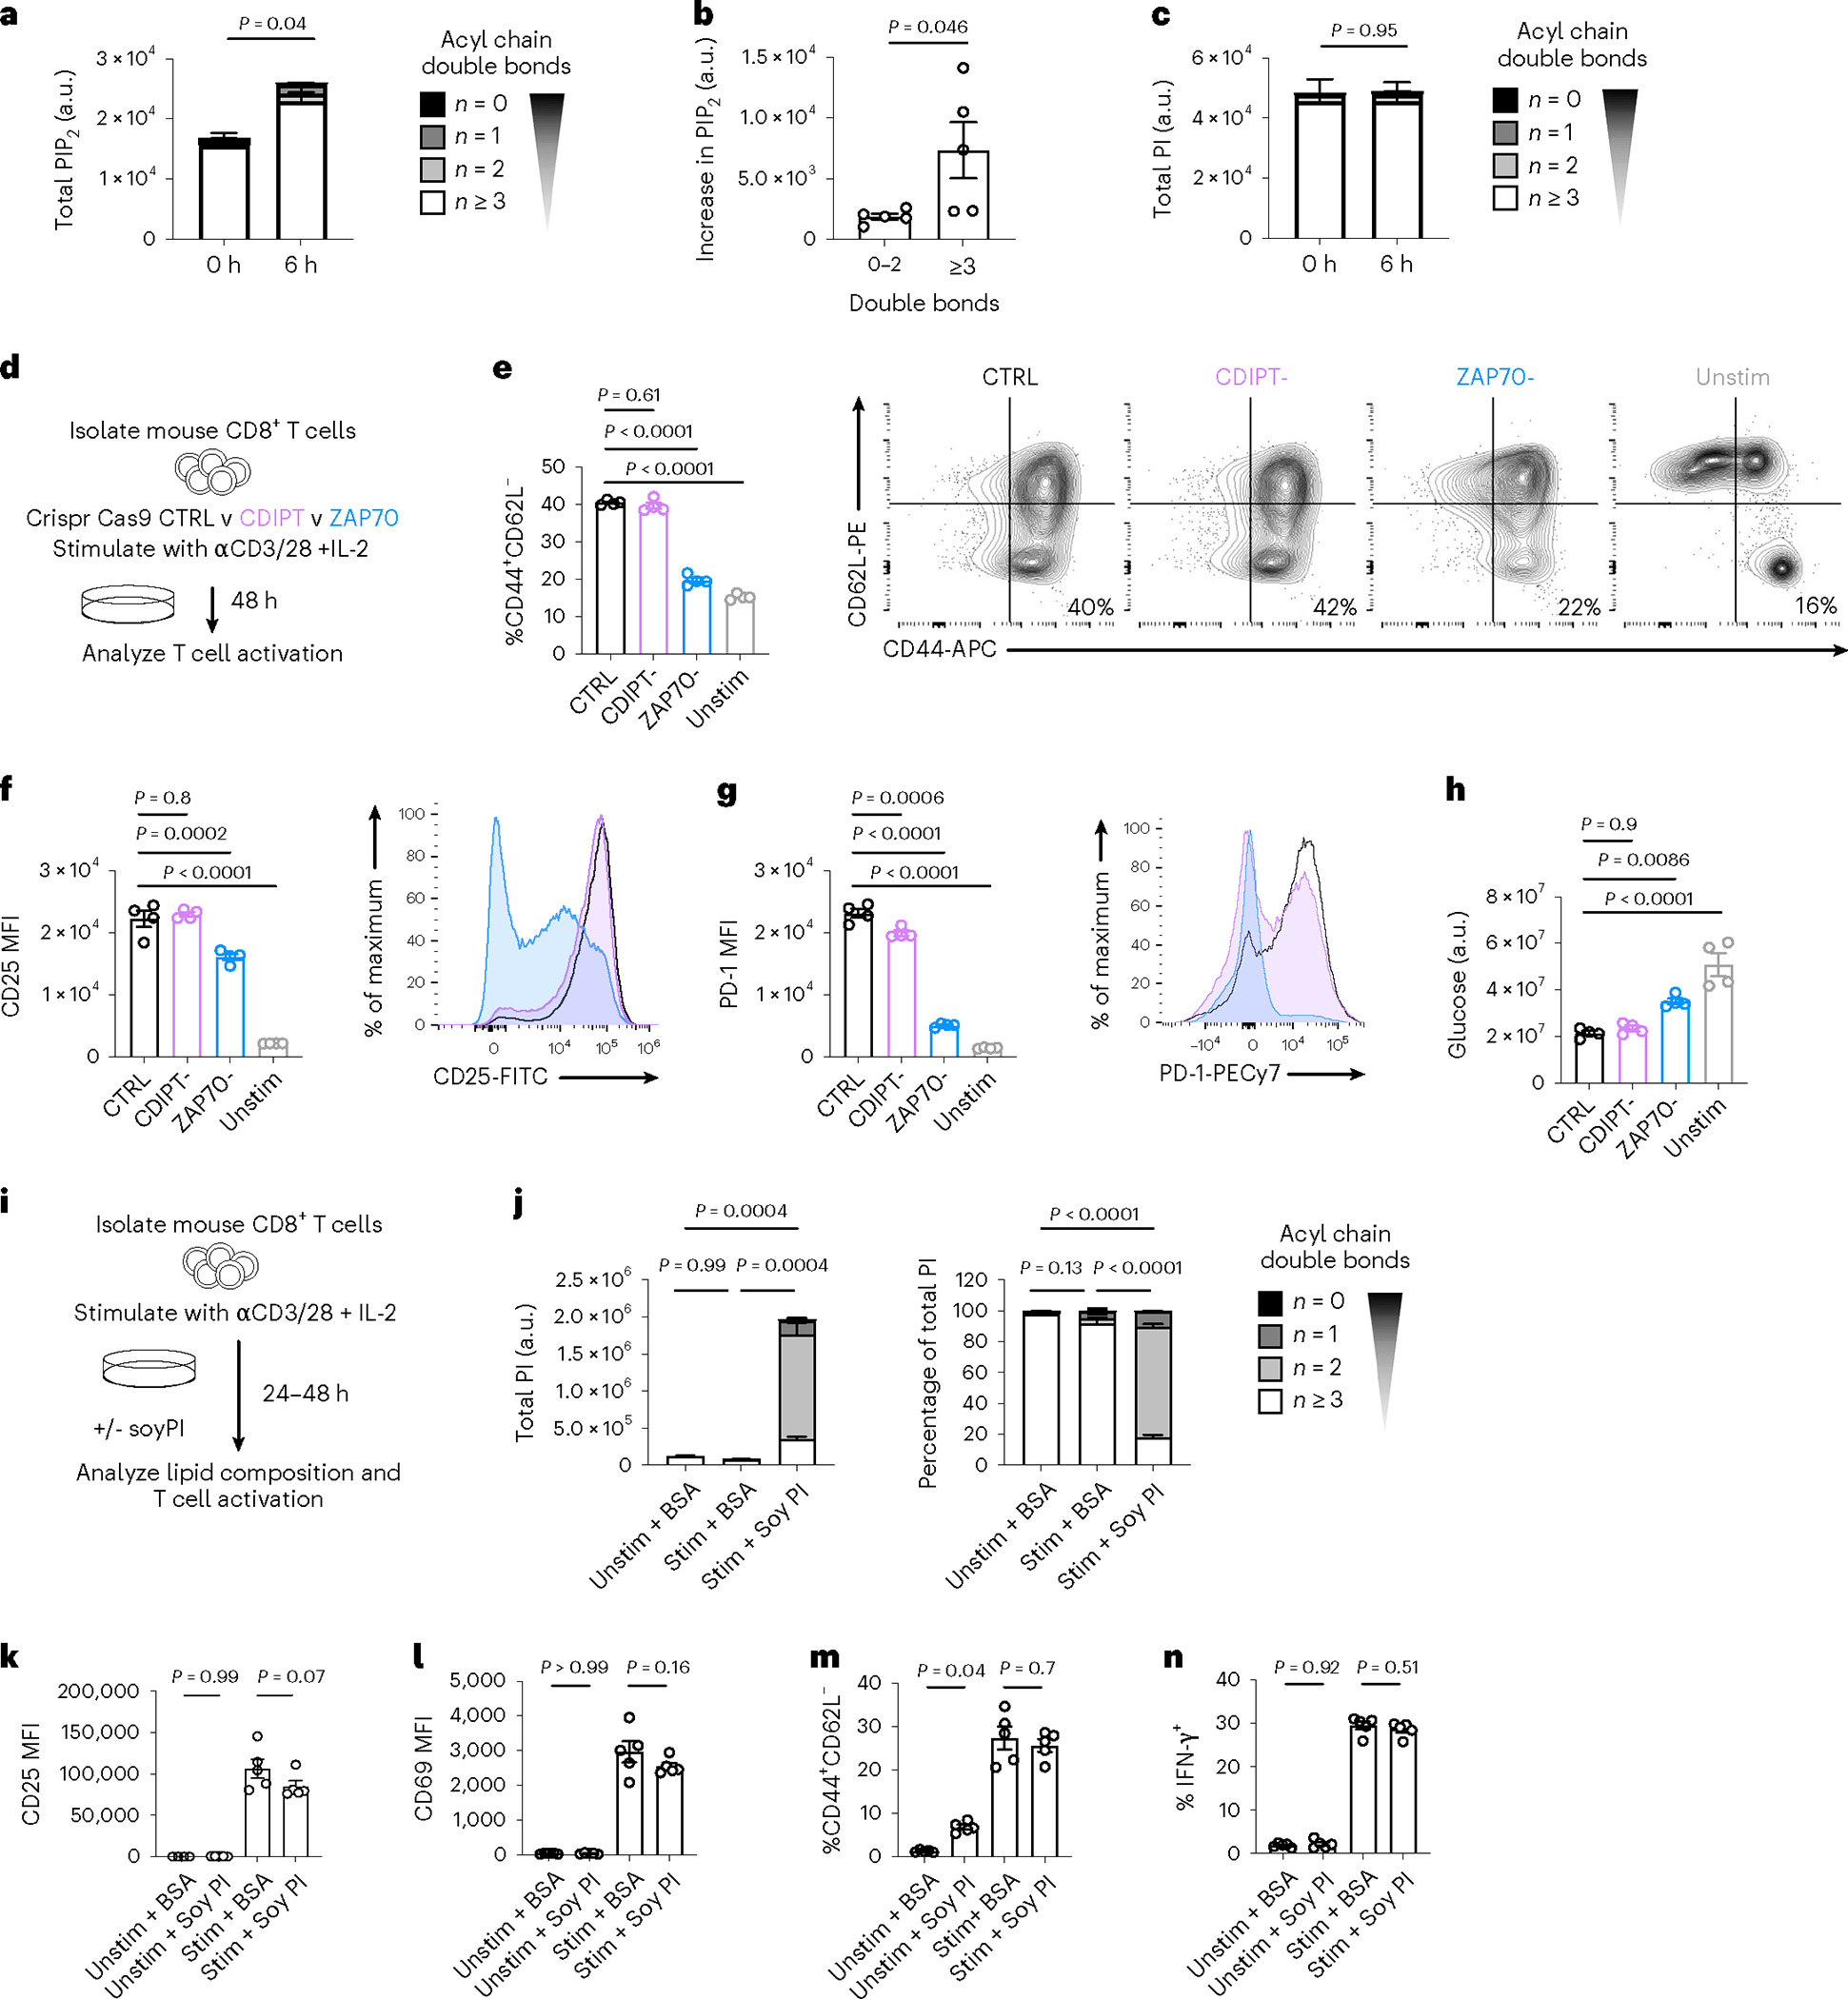
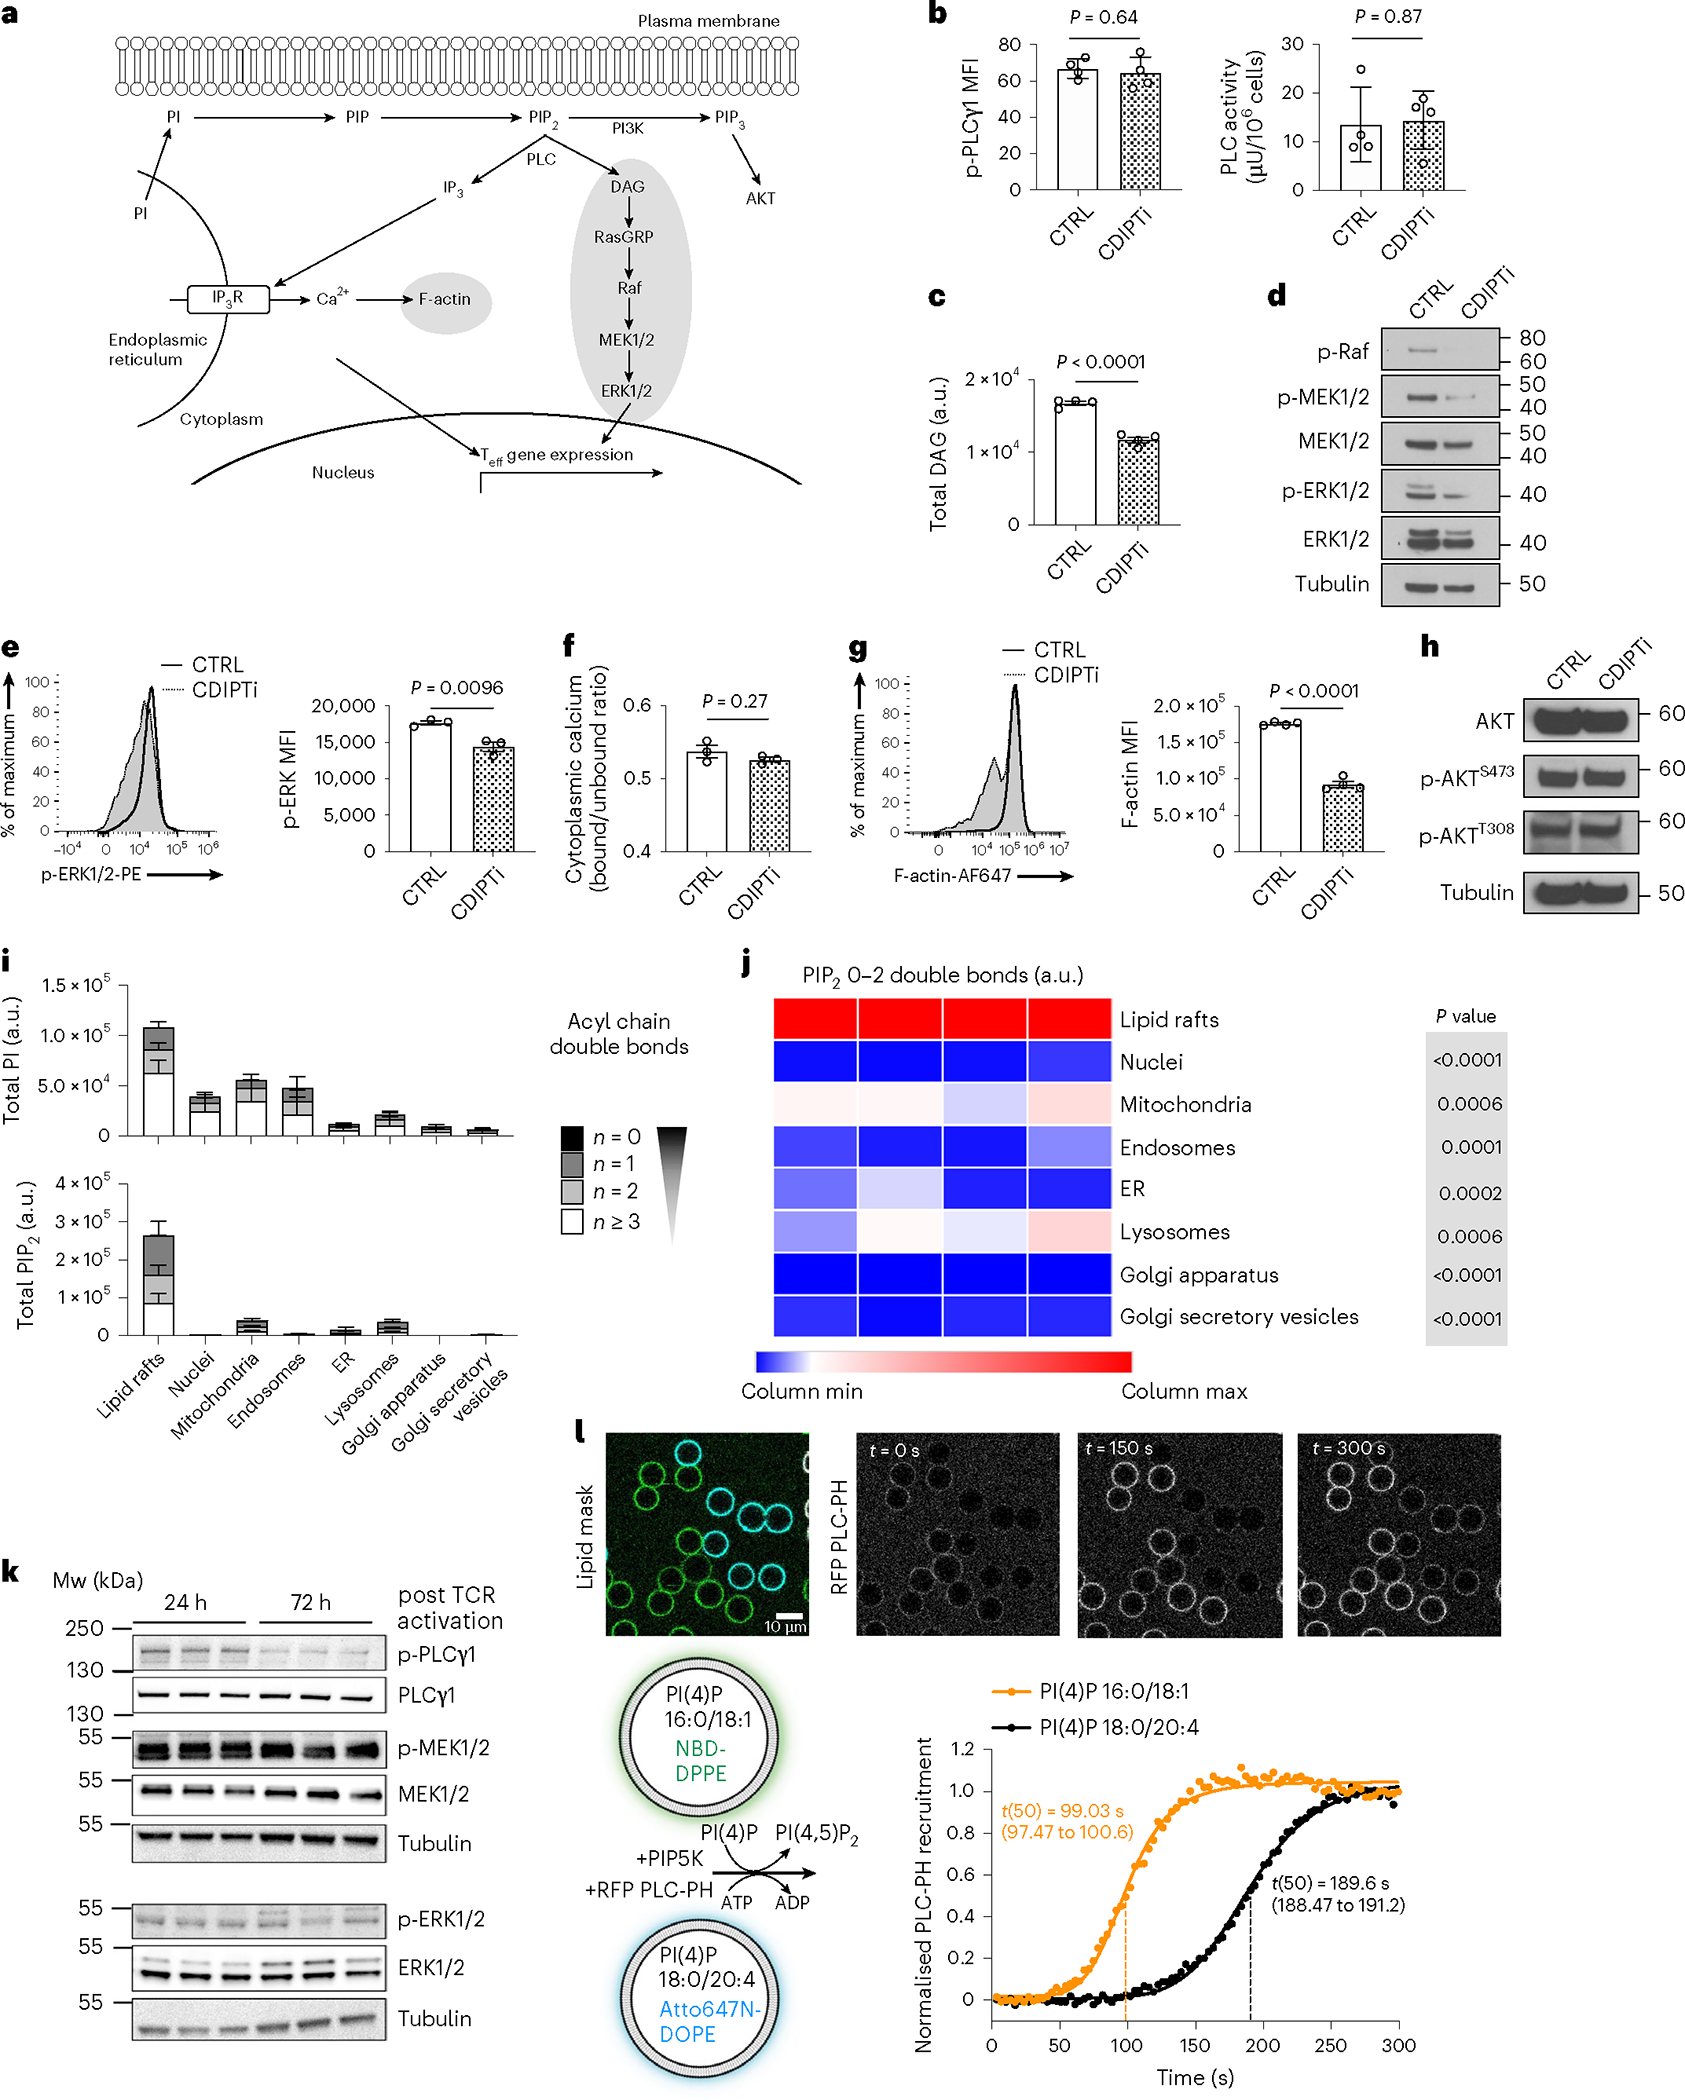
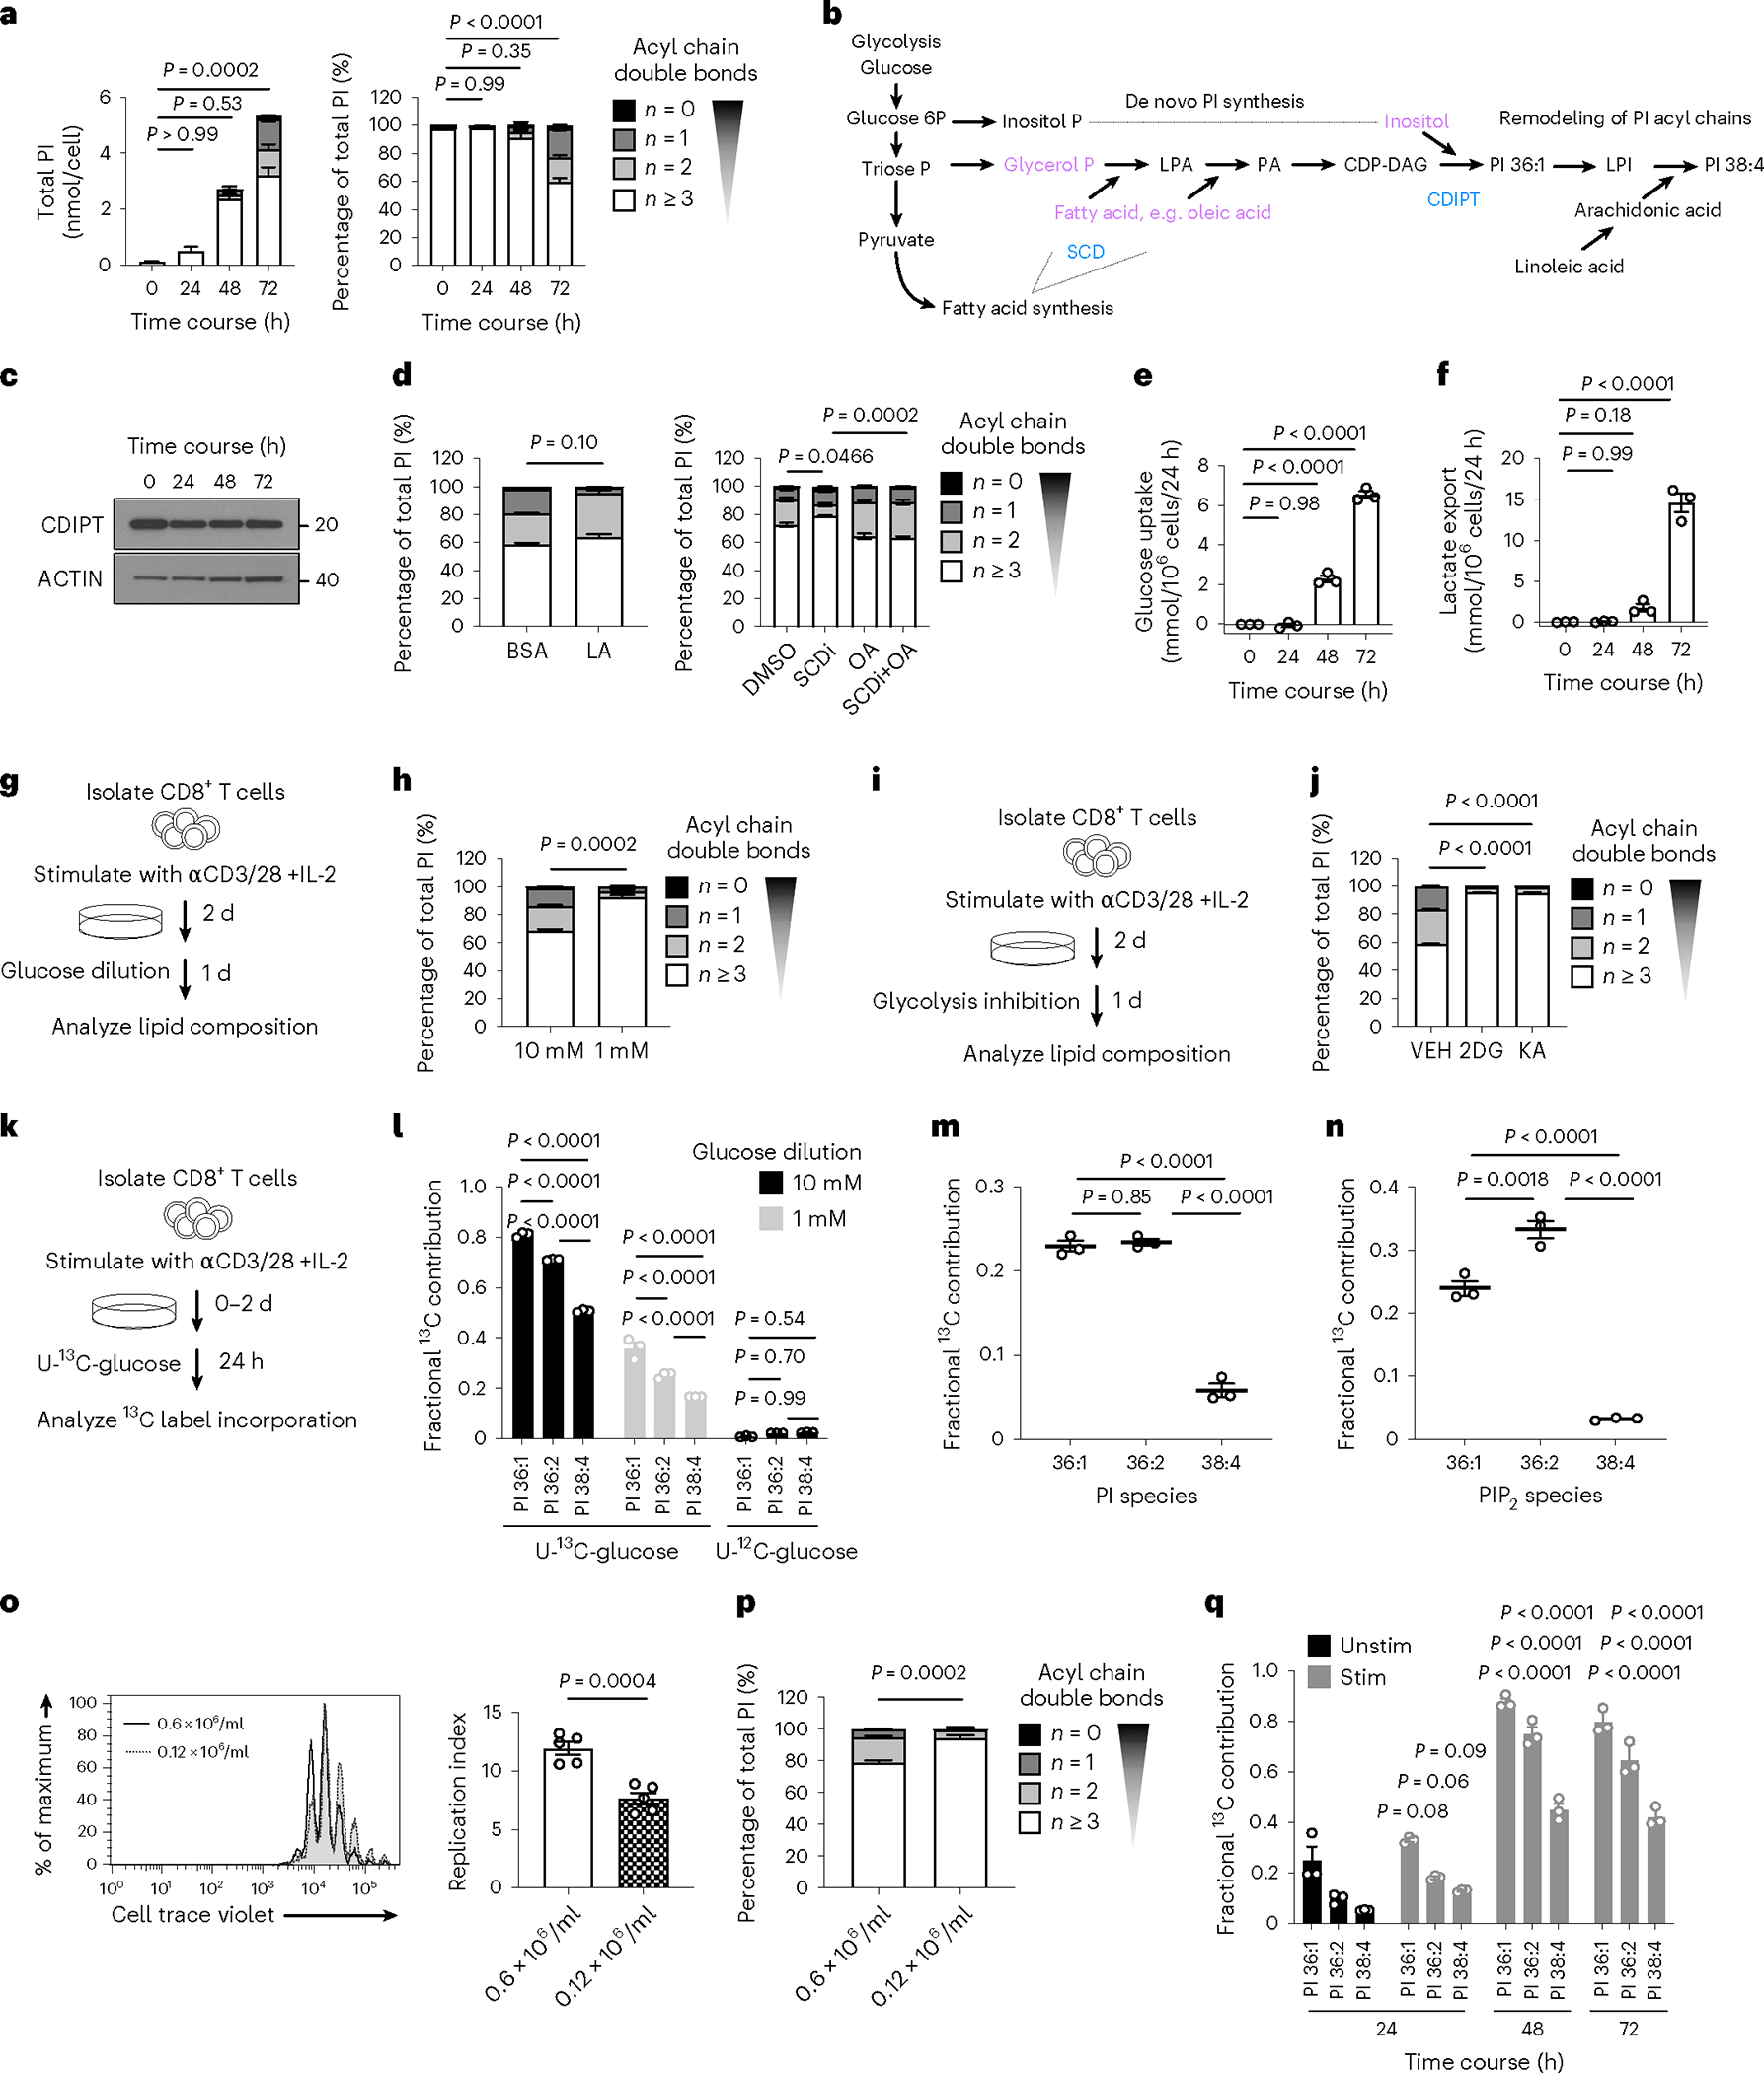
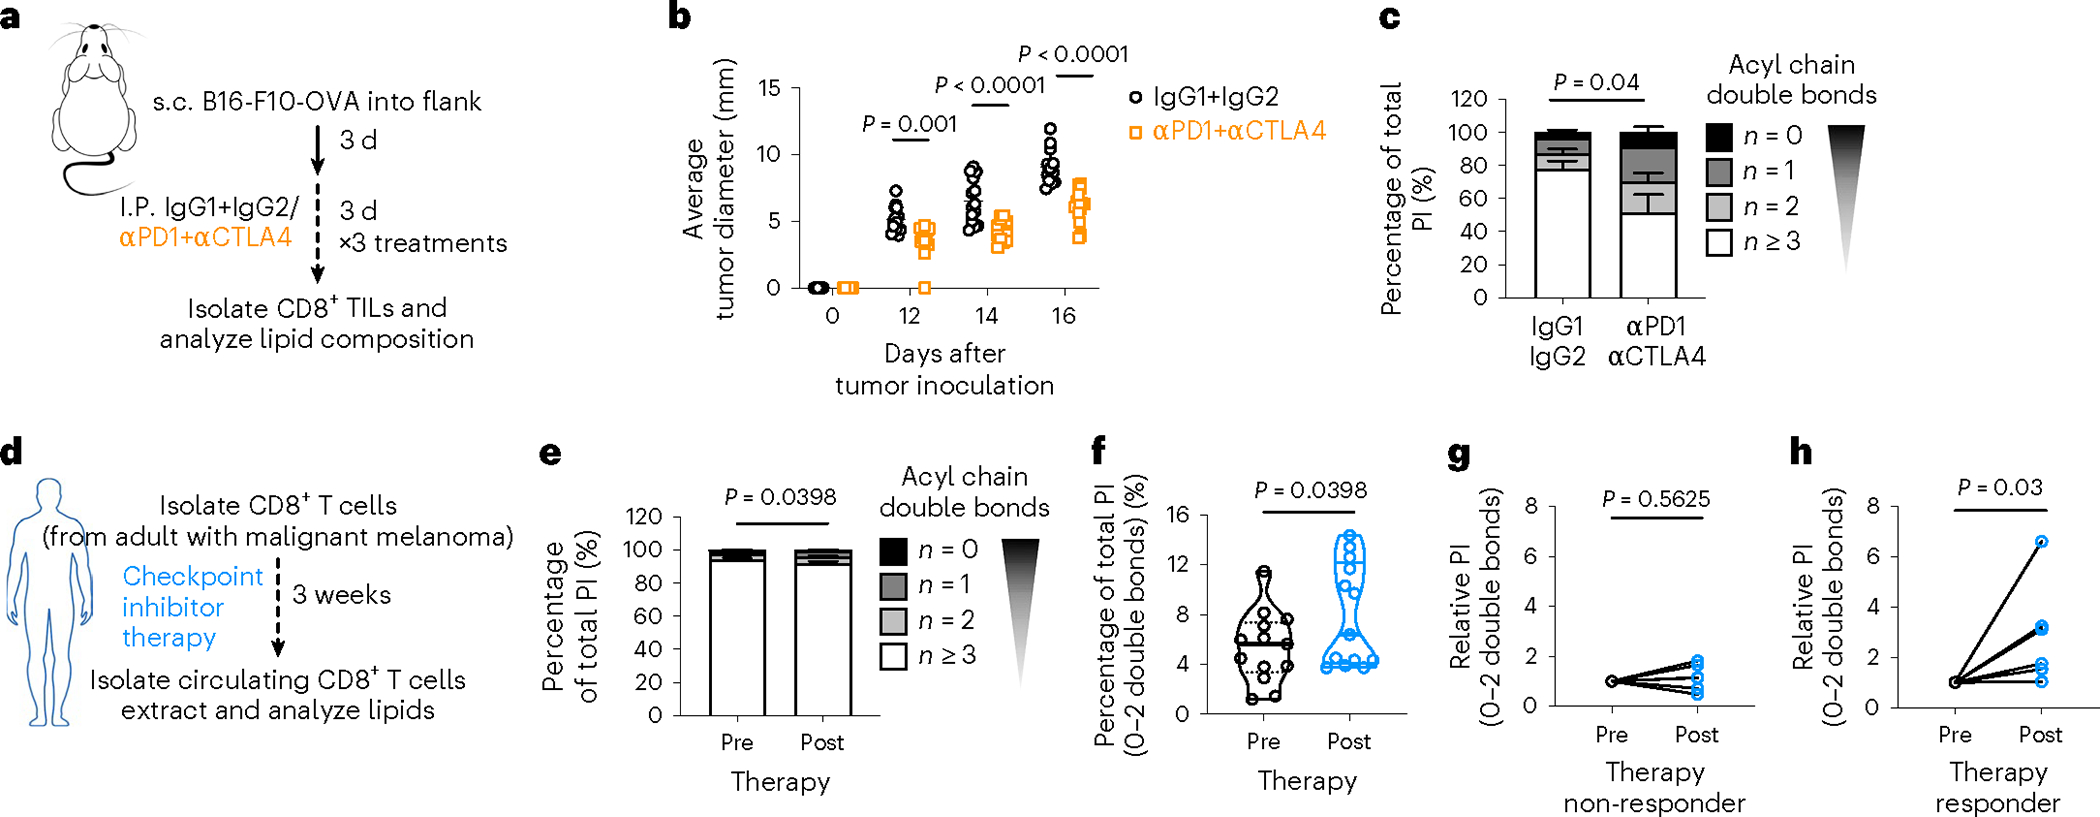
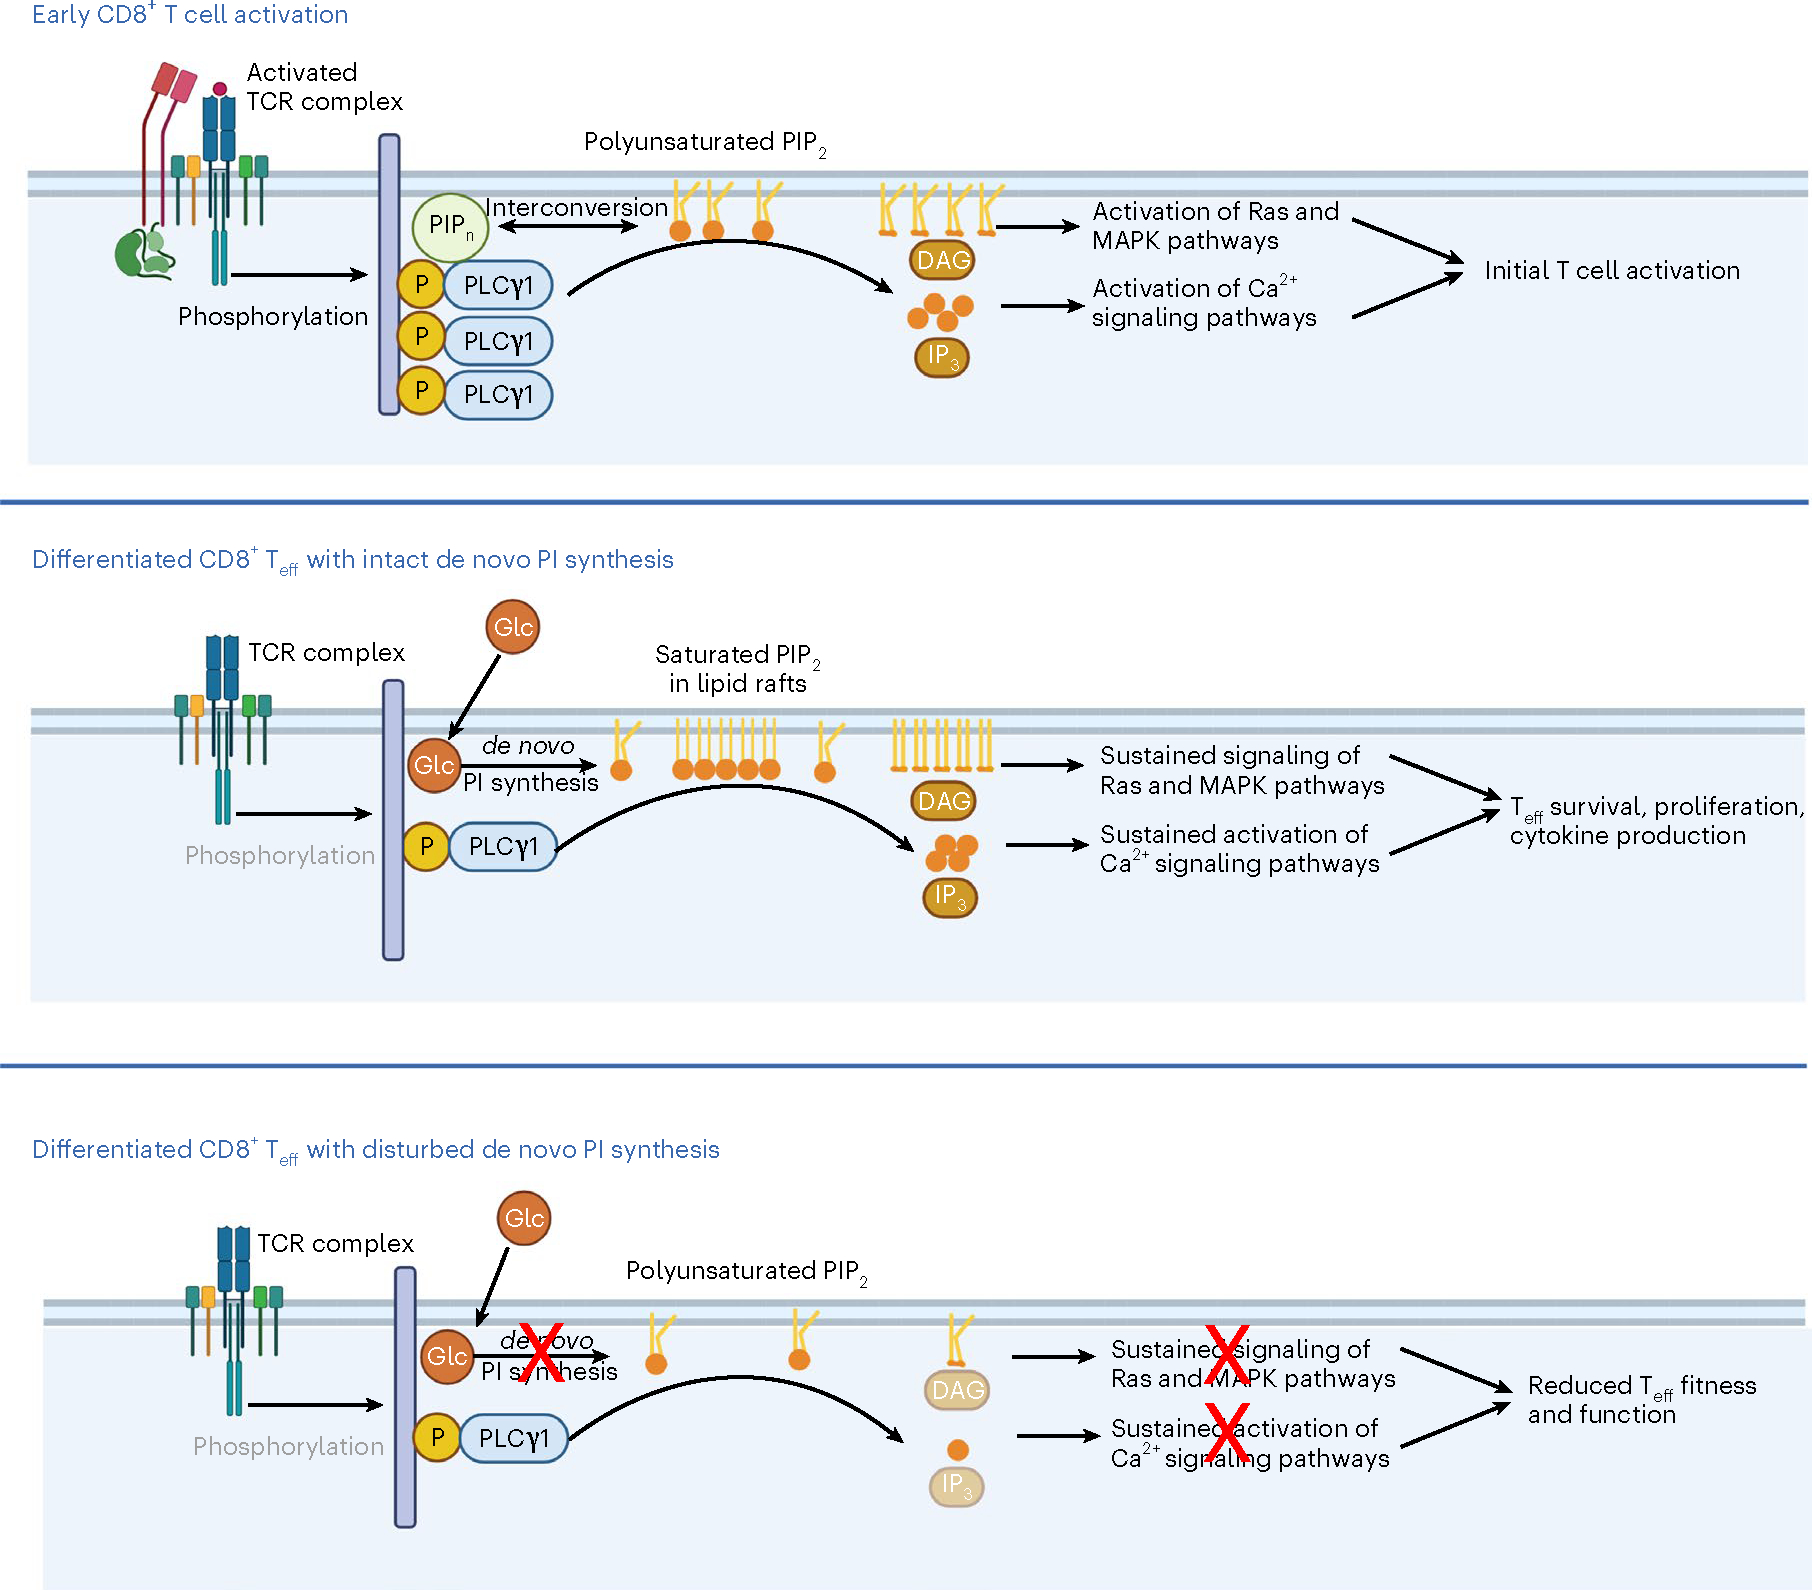
How lipidome changes support CD8+ effector T (Teff) cell differentiation is not well understood. Here we show that, although naive T cells are rich in polyunsaturated phosphoinositides (PIPn with 3-4 double bonds), Teff cells have unique PIPn marked by saturated fatty acyl chains (0-2 double bonds). PIPn are precursors for second messengers. Polyunsaturated phosphatidylinositol bisphosphate (PIP2) exclusively supported signaling immediately upon T cell antigen receptor activation. In late Teff cells, activity of phospholipase C-γ1, the enzyme that cleaves PIP2 into downstream mediators, waned, and saturated PIPn became essential for sustained signaling. Saturated PIP was more rapidly converted to PIP2 with subsequent recruitment of phospholipase C-γ1, and loss of saturated PIPn impaired Teff cell fitness and function, even in cells with abundant polyunsaturated PIPn. Glucose was the substrate for de novo PIPn synthesis, and was rapidly utilized for saturated PIP2 generation. Thus, separate PIPn pools with distinct acyl chain compositions and metabolic dependencies drive important signaling events to initiate and then sustain effector function during CD8+ T cell differentiation.


Conflict of interest statement

Competing interests

E.L.P. is an SAB member of ImmunoMet Therapeutics and E.L.P. and E.J.P are Founders and Scientific Advisors to Rheos Medicines. The other authors declare no competing interests.

Figures

Extended Data Fig. 1 |
Extended Data Fig. 1 |. Human CD8+ TE accumulate PIPn with saturated acyl chains.
a, Pie chart showing the number of lipid species measured by LC-QqQ-MS/MS in each of the 18 lipid subclasses. b-c, WT CD8+ T cells were stimulated (Stim) with anti-CD3, anti-CD28 and IL-2 or cultured with IL-7 (unstim) for 3 days. b, Median lipid content per million cells before (raw) and after (normalized) quantile normalization is shown. n = 9 biologically independent samples across 3 independent experiments; unpaired two-tailed t-test. c, Relative total PI level calculated from quantile normalized lipid peak areas. n = 9 biologically independent samples across 3 independent experiments; unpaired two-tailed t-test. d, Experimental schematic. e-f, Volcano plot shows the log2 fold change (e) or total PI (f) between Unstim and Stim conditions using quantile normalized lipid peak areas. n = 3 biologically independent samples; one-way ANOVA or two-way ANOVA corrected for multiple comparisons (Sidak test). g, Relative intensity of saturated PI normalized to Unstim (log2 fold change). n = 3 biologically independent samples; one sample t-test. h, PI saturation percentage. n = 3 biologically independent samples; unpaired two-tailed t-test comparing saturated PI. I, Total PI. n = 3 biologically independent samples; unpaired two-tailed t-test. j, Total PI concentration (nmol/cell). n = 3 biologically independent samples; unpaired two-tailed t-test. k, Saturation of acyl chains in human TE is expressed as a relative proportion of the total PIP2 (left panel) and as a percentage of total PIP2 (right panel). n = 5 biologically independent samples; unpaired two-tailed t-test comparing the total or percentage saturated PIP2. Total polyunsaturated PIP2 was not significantly different. l, Saturation of acyl chains in human TE is expressed as a relative proportion of the total PIP3 (left panel) and as a percentage of PIP3 (right panel). n = 5 biologically independent samples; unpaired two-tailed t-test comparing the total or percentage saturated PIP3. Total polyunsaturated PIP3 was also significantly different (p < 0.001). m, Experimental schematic. n, Percentage CD8+ cells, activation marker HLA-DR+ cells, and proliferation marker Ki67+ cells are shown. MFI of HLA-DR and Ki67 are also shown. o, Relative intensity of saturated PI normalized to HD (log2 fold change). n = 3 HD and n = 3 EBV biologically independent samples; one sample t-test. p, PI saturation. n = 3 HD and n = 3 EBV biologically independent samples; unpaired two-tailed t-test comparing the summed percentage of saturated PI. q, Total PI concentration (nmol/cell). n = 3 HD and n = 3 EBV biologically independent samples; unpaired two-tailed t-test. Error bars show the standard error of the mean. a.u., arbitrary units.
Extended Data Fig. 2 |
Extended Data Fig. 2 |. CDIPT inhibition or deletion impairs TE fitness and function.
a, Simplified overview of PI de novo synthesis and remodeling. b, WT CD8+ T cells were activated and treated as in Fig. 2a. Total lysophosphatidlyinositol (LPI) content is shown. n = 4 biologically independent samples; unpaired two-tailed t-test. c, Gating strategy for flow cytometry analysis. d, Replication Index based on cell trace violet dilution was calculated using FlowJo software. n = 4 biologically independent samples; unpaired two-tailed t-test. e, PI species present in PI derived from Soy expressed by degree of acyl chain saturation. f-g, Cells were prepared as in (b), with the addition of BSA (10 mg/ml) control or BSA conjugated to Soy-derived PI (SoyPI, 100 μM) for the final day. f, Saturation of acyl chains expressed as a percentage of total PI. n = 3 biologically independent samples, one-way ANOVA corrected for multiple comparisons (Tukey test) comparing saturated PI. g, Percentage IFN-γ+ cells are shown, gated on Live/Dead-aqua and CD8-Brilliant Violet 421+. n = 3 biologically independent samples; one-way ANOVA corrected for multiple comparisons (Tukey test). h-I, Cells were prepared as in (b), with the addition of BSA (10 mg/ml) control or BSA conjugated to PI 38:4 (100 μM) for the final day. h, Saturation of acyl chains expressed as a percentage of total PI. n = 3 biologically independent samples; unpaired two-tailed t-test comparing saturated PI. I, Percentage IFN-γ+ cells are shown, gated on Live/Dead-near-IR and CD8-Brilliant Violet 421+. n = 5 biologically independent samples representative of three experiments; one-way ANOVA corrected for multiple comparisons (Tukey test). j, WT CD8+ T cells were activated as in Fig. 2a and the CDIPT inhibitor inostamycin was added at the indicated concentrations for 24 h starting either after either two, four or six days of activation. Upper panel: percentage of viable CD8+ cells. Cells were gated on FSC and SSC and single cells. Middle panel: percentage of EdU+ cells. Cells were gated on Live/Dead-aqua CD8-APC-Cy7+. Lower panel: percentage of IFN-γ+ cells. Cells were gated on Live/Dead-aqua CD8-APC-Cy7+. For each time point, the values were normalized to the values of the control samples (0 μg/ml CDIPTi). n = 4 biologically independent samples representative of two independent experiments. k, WT CD8+ T cells were activated and treated as in Fig. 2a. After 24 h of CDIPTi treatment, the cells were cultured in media without CDIPTi for the indicated time intervals. Upper panel: percentage of viable CD8+ cells. Cells were gated on FSC and SSC and single cells. Middle panel: percentage of EdU+ cells. Cells were gated on Live/Dead-aqua CD8-APC-Cy7+. Lower panel: percentage of IFN-γ+ cells. Cells were gated on Live/Dead-aqua CD8-APC-Cy7+. For each time point, the values were normalized to the values of the control samples at the respective time point (0 μg/ml CDIPTi). n = 3 biologically independent samples representative of two independent experiments. Error bars show s.e.m.
Extended Data Fig. 3 |
Extended Data Fig. 3 |. CRISPR-Cas9 deletion efficiency for CDIPT and ZAP70.
a, The efficiency of CRISPR-Cas9 for CDIPT and ZAP70 was verified by measuring protein expression.
Extended Data Fig. 4 |
Extended Data Fig. 4 |. Inhibition of CDIPT changes membrane lipid order and impairs lipid raft formation.
a, Phospholipase C activity in Jurkat T cells cultured in the presence or absence of 0.5 μg/ml CDIPT inhibitor and activated for 30 min with 50 ng/ml PMA and 500 ng/ml ionomycin. n = 5 biologically independent samples representative of 2 independent experiments; unpaired two-tailed t-test. b, WT CD8+ T cells were activated and cellular compartments were enriched as in Fig. 4i. Saturation of acyl chains expressed as a percentage of total PIP2 across organelles. n = 4 biologically independent samples. c, WT CD8+ T cells were isolated and activated or cultured in IL-7 as in Fig. 1a. Volcano plot shows the log2 fold change between Unstim and Stim using quantile normalized lipid peak areas. n = 5 biologically independent samples across 2 independent experiments; one-way ANOVA. Lipids from the following subclasses are highlighted: sphingomyelin (SM) in blue, phosphatidylinositol (PI) in orange, phosphatidylserine (PS) in purple and ganglioside GM1 in green. d, Cholera toxin subunit B measurement on primary CD8+ TE activated and treated as in Fig. 2a. n = 3 biologically independent samples representative of 3 independent experiments; unpaired two-tailed t-test. e, Cholera toxin subunit b measurement on Jurkat T cells treated as in (a). n = 5 biologically independent samples representative of 2 independent experiments; unpaired two-tailed t-test. f, WT CD8+ T cells were activated and treated as in Fig. 2a. Membrane lipid order was assessed by a di-4-ANEPPDHQ staining. Percentage of cells with high lipid order (di-4-ANEPPDHQ emission at 630 nm) and low lipid order (di-4-ANEPPDHQ emission at 570 nm). n = 3 biologically independent samples representative of 3 independent experiments; unpaired two-tailed t-test. g, Percentage of Jurkat T cells with low lipid order as determined by di-4-ANEPPDHQ flow cytometry staining after treatment as in (a). n = 3 biologically independent samples representative of two independent experiments; unpaired two-tailed t-test. (h) Generalized polarization (GP) index as a normalized intensity ratio of the two spectral emissions for CD8+ TE analyzed as in (e). n = 3 biologically independent samples representative of 3 independent experiments; unpaired two-tailed t-test. (I) WT CD8+ T cells were activated and treated as in Fig. 2a except that the CDIPT inhibitor was used at the indicated concentrations. Cells were gated on Live/Dead-aqua CD8-APC-Cy7+. Left panel: Cholera toxin subunit B binding. Middle panel: mean fluorescence intensity of phosphorylated MEK1. Right panel: Percentage of IFN-γ+ cells. n = 4 biologically independent samples representative of two independent experiments; one-way ANOVA with Dunnett’s multiple comparisons test comparing all groups to ‘0 μg/ml’. Error bars show the standard error of the mean.
Extended Data Fig. 5 |
Extended Data Fig. 5 |. TE PIPn synthesis depends on glycolytic metabolism.
a, WT CD8+ T cells were isolated from spleens and lymph nodes of C57BL/6 mice then stimulated with plate-bound anti-CD3 (5 μg/ml), soluble anti-CD28 (0.5 μg/ml) and IL-2 (100 U/ml) for 2 days. Samples for RNA sequencing were harvested every 24 h. Heatmap depicting the gene expression levels of Lclat1 and Mboat7 in n = 3 biologically independent samples. b, WT CD8+ T cells were isolated and activated as in (a), followed by a treatment for 24 h with the Stearoyl-CoA-desaturase inhibitor A939572 (SCDi, 100 nM) in the presence of IL-2. Left panel: Replication Index based on Cell Trace Violet dilution calculated using FlowJo software. Middle and right panel: intracellular expression of IFN-γ. Cells were gated on Live/Dead-IR, CD8-APC+. n = 3 biologically independent samples; unpaired two-tailed t-test. c, d WT CD8+ T cells were isolated and activated as in (a), followed by culture in IL-2 for 24 h. On d3, cells were either switched to IL-15 (100 U/ml, TM) or maintained in IL-2 until d6. TM were re-activated on d6 by stimulation with plate-bound anti-CD3 (5 μg/ml), soluble anti-CD28 (0.5 μg/ml) and IL-2 (100 U/ml) for 2 days to generate secondary TE. c, Relative amount of PI 36:2 measured every 24 h. n = 3 biologically independent samples; one-way ANOVA corrected for multiple comparisons (Dunnett test) compared all groups to 0 h timepoint. d, Saturation of acyl chains expressed as a proportion of total PIP2 (left panel) and as a percentage of PIP2 (right panel). Statistical analysis of the saturated PI on n = 5 independent biological samples; one-way ANOVA with Dunnett’s multiple comparisons’s test compared all groups to ‘Tn d3’. e, WT CD8+ T cells were differentiated into TM as in (c), with the addition of 100% U-13C-glucose 24 h before lipid analysis at each timepoint. Unstimulated cells were cultured in IL-7 with 100% U-13C-glucose. Fractional contribution of 13C-glucose-derived carbon to PI species was calculated. n = 3 biologically independent samples, two-way ANOVA with correction for multiple comparisons (Sidak’s test) comparing PI species in each group with the relevant 24 h unstimulated PI. Error bars show the standard error of the mean.
Extended Data Fig. 6 |
Extended Data Fig. 6 |. Elevated numbers and cytokine production by CD8+ T cells after immunotherapy.
a–d, Sex-matched C57BL/6 mice were injected in the right flank with 1 × 10⁶ B16-F10-OVA cells. After 3 days, mice were given i.p. injections of anti-PD1 and anti-CTLA4 (aPD1 + aCTLA4) or matching isotype controls (IgG1 + IgG2) every 3 days for 3 rounds in total. Tumor growth was measured up to day 16 post-tumor injection and CD8+ T cells were isolated on day 12 post-tumor injection to measure T cell function and lipid composition. a, CD8+ tumor infiltrating lymphocytes (TILs) on day 12 post-tumor injection normalized to tumor weight. n = 7 IgG1 + IgG2 and n = 8 aPD1 + aCTLA4 biologically independent samples; unpaired two-tailed t-test. b–c, TILs were isolated day 12 post-tumor injection and restimulated with PMA/ionomycin plus brefeldin A for 5 h in vitro. n = 7 biologically independent samples per group, unpaired two-tailed t-test. b, Representative contour plots of IFN-γ expression (left panel), percentage IFN-γ+ (middle panel) and IFN-γ expression (right panel) are shown. c, Representative contour plots of Granzyme B expression (left panel), percentage Granzyme B+ (middle panel) and Granzyme B expression (right panel) are shown. d, Relative total PI calculated from quantile normalized lipid peak areas. n = 7 IgG1 + IgG2 and n = 8 aPD1 + aCTLA4 biologically independent samples; unpaired two-tailed t-test. e-f, Sex-matched C57BL/6 mice were injected in the right flank with 1×10⁶ B16-F10-OVA cells. After 3 days, mice were given i.p. injections of anti-PD1 antibody or matching isotype control (IgG2) every 3 days for 3 rounds in total. Tumor growth was measured up to day 12 post-tumor injection and CD8+ T cells were isolated on day 12 post-tumor injection to measure T cell function and lipid composition. e, Average tumor diameter measured at the indicated time points. n = 5 biologically independent samples per group; two-way ANOVA corrected for multiple comparisons (Sidak test) comparing the two groups at each time point across the dataset. f, Lipids were analyzed from TILs on day 12 post-tumor injection. Saturation of acyl chains is expressed as a percentage of total PI. n = 5 biologically independent samples per group; unpaired two-tailed t-test comparing saturated PI. Error bars show the standard error of the mean.
Fig. 1 |
Fig. 1 |. CD8+ effector T cells synthesize PIPn with saturated acyl chains.
a, Experimental scheme. WT CD8+ T cells were stimulated (Stim) with anti-CD3, anti-CD28 and IL-2, or cultured with IL-7 (Unstim), for three d. b,c, Relative and absolute lipid intensities, respectively. n = 9 biologically independent samples from three independent experiments; ordinary one-way analysis of variance ANOVA (b) or two-way ANOVA (c) corrected for multiple comparisons (Sidak test). d, Relative intensity (log2 fold change) of saturated PI normalized to unstimulated n = 9 biologically independent samples from three independent experiments; one-sample t-test. e, Percentage PI saturation. n = 9 biologically independent samples from three independent experiments; unpaired two-tailed t-test comparing saturated PIs. f, Total PI concentration (nmol/cell). n = 9 biologically independent samples from three independent experiments; unpaired two-tailed t-test. g, PIPn synthesis and interconversion scheme. h, Total (left) and percentage (right) PIP2 saturation. n = 3 biologically independent samples, representative of two independent experiments; unpaired two-tailed t-test comparing the percentage of saturated PIP2; total polyunsaturated PIP2 = not significant. i, Total (left) and percentage (right) PIP3 saturation. n = 3 biologically independent samples, representative of two independent experiments; unpaired two-tailed t-test comparing the total or percentage saturated PIP3; total polyunsaturated PIP3 = P < 0.001. j, Experimental scheme. OT-I CD45.2+ CD8+ T cells (OT-I) were adoptively transferred into CD45.1+ C57BL/6 mice (1 × 10⁶ cells per mouse). One day later mice were infected intravenously (i.v.) with LmOVA. Four d later, WT CD45.2+/CD8+ T cells were isolated from infected (Lm) or uninfected (CTRL) mice. km Total PI concentration (nmol/cell), percentage PI saturation and relative intensity (log2 fold change) of saturated PI normalized to CTRL. n = 3 Ctrl and 12 Lm biologically independent samples; unpaired two-tailed t-test: total PI, percentage saturated PI; one-sample t-test: relative saturated PI. n, Experimental scheme. Sex-matched C57BL/6 mice were injected in the right flank with 1 × 10⁶ B16-F10-OVA cells. Tumor growth was measured up to an average of 7 mm in diameter, then CD8+ T cells were isolated from the spleen (SP) or tumor (TIL). oq, Total PI concentration (nmol/cell), percentage PI saturation and relative intensity (log2 fold change) of saturated PI normalized to SP. n = 5 biologically independent samples; unpaired two-tailed t-test: total PI, percentage saturated PI; one-sample t-test: relative saturated PI. Error bars show the s.e.m. a.u., arbitrary units.
Fig. 2 |
Fig. 2 |. De novo PIPn synthesis is essential for effector T cell fitness and cytotoxic function.
a, Experimental scheme. b, PI (left) or PIP2 (right) acyl chain saturation. n = 4 biologically independent samples, representative of three independent experiments for PI and one experiment for PIP2; unpaired two-tailed t-test comparing saturated PI or PIP2. c, Percentage of live, CD8+ T cells gated on Live/Dead-blue and CD8-FITC+. d, Incorporation of EdU into newly synthesized DNA. e, Intracellular expression of IFN-γ quantified by flow cytometry. Cells were gated on Live/Dead-IR, CD8-BV421+. In cd, n=4 and in e, n = 3 biologically independent samples, representative of three independent experiments; unpaired two-tailed t-test. f,g, OT-I were activated by SIINFEKL peptide with IL-2 for 2 d, treated with CTRL or CDIPTi (plus IL-2), then co-cultured at the indicated ratio with Cell Trace Violet (CTV)-stained EL4-OVA for eight h. f, Percentage killing was determined by CTV+, Live/Dead-IR+ cells. g, Cells co-cultured at a 1:1 ratio in the presence of brefeldin A. IFN-γ expression in Live/Dead-IR and CD8-APC+ cells. n = 4 biologically independent samples; two-way ANOVA corrected for multiple comparisons (Sidak test) (f) or unpaired two-tailed t-test (g). h, Experimental scheme. i, Protein expression of CDIPT. n = 3 biologically independent samples pooled into a single lane. j, PI saturation. n = 4 biologically independent samples; unpaired two-tailed t-test on saturated PI. k,l, EL4-OVA co-culture as in f and g. n = 3 biologically independent samples; two-way ANOVA corrected for multiple comparisons (Sidak test) (k) or unpaired two-tailed t-test (l). m, Experimental scheme. n, Tumor growth. n = 5 biologically independent samples; two-way ANOVA corrected for multiple comparisons (Dunnett test) comparing no T cell transfer, to transfer of CTRL or CDIPT T cells at each time point. o,p, Tumors were stained for congenic markers. Cells were gated on LD-Aqua, CD8-APC-Cy7+ and the percentage of CD45.1-PE-Cy7+ (o) or CD45.2-FITC+ (p) cells is shown. n = 10 represents no T cell transfer and CTRL and n = 9 represents CDIPT biologically independent samples; one-way ANOVA corrected for multiple comparisons (Tukey test). q, Experimental scheme. r,s, At four and seven d after infection, blood samples from infected mice were analyzed by flow cytometry for the expression of CD8, CD45.1, CD45.2, CD127 and KLRG1. n = 4 biologically independent samples per group; unpaired two-tailed t-test. All error bars show the s.e.m. MFI, mean fluorescence intensity.
Fig. 3 |
Fig. 3 |. Saturated PIPn are dispensable for early CD8+ T cell activation.
a–c, WT CD8+ T cells were stimulated with anti-CD3, anti-CD28 and IL-2 for 6 h. Intracellular lipids were analyzed by LC–QqQ–MS/MS or liquid chromatography quadrupole time-of-flight mass spectrometry (LC–QTOF–MS/MS). a, Total PIP2 at indicated time points after activation. n = 5 biologically independent samples; unpaired two-tailed t-test comparing total PIP2. b, Increase in PIP2 species with 0–2 versus ≥3 double bonds between zero h and six h after activation. n = 5 biologically independent samples; unpaired two-tailed t-test. c, Total PI at indicated time points after activation. n = 5 biologically independent samples; unpaired two-tailed t-test comparing total PI. dh, WT CD8+ T cells were isolated from C57BL/6 mice, then CRISPR–Cas9 technology was utilized to delete CDIPT (CDIPT) compared to control (CTRL) or ZAP70 deletion (ZAP70). Cells were stimulated with anti-CD3, anti-CD28 and IL-2 for 48 h, or IL-7 for 48 h (unstimulated control) and T cell activation was assessed. e, CD8+ T cells were gated on Live/Dead-aqua, then CD44+ and CD62L. f, Expression of CD25 was quantified after gating on Live/Dead-aquaCD8+. g, Expression of PD-1 was quantified after gating on Live/Dead-aqua CD8+. h, Polar metabolites were extracted from supernatants and glucose was measured by LC–MS. Depletion of extracellular glucose across conditions is shown, normalized to cell number. In eh, n = 4 biologically independent samples; one-way ANOVA corrected for multiple comparisons (Dunnett test). i, Experimental scheme. WT CD8+ T cells were stimulated with anti-CD3, anti-CD28 and IL-2 for 24 h (j), or 48 h (kn) in the presence or absence of Soy PI (100 μM). j, Total (left) and percentage (right) PI saturation. n = 3 biologically independent samples; one-way ANOVA corrected for multiple comparisons (Tukey test) comparing saturated PI. k,l, Expression of CD25 (k) and CD69 (l) in Live/Dead-IR, CD8-Brilliant Violet 421+ cells. n = 4 unstimulated and n = 5 stimulated biologically independent samples, representative of three independent experiments; one-way ANOVA corrected for multiple comparisons (Sidak test). m, CD8+ T cells were gated on Live/Dead-aqua, then CD44+ and CD62L. n, Intracellular expression of IFN-γ was quantified by flow cytometry. Cells were gated on Live/Dead-IR, CD8-Brilliant Violet 421+. In m and n, n = 5 biologically independent samples; one-way ANOVA corrected for multiple comparisons (Sidak test). Error bars show the s.e.m.
Fig. 4 |
Fig. 4 |. PIP2 saturation potentiates effector T cell signaling.
a, Schematic of PIP2 signaling in Teff cells. bg, WT CD8+ T cells were stimulated with anti-CD3, anti-CD28 and IL-2 for two d, treated with CTRL or CDIPTi (plus IL-2) for one d and then readouts of downstream signaling were measured. b, Expression of phosphorylated PLCγ1 (left) and activity of PLC enzyme (right). n = 4 biologically independent samples from two independent experiments; unpaired two-tailed t-test. c, Total DAG. n = 4 biologically independent samples representative of three independent experiments; unpaired two-tailed t-test. d, Protein expression of the Raf–MEK1/2–ERK1/2 signaling pathway. e, Relative intensity of p-ERK1/2-PE. n = 3 biologically independent samples; unpaired two-tailed t-test. f, Basal cytoplasmic calcium was calculated using the indo-AM dye bound/unbound ratio. n = 3 biologically independent samples; unpaired two-tailed t-test. g, Relative intensity of Phalloidin-AF647. n = 4 biologically independent samples; unpaired two-tailed t-test. h, Protein expression of the PI3K signaling pathway. i,j, WT CD8+ T cells were stimulated with anti-CD3, anti-CD28 and IL-2 for two d, then a further two d in IL-2. Organelle compartments were enriched and PIPn were extracted and analyzed by LC–QqQ–MS/MS or LC–QTOF–MS/MS. i, PI (upper) or PIP2 (lower) saturation across organelles. n = 4 biologically independent samples. j, Heat map of the relative amount of saturated PIP2 across organelles. n = 4 biologically independent samples; one-way ANOVA corrected for multiple comparisons (Dunnett test) comparing all groups with the lipid rafts. k, WT CD8+ T cells were stimulated with anti-CD3, anti-CD28 and IL-2 for 24 h or 72 h (the final 24 h of which were only with IL-2). Expression of total and phosphorylated PLCγ1, MEK1/2 and ERK1/2 with tubulin as the loading control. n = 4 biological replicates pooled into one lane. l, Lower left, experimental schematic. Membrane-coated beads were generated by mixing liposomes (harboring 16:0–18:1 PI(4)P or 18:0–20:4 PI(4) together with 0.1% Atto647N-DOPE or NBD-DPPE) and silica beads. Purified PLC-PH fused to RFP was added, followed by PIP5K1C immediately before acquisition. Upper microscopy images. Lower right, recruitment of PLC measured by the normalized MFIs of the RFP signal to either of the membranecoated bead populations, segmented using the NBD or Atto647N signal. n = 40–50 individual beads. Error bars show the s.e.m.
Fig. 5 |
Fig. 5 |. Effector T cell PIPn synthesis depends on glycolytic metabolism.
a, PI saturation (left) and percentage PI saturation (right) during WT CD8+ T cell stimulation. n = 3 biologically independent samples representative of 3 independent experiments; one-way ANOVA corrected for multiple comparisons (Dunnett test) comparing saturated PI with the 0 h time point. b, Schematic of de novo PI synthesis. c, Protein expression of CDIPT, as in a. n = 3 biologically independent samples pooled into one sample. d, WT CD8+ T cells were stimulated for 2 d, then for a further 24 h with BSA or BSA-conjugated LA (50 μM; left), or A939572 (SCDi; 100 nM), BSA-conjugated OA (100 μM), or a combination of both (right; plus IL-2), and PI saturation is shown. n = 4 or n = 3 biologically independent samples, respectively; unpaired two-tailed t-test or one-way ANOVA corrected for multiple comparisons (Tukey test) respectively on saturated PI. e,f, Glucose uptake and lactate export respectively, as in a. n = 3 biologically independent samples; one-way ANOVA corrected for multiple comparisons (Dunnett test) comparing each time point with the 0-h time point. g, Experimental schematic. h, Total PI saturation. n = 3 biologically independent samples; unpaired two-tailed t-test on saturated PI. i, Experimental schematic. j, Total PI saturation. n = 3 biologically independent samples; one-way ANOVA corrected for multiple comparisons (Dunnett test) comparing all groups with the vehicle control. k, Experimental schematic. l, Fractional 13C incorporation into major PI species. n = 3 biologically independent samples; two-way ANOVA corrected for multiple comparisons (Sidak test). m,n, As in k with 6-h labeling. Fractional 13C incorporation into major PI (m) or PIP2 (n) species from U-13C-glucose normalized to unlabeled glucose. n = 3 biologically independent samples; one-way ANOVA corrected for multiple comparisons (Tukey test). o,p, WT CD8+ T cells were stained with CTV, activated as in a, and plated at 0.6 × 10⁶ cells/ml or 0.12 × 10⁶ cells/ml. o, Left, CTV dilution after 72 h of activation. Right, replication index. n = 5 biologically independent samples; unpaired two-tailed t-test. p, Total PI saturation. n = 5 biologically independent samples; unpaired two-tailed t-test comparing saturated PI. q, Fractional contribution of 13C-glucose-derived carbon to PI major species as in a, with the addition of 100% U-13C-glucose 24 h before lipid analysis at each time point. n = 3 biologically independent samples; two-way ANOVA corrected for multiple comparisons (Dunnett test) comparing respective PIs within each group with unstimulated cells. Error bars show the s.e.m.
Fig. 6 |
Fig. 6 |. Immunotherapy-boosted tumor-infiltrating lymphocytes synthesize saturated PI.
ac, Sex-matched C57BL/6 mice were injected in the right flank with 1 × 10⁶ B16-F10-OVA cells. After three d, mice were given intraperitoneal injections of anti-PD-1 and anti-CTLA4 (aPD1 + aCTLA4) or matching isotype controls (IgG1 + IgG2) every three d for three rounds in total. Tumor growth was measured up to day 16 after tumor injection and CD8+ T cells were isolated on day 12 after tumor injection to measure T cell function and lipid composition. b, Average tumor diameter at indicated time points. n = 14 biologically independent animals; two-way ANOVA corrected for multiple comparisons (Sidak test) comparing the two groups at each time point across the dataset. c, Lipids were analyzed from TILs on day 12 after tumor injection. Saturation of acyl chains is expressed as a percentage of total PI. Statistical analysis was carried out on the summed percentage of saturated PI on n = 7 IgG1 + IgG2 and n = 8 aPD1 + aCTLA4 biologically independent samples using an unpaired two-tailed t-test. dh, CD8+ T cells were isolated from the blood of adult participants with histologically confirmed stage III or IV malignant melanoma (n = 13) on the day of immune checkpoint inhibitor treatment initiation (before therapy, “pre”) and then when the participant presented for the second administration of treatment (after therapy, “post”). Long-term disease response (non-responder versus responder) to checkpoint inhibitor treatment was assessed (median follow-up time of 318 d). Lipids were extracted and analyzed by LC–QqQ–MS/MS. e,f, Lipids were analyzed before and after therapy. Saturation of acyl chains is expressed as a percentage of total PI. Statistical analysis was carried out on the summed percentage of saturated PI using a two-tailed Wilcoxon matched-pairs signed-rank test (n = 13). g,h, Lipids were analyzed and grouped by response to therapy. Relative intensity of saturated PI species normalized to pre-therapy level is shown. Statistical analysis was carried out using a two-tailed Wilcoxon matched-pairs signed-rank test (n = 6 responders and n = 6 non-responders). Error bars show the s.e.m. s.c., subcutaneous.
Fig. 7 |
Fig. 7 |. PIP2 saturation defines early activation versus late effector T cell signaling.
Early CD8+ T cell activation is marked by a robust phosphorylation of PLCγ1, which cleaves polyunsaturated PIP2 to generate the second messengers DAG and IP3. In fully differentiated CD8+ Teff cells, PLCγ1 phosphorylation decreases as TCR signals dissipate; and a lipid raft-accumulated saturated PIP2 pool, synthesized de novo from glucose, becomes essential for sustained signaling and Teff cell survival, proliferation and cytokine production. When de novo PI synthesis is inhibited, the saturated PIP2 pool is specifically depleted, and this results in disturbed downstream signaling and reduced Teff cell fitness and function. Glc, glucose; MAPK, mitogen-activated protein kinase; Teff, CD8+ Teff cell. Created with BioRender.com.

References

    1. Waickman AT & Powell JD mTOR, metabolism, and the regulation of T cell differentiation and function. Immunol. Rev. 249, 43–58 (2012). - PMC - PubMed
    1. MacIver NJ, Michalek RD & Rathmell JC Metabolic regulation of T lymphocytes. Annu Rev. Immunol. 31, 259–283 (2013). - PMC - PubMed
    1. Shyer JA, Flavell RA & Bailis W Metabolic signaling in T cells. Cell Res 30, 649–659 (2020). - PMC - PubMed
    1. Carr EL et al. Glutamine uptake and metabolism are coordinately regulated by ERK/MAPK during T lymphocyte activation. J. Immunol. 185, 1037–1044 (2010). - PMC - PubMed
    1. Wang R et al. The transcription factor Myc controls metabolic reprogramming upon T lymphocyte activation. Immunity 35, 871–882 (2011). - PMC - PubMed

Publication types

MeSH terms

Substances