. 2023 Feb 2;14(1):86.
doi: 10.1038/s41467-022-35583-w.

Deletion of SNX9 alleviates CD8 T cell exhaustion for effective cellular cancer immunotherapy

Affiliations

Deletion of SNX9 alleviates CD8 T cell exhaustion for effective cellular cancer immunotherapy

Marcel P Trefny et al. Nat Commun. .

Abstract

Tumor-specific T cells are frequently exhausted by chronic antigenic stimulation. We here report on a human antigen-specific ex vivo model to explore new therapeutic options for T cell immunotherapies. T cells generated with this model resemble tumor-infiltrating exhausted T cells on a phenotypic and transcriptional level. Using a targeted pooled CRISPR-Cas9 screen and individual gene knockout validation experiments, we uncover sorting nexin-9 (SNX9) as a mediator of T cell exhaustion. Upon TCR/CD28 stimulation, deletion of SNX9 in CD8 T cells decreases PLCγ1, Ca2+, and NFATc2-mediated T cell signaling and reduces expression of NR4A1/3 and TOX. SNX9 knockout enhances memory differentiation and IFNγ secretion of adoptively transferred T cells and results in improved anti-tumor efficacy of human chimeric antigen receptor T cells in vivo. Our findings highlight that targeting SNX9 is a strategy to prevent T cell exhaustion and enhance anti-tumor immunity.


Conflict of interest statement

H.L., A.Zippelius received research funding from Bristol-Myers Squibb and Novartis. A.Zippelius received consulting/advisor fees from Bristol-Myers Squibb, Merck Sharp & Dohme, Hoffmann–La Roche, NBE Therapeutics, Secarna, ACM Pharma, and Hookipa, and maintains further non-commercial research agreements with Secarna, Hookipa, Roche and Beyondsprings. L.T.J. is a co-founder of, holds equity in and has a sponsored research agreement with Cimeio Therapeutics AG. A.Zippelius and M.P.T. have a pending patent application (PCT/EP2022/077391, “Targeting SNX9 rescues recombinant T cell in adoptive therapy”). The remaining authors declare no competing interests.

Figures
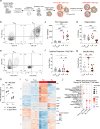
Fig. 1
Fig. 1. Repetitive antigen-specific stimulation ex vivo of T cells results in exhaustion.
a Scheme representing the principle of the exhaustion model. b Representative co-expression of PD-1 and TIM-3 measured by antibody staining and flow cytometry. c PD-1 expression measured by flow cytometry after antibody staining on day 12 after the first stimulation. n = 10 donors from n = 5 experiments except for Teff n = 4 of n = 2 experiments. d Degranulation measured by CD107a surface exposure during re-stimulation of all cells after 13 days of culture. n = 12 donors of n = 6 experiments except for Teff n = 6 of n = 3 experiments. e–f Representative flow cytometry plot and quantification of IFNγ and TNFα production measured by intracellular cytokine staining. n = 14 donors from n = 7 experiments except for Teff n = 8 of n = 4 experiments. g Specific lysis of T2-Luc+ tumor cells pulsed with peptide after 5 hours of co-incubation with T cells measured by luminescence intensity. n = 6 donors for Trest, n = 13 for Tex and n = 8 for Teff. h IFNγ secretion measured by ELISA after 4 days co-culture of Teff or Tex with MDA-MB-231 cells loaded with 100 nM NY-ESO-1-9V peptide in presence of either 10 μg/ml human IgG4 isotype control or anti-PD-1 antibody (Nivolumab). Statistics is a paired 2-way-ANOVA with Holm-Sidak correction with n = 5 donors. i Heatmap of all differentially regulated genes between the four conditions showing row-scaled log-cpms and clustered using k-means (numbers indicated on the left). Selected genes associated with exhaustion or functionality are labeled on the right. n = 4 donors. j Gene set enrichment analysis comparing mRNA expression of the different conditions for the Zheng. et al PanCancer T cell states. Color represents the mean log fold change and the size the -log10 false discovery rate (FDR). c-d; f-g 1-way ANOVA statistics with Holm-Sidak correction, Mean and SD are shown. * p < 0.05, ** p < 0.01, *** p < 0.001, **** p < 0.0001. Source data and exact p-values are provided as a Source Data file.
Fig. 2
Fig. 2. SNX9 is a potential mediator of T cell exhaustion.
a Schematic description of the targeted-pooled CRISPR-Cas9 KO screen. b Mean log2 fold changes for gRNA enrichment in the pooled CRISPR/Cas9 screen. Dots represent the mean enrichment of all 5 guides for each donor biological replicate. c Representative flow cytometry plots and quantification of SNX9 expression measured by antibody staining in flow cytometry of human CD8 T cells of the ex vivo model with the different conditions. Mean and SD are shown. n = 11 donors of n = 3 experiments. Statistics are a 1-way ANOVA with Holm-Sidak correction. d Representative flow cytometry plots of SNX9 vs. PD-1 and TIM-3 expression in tumor-infiltrating CD8 T cells of a non-small cell lung cancer (NSCLC) patient. e TIM-3 expression measured by flow cytometry in SNX9 positive vs. SNX9 negative in intratumoral PD-1+ CD8 T cells of NSCLC patients. Statistics are a two-tailed paired t-test. Mean and SD are shown. n = 10. f Percentage of SNX9+ cells among CD8 T cells for each sample before treatment with ICI. Statistic is a Mann-Whitney test (non-normal distribution). We used 1 log normalized counts as the threshold for SNX9 positivity. Samples with less than ten cells in either population were excluded, resulting in n = 10 nonresponders and n = 9 responders. c, e, f Mean and SD are shown. * p < 0.05, ** p < 0.01, *** p < 0.00 and **** p < 0.0001. Source data and exact p-values are provided as a Source Data file.
Fig. 3
Fig. 3. SNX9 KO improves effector functions of exhausted T cells and dampens the NFAT-NR4A1/3-TOX axis.
a Schematic procedure to generate SNX9 KO T cells. b IFNγ secretion by ELISA of Teff and Tex in response to re-stimulation. n = 10 donors (Teff) and 8 (Tex). c Top row: representative confocal images of Tex co-cultured with T2 tumor cells for actin (n = 6), and LAMP1/Perforin (n = 3). Bottom row: example images of CD28-EGFP (n = 6) or TCRz-EGFP (n = 5) fusion proteins, or anti-CD45 (n = 6) and SNX9 in Teff. All images are provided in the Source Data file. d Nuclear translocation measured by image cytometry of NFATc2 in Teff upon anti-CD3/28 stimulation. n = 7 donors of n = 2 experiments. e Area under the curve (AUC) of Calbryte520-AM Ca2+ flux upon stimulation. n = 8 donor of n = 3 experiments. f RT-qPCR quantifications of mRNA for NR4A1 and NR4A3 in cells on day 6 of the Tex culture. n = 7 donors of n = 2 experiments. g Antibody staining (delta unstained) of TOX in Tex. n = 8 donors of n = 4 experiments. h Expression of CCR7 measured by flow cytometry antibody staining in Tex. n = 8 of n = 3 experiments. b, e-h Statistics are a two-sided paired t-tests. i Geometric mean CD25 upregulation relative to unstimulated cells for Teff co-cultured with T2 wt or T2 CD80 CD86 KO (T2 KO) cells. 10 μg/ml human IgG1 or 10 μg/ml anti-CTLA4 blocking antibody (ipilimumab) was added. n = 6 donor replicates of n = 2 experiments. j CD25 geometric mean intensity of stimulated T cells with or without SNX9 KO. n = 7 donors of n = 2 experiments. k Delta unstimulated geometric mean of phospho-PLCγ1-Tyr783 fluorescence intensity. n = 4 donors. d, i-k Statistics are paired 2-way ANOVA with Holm-Sidak correction. * p < 0.05, ** p < 0.01, *** p < 0.001 and **** p < 0.0001. Source data and exact p-values are provided as a Source Data file.
Fig. 4
Fig. 4. Snx9 KO improves anti-tumor efficacy and reduces terminal exhaustion in vivo.
a Schematic experimental setup of OTI Snx9 KO generation and transfer to MC38-OVA-bearing mice. b Mean and SEM of MC38-OVA tumor volumes in C57BL/6 in n = 6 mice per condition. Curves are shown until the first mouse per group reaches the humane endpoint. Statistics are pairwise 2-way ANOVAs followed by Bonferroni correction. Representative of n = 3 experiments. c Percentage of PD-1high Tim3+ OTI cells in MC38-OVA tumors in C57BL/6 mice on the indicated timepoints. n = 6 intergenic and n = 4 Snx9 KO. Statistics are 2-way ANOVA with Holm-Sidak correction. d UMAP of single-cell RNA sequencing data from OTI cells isolated from MC38-OVA tumors 13 days post-transfer. Intergenic n = 3405 cells of 5 mice and Snx9 KO n = 3612 cells of 6 mice. e Average expression of selected marker genes (color). Size = percentage of cells with detected expression for each cluster. f Proportions of each cluster in the intergenic versus the Snx9 KO sample (n = 1 from 5–6 pooled mice per condition). g Selected differentially expressed genes between intergenic and OTI Snx9 KO cells per cluster. Size indicates the -log10 adjusted p-value and color the mean log2 fold change. Statistics were derived by Seurat’s FindMarkers function. h Quantification of endogenous CD8 T cells (left) and cDC1s (right) in MC38-OVA tumors 3 days post transfer of OTI cells. Statistics are unpaired t-tests. n = 6 mice per group (i) Serum levels of IFNγ and Il-10 for days 2,8 and 15. Limit of detection (LOD) is indicated for IFNγ. Statistics are unpaired 2-way ANOVA with Holm-Sidak correction. n = 6 mice per group. j Tumor volume (mean and SEM) of NSG mice with subcutaneous MC38-OVA tumors with a transfer of OTI cells at day 12 postinjection. n = 6 mice per OTI condition, n = 4 for untreated. Statistics are pairwise 2-way ANOVAs followed by Bonferroni correction * p < 0.05, ** p < 0.01, *** p < 0.001. c, h-i Mean and SD are shown. Source data and exact p-values are provided as a Source Data file.
Fig. 5
Fig. 5. Deletion of SNX9 improves CAR T cell anti-tumor efficacy.
a Schematic representation of the CAR T cell transfer experiments. Healthy donor human CD8 T cells are stimulated ex vivo and lentivirally transduced with an anti-human-CD19(FMC63vH)-CD28-CD3zeta-T2A-copGFP CAR construct and electroporated with Cas9-crRNA-tracrRNA complexes to generate SNX9 KO cells and intergenic controls. These cells are then transferred to NSG mice with subcutaneous Raji tumors (CD19+). b Tumor volume in mm3 of NSG mice treated 3 days post Raji tumor injection by i.v. transfer of 0.5 Mio human CD8 anti-CD19-28z CAR T cells with or without SNX9 KO (mean and SEM). Statistics are pairwise 2-way ANOVAs followed by Bonferroni correction. n = 8 animals for untreated of n = 2 experiments. n = 7 mice for CART-treated mice of n = 1 experiment. Experiment was replicated with similar results with higher CART numbers. c Survival of the NSG mice in 5b until humane endpoint of 1500mm3 tumor size. Statistics are log-rank Mantel-Cox tests followed by Bonferroni correction. (b and c): n = 8 for untreated, n = 7 for intergenic and SNX9 KO CAR T conditions. d Human cytokines measured by Legendplex (Biolegend) in the serum of Raji-bearing NSG mice treated with anti-CD19-28z CAR T cells with and without SNX9 KO. Statistics are paired-2-way ANOVA with Holm-Sidak correction. n = 6 mice per condition. Mean and SD are shown. e Tumor volume in mm3 (mean and SEM) of NSG mice treated 3 days post Raji tumor injection by i.v. transfer of 1 Mio human CD8+ CD28 KO anti-CD19-BBz CAR T cells with or without SNX9 KO. n = 6 for intergenic and SNX9 KO, n = 8 for untreated. Statistics are 2-way ANOVAs followed by Bonferroni correction. * p < 0.05, ** p < 0.01, *** p < 0.001. Source data and exact p-values are provided as a Source Data file.

References

    1. Philip M, Schietinger A. CD8+ T cell differentiation and dysfunction in cancer. Nat. Rev. Immunol. 2022;22:209–223. doi: 10.1038/s41577-021-00574-3. - DOI - PMC - PubMed
    1. Thommen DS, Schumacher TN. T Cell Dysfunction in Cancer. Cancer Cell. 2018;33:547–562. doi: 10.1016/j.ccell.2018.03.012. - DOI - PMC - PubMed
    1. Baitsch L, et al. Exhaustion of tumor-specific CD8+ T cells in metastases from melanoma patients. J. Clin. Invest. 2011;121:2350–2360. doi: 10.1172/JCI46102. - DOI - PMC - PubMed
    1. Zippelius A, et al. Effector Function of Human Tumor-Specific CD8 T Cells in Melanoma Lesions: A State of Local Functional Tolerance. Cancer Res. 2004;64:2865–2873. doi: 10.1158/0008-5472.CAN-03-3066. - DOI - PubMed
    1. Kim PS, Ahmed R. Features of responding T cells in cancer and chronic infection. Curr. Opin. Immunol. 2010;22:223–230. doi: 10.1016/j.coi.2010.02.005. - DOI - PMC - PubMed

Publication types