. 2023 Feb 2;9(1):14.
doi: 10.1038/s41531-023-00458-4.

Patients with isolated REM-sleep behavior disorder have elevated levels of alpha-synuclein aggregates in stool

Affiliations

Patients with isolated REM-sleep behavior disorder have elevated levels of alpha-synuclein aggregates in stool

Anja Schaffrath et al. NPJ Parkinsons Dis. .

Abstract

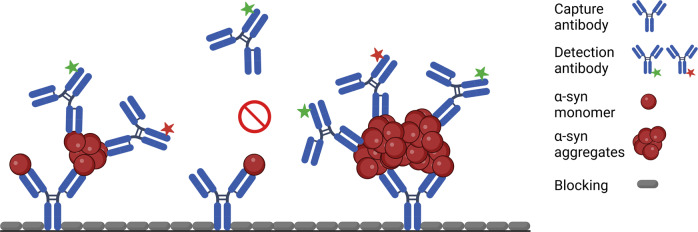
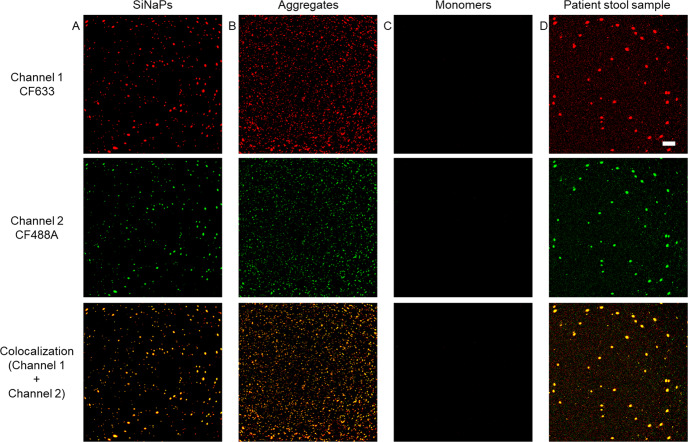
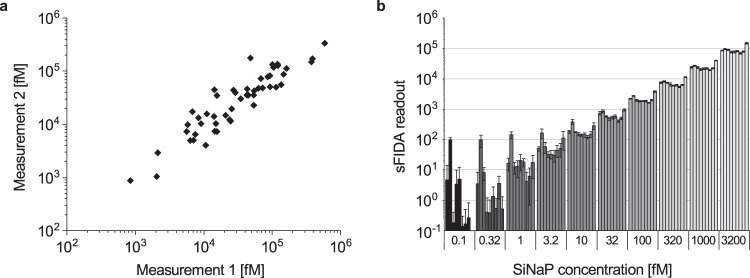
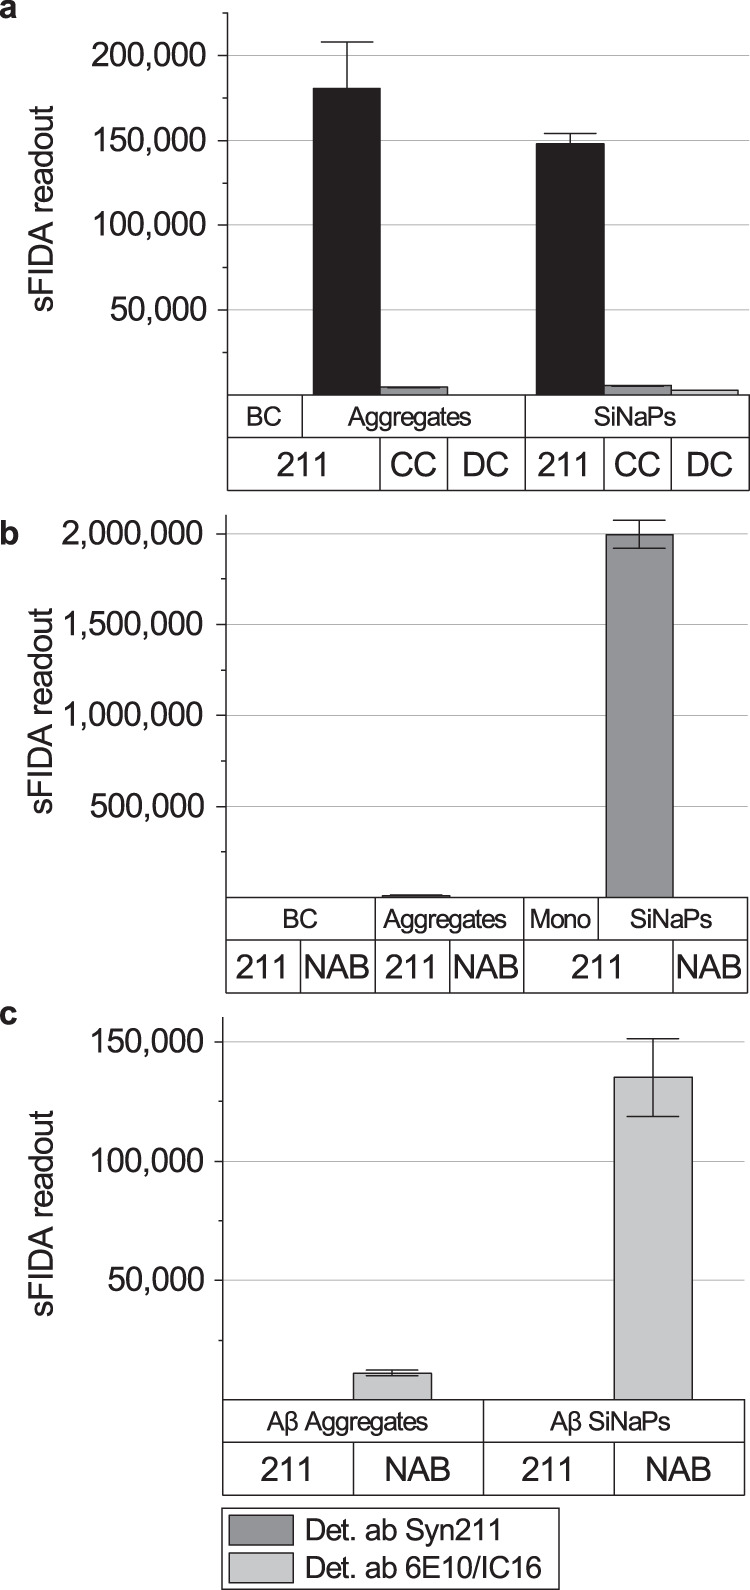
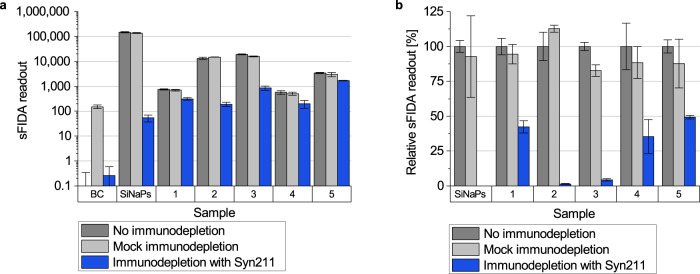
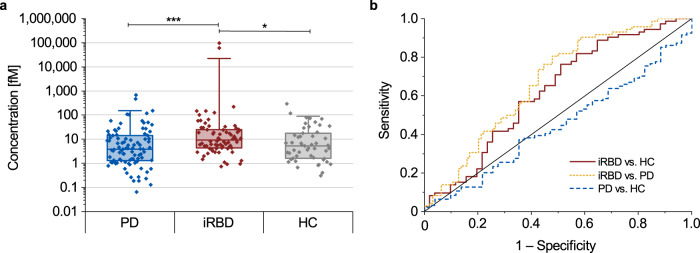
Misfolded and aggregated α-synuclein is a neuropathological hallmark of Parkinson's disease (PD). Thus, α-synuclein aggregates are regarded as a biomarker for the development of diagnostic assays. Quantification of α-synuclein aggregates in body fluids is challenging, and requires highly sensitive and specific assays. Recent studies suggest that α-synuclein aggregates may be shed into stool. We used surface-based fluorescence intensity distribution analysis (sFIDA) to detect and quantify single particles of α-synuclein aggregates in stool of 94 PD patients, 72 isolated rapid eye movement sleep behavior disorder (iRBD) patients, and 51 healthy controls. We measured significantly elevated concentrations of α-synuclein aggregates in stool of iRBD patients versus those of controls (p = 0.024) or PD patients (p < 0.001). Our results show that α-synuclein aggregates are excreted in stool and can be measured using the sFIDA assay, which could support the diagnosis of prodromal synucleinopathies.


Conflict of interest statement

D.W. and O.B. declare no competing non-financial interests but the following competing financial interests: D.W. and O.B. are shareholders of attyloid GmbH. A.S., S.S., A.S., H.J., P.Ö., M.P., L.B., A.C., J.W., T.B., G.R.R., M.S., M.T.B., and G.T. declare no competing interests.

Figures

Fig. 1
Fig. 1. Schematic figure of the sFIDA assay principle.
The glass surface of a microtiter plate is coated with a capture antibody (Syn211) against amino acid residues 121–125 of α-synuclein. The capture antibody binds both α-synuclein monomers and aggregates in the sample. The detection antibody (Syn211), a 1:1 mixture of this antibody labeled with fluorescent dye CF633 or CF488A, can only detect aggregates since it is directed against the same epitope as the capture antibody. The epitope on the monomer bound to the capture antibody is masked by the capture antibody and can, thus, not be bound by the detection antibody. The microtiter plate wells are imaged by two-channel confocal fluorescence microscopy to detect single particles. Only particles decorated with at least two different detection antibodies (colocalized signal) contribute to the sFIDA readout signal. The image was created with BioRender.com.
Fig. 2
Fig. 2. Fluorescence images of α-synuclein SiNaPs, synthetic α-synuclein aggregates, monomers, and a PD stool sample.
Shown are exemplary fluorescence images taken in the red fluorescence channel (channel 1, CF633), green fluorescence channel (channel 2, CF488A), and the colocalized fluorescence signal of both channels of a 0.32 pM α-synuclein SiNaPs in buffer b 1581 pM synthetic α-synuclein aggregates in buffer (concentration based on the deployed monomer concentration), c 1000 pM α-synuclein monomers in buffer, and d a stool sample of a PD patient. To better visualize the 16-bit images, the contrast and minimum/maximum values were adjusted. Scale bar: 30 µm.
Fig. 3
Fig. 3. Repeated measurements of α-synuclein aggregates in stool and of α-synuclein SiNaPs yield highly replicable results.
We tested the inter-assay variance of the sFIDA assay for α-synuclein aggregates. a Repeated measurements of 50 randomly selected stool samples by the same operator in the same laboratory on different days were highly reproducible with a Spearman coefficient of correlation of r = 0.916 (p = 0.2 × 10−6). b Nine independent measurements of a dilution series of the α-synuclein SiNaPs used for calibration of the stool sample data set also showed highly replicable results for all concentrations with a Spearman coefficient of correlation of r = 0.979 (p = 3.85 × 10−62). Error bars indicate standard deviation.
Fig. 4
Fig. 4. sFIDA with antibodies against α-synuclein specifically detects α-synuclein aggregates and α-synuclein SiNaPs but not α-synuclein monomers, Aβ aggregates, or Aβ SiNaPs.
a When either the capture antibody or the detection antibodies were omitted (capture control (CC), detection control (DC)), the sFIDA readout for the CC was reduced by 96% for α-synuclein SiNaPs and 97% for α-synuclein aggregates of the respective readout with a capture antibody. For the DC, the sFIDA readout was reduced by 98% for α-synuclein SiNaPs, and entirely for α-synuclein aggregates (100%), where the sFIDA readout was indistinguishable from the buffer control (BC). b The sFIDA readout of α-synuclein SiNaPs and α-synuclein aggregates, when captured with the NAB228 antibody against beta-amyloid (Aβ), was reduced by almost 100% for α-synuclein SiNaPs and 98% for synthetic α-synuclein aggregates compared to the signal with Syn211 capture antibody. The sFIDA readout of α-synuclein monomers (Mono) was reduced to the level of the BC compared to the same concentration of monomers in aggregated α-synuclein. c Additionally, Aβ aggregates and Aβ SiNaPs were captured and detected with the Syn211 antibody against α-synuclein. As a positive control, the same Aβ aggregates and Aβ SiNaPs were captured with antibodies specific to Aβ (capture antibody: NAB228, detection antibodies: 6E10/IC16). The graph shows that the Syn211 antibody does not detect Aβ aggregates or Aβ SiNaPs. Error bars indicate standard deviation.
Fig. 5
Fig. 5. Immunodepletion of α-synuclein SiNaPs and α-synuclein aggregates in stool samples.
a The α-synuclein SiNaPs standard and five stool samples were immunodepleted with magnetic beads coupled to Syn211 antibodies and, as a mock immunodepletion, without coupled antibodies. Immunodepletion entirely eliminated the sFIDA readout for α-synuclein SiNaPs (100%) and reduced that for α-synuclein aggregates in stool samples on average by 73%, ranging from 51% to 99% for different samples. Mock immunodepletion did not significantly affect the sFIDA readout with a reduction of about 7% for stool samples and α-synuclein SiNaPs. b The relative sFIDA readout [%] value represents the percent ratio of the sFIDA readouts of (mock) depleted to non-depleted samples.
Fig. 6
Fig. 6. Calibrated sFIDA results and receiver operating characteristic (ROC) analyses for detecting α-synuclein aggregates in stool samples.
Median concentrations of α-synuclein aggregates in stool samples of iRBD patients (9.2 fM) were significantly elevated compared to those of healthy controls (HC, 5.2 fM, p = 0.024) or PD patients (3.8 fM, p < 0.001). PD patients did not significantly differ from healthy controls. Box plots indicate the lower (Q1) and upper (Q3) quartiles as boxes. Horizontal lines within boxes indicate medians. Whiskers indicate 1.5 times the interquartile range (Q3–Q1) above Q3 and below Q1. Data falling outside this range are plotted as outliers. Significant differences between groups were calculated using the Kruskal–Wallis H test. ***p < 0.001, **0.001 ≤ p < 0.01, *0.01 ≤ p < 0.05. Error bars indicate standard deviation. b In the ROC analyses, discrimination of PD patients versus healthy controls showed a specificity of 96.1% and a sensitivity of 6.4%, with an area under the curve (AUC) of 0.447. In comparison, discrimination of iRBD patients versus healthy controls showed a specificity of 49.0% and a sensitivity of 76.4% with an AUC of 0.622 (see Table 2 for other specificity and sensitivity values and significances).

References

    1. Schweighauser M, et al. Structures of alpha-synuclein filaments from multiple system atrophy. Nature. 2020;585:464–469. - PMC - PubMed
    1. Yang Y, et al. Structures of alpha-synuclein filaments from human brains with Lewy pathology. Nature. 2022;610:791–795. - PMC - PubMed
    1. Spillantini MG, et al. Alpha-synuclein in Lewy bodies. Nature. 1997;388:839–840. - PubMed
    1. Spillantini MG, et al. Filamentous alpha-synuclein inclusions link multiple system atrophy with Parkinson’s disease and dementia with Lewy bodies. Neurosci. Lett. 1998;251:205–208. - PubMed
    1. Spillantini MG, Crowther RA, Jakes R, Hasegawa M, Goedert M. alpha-Synuclein in filamentous inclusions of Lewy bodies from Parkinson’s disease and dementia with lewy bodies. Proc. Natl Acad. Sci. USA. 1998;95:6469–6473. - PMC - PubMed