. 2023 Feb 2;13(1):1896.
doi: 10.1038/s41598-023-28955-9.

Circulating microRNA expression signatures accurately discriminate myalgic encephalomyelitis from fibromyalgia and comorbid conditions

Affiliations

Circulating microRNA expression signatures accurately discriminate myalgic encephalomyelitis from fibromyalgia and comorbid conditions

Evguenia Nepotchatykh et al. Sci Rep. .

Abstract

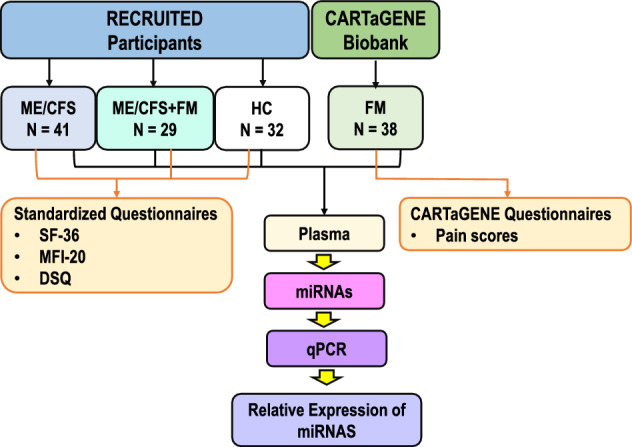
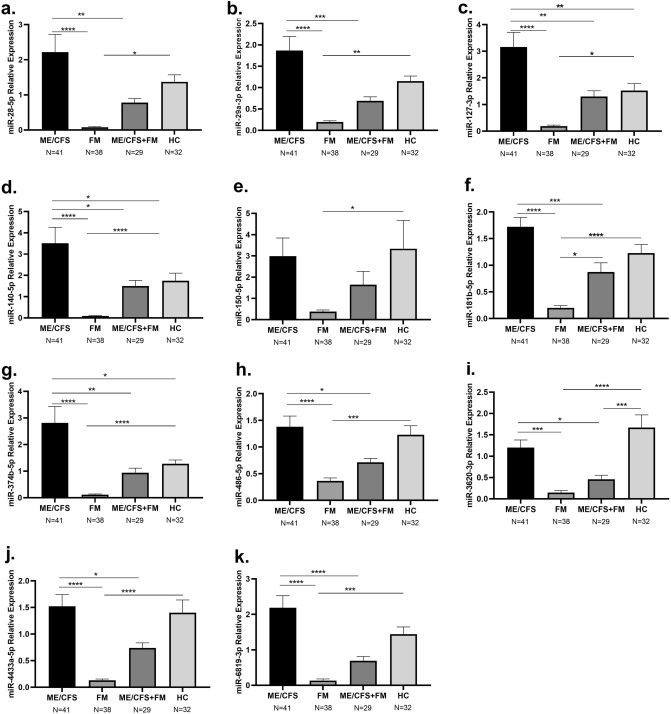
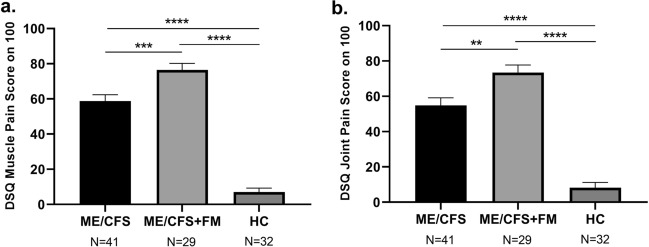
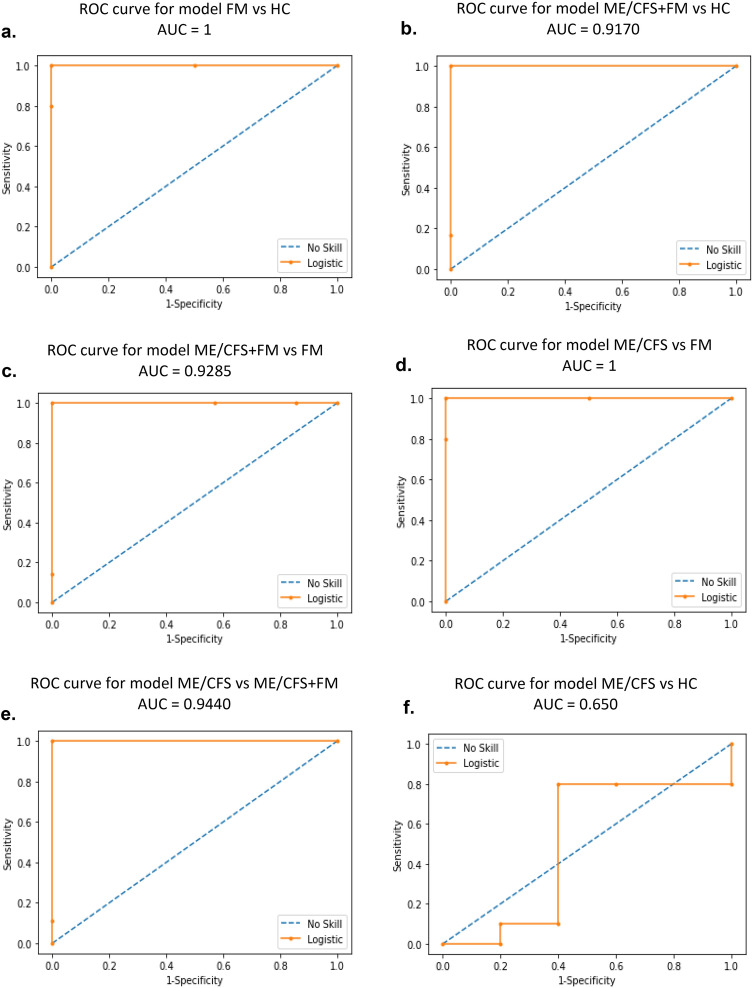
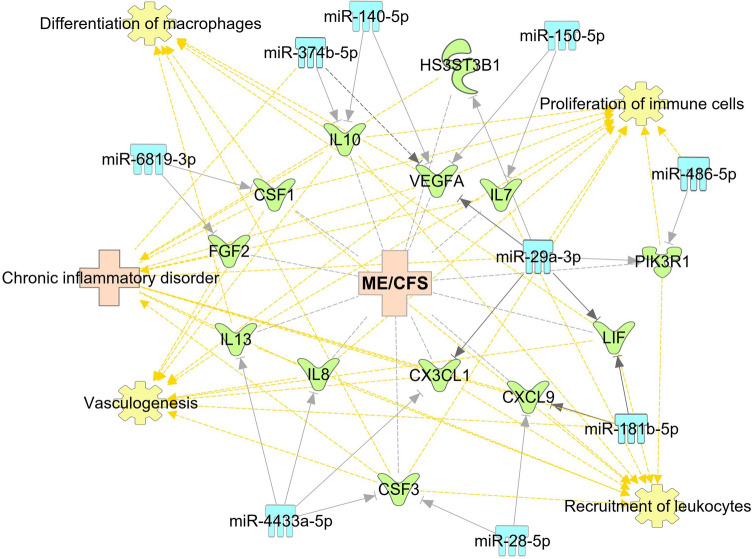
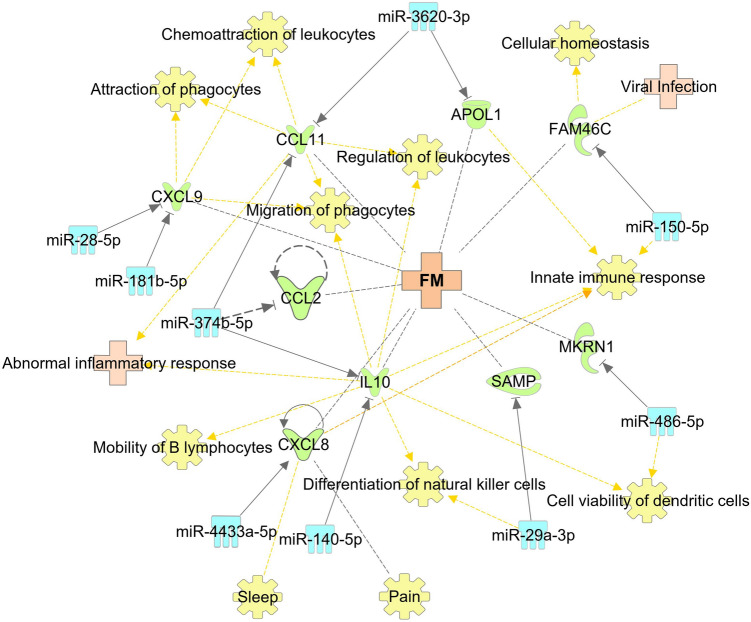
Myalgic encephalomyelitis/chronic fatigue syndrome (ME/CFS), and fibromyalgia (FM) are two chronic complex diseases with overlapping symptoms affecting multiple systems and organs over time. Due to the absence of validated biomarkers and similarity in symptoms, both disorders are misdiagnosed, and the comorbidity of the two is often unrecognized. Our study aimed to investigate the expression profiles of 11 circulating miRNAs previously associated with ME/CFS pathogenesis in FM patients and individuals with a comorbid diagnosis of FM associated with ME/CFS (ME/CFS + FM), and matched sedentary healthy controls. Whether these 11 circulating miRNAs expression can differentiate between the two disorders was also examined. Our results highlight differential circulating miRNAs expression signatures between ME/CFS, FM and ME/CFS + FM, which also correlate to symptom severity between ME/CFS and ME/CFS + FM groups. We provided a prediction model, by using a machine-learning approach based on 11 circulating miRNAs levels, which can be used to discriminate between patients suffering from ME/CFS, FM and ME/CFS + FM. These 11 miRNAs are proposed as potential biomarkers for discriminating ME/CFS from FM. The results of this study demonstrate that ME/CFS and FM are two distinct illnesses, and we highlight the comorbidity between the two conditions. Proper diagnosis of patients suffering from ME/CFS, FM or ME/CFS + FM is crucial to elucidate the pathophysiology of both diseases, determine preventive measures, and establish more effective treatments.


Conflict of interest statement

A.M. is Director of Interdisciplinary Canadian Collaborative Myalgic Encephalomyelitis (ICanCME) Research Network, a national research network funded by The Canadian Institutes of Health Research (grant MNC—166142 to A.M.) and a Member of the Scientific Advisory Board of the Open Medicine Foundation.

Figures

Figure 1
Figure 1
Representation of the experimental study design.
Figure 2
Figure 2
Relative expression of circulating miRNAs in individuals with ME/CFS, FM, ME/CFS + FM and HC. Displayed in the graphs are the mean and ± standard error of the mean of (a) hsa-miR-28-5p (b) hsa-miR-29a-3p (c) hsa-miR-127-3p (d) hsa-miR-140-5p (e) hsa-miR-150-5p (f) hsa-miR-181b-5p (g) hsa-miR-374b-5p (h) hsa-miR-486-5p (i) hsa-miR-3620-3p (j) hsa-miR-4433a-5p (k) hsa-miR-6819-3p. One-way ANOVA followed by Tukey’s multiple comparisons test were performed to determine the significant difference in the miRNA expression between the groups. Results were considered significant at *P value < 0.05, **P value < 0.01, ***P value < 0.001, ****P value < 0.0001.
Figure 3
Figure 3
Muscle pain score (a) and joint pain score (b) from the DSQ questionnaire reported by individuals with ME/CFS, ME/CFS + FM and HC. One-way ANOVA followed by Tukey’s multiple comparisons test were performed to determine the significant difference in the scores between the groups. Results were considered at *P value < 0.05, **P value < 0.01, ***P value < 0.001, ****P value < 0.0001.
Figure 4
Figure 4
ROC curves for different prediction models using Random Forest Model. (a) ROC curve for prediction model classifying FM versus HC. (b) ROC curve for prediction model identifying ME/CFS + FM versus HC. (c) ROC curve for prediction model for classification of ME/CFS + FM versus FM. (d) ROC curve for prediction model identifying ME/CFS versus HC. (e) ROC curve for prediction model classifying ME/CFS versus ME/CFS + FM. (f) ROC curve for prediction model identifying ME/CFS versus HC.
Figure 5
Figure 5
Genes related to ME/CFS that are predicted or confirmed targets of the 11 miRNAs. The miRNAs are presented in light blue. The targets of miRNAs are in green, ME/CFS, FM and other related diseases are in light pink, and associated functions of genes are in yellow.
Figure 6
Figure 6
Genes related to ME/CFS or FM that are predicted or confirmed targets of the 11 miRNAs. The miRNAs are presented in light blue. The targets of miRNAs are in green, ME/CFS, FM and other related diseases are in light pink, and associated functions of genes are in yellow.

References

    1. Chu L, Valencia IJ, Garvert DW, Montoya JG. Onset patterns and course of myalgic encephalomyelitis/chronic fatigue syndrome. Front. Pediatr. 2019;7:12. - PMC - PubMed
    1. Carruthers BM, et al. Myalgic encephalomyelitis/chronic fatigue syndrome: Clinical working case definition, diagnostic and treatment protocols. J. Chronic Fatigue Syndr. 2003;11:7–115.
    1. Maksoud R, et al. A systematic review of nutraceutical interventions for mitochondrial dysfunctions in myalgic encephalomyelitis/chronic fatigue syndrome. J. Transl. Med. 2021;19:81. - PMC - PubMed
    1. Hoel F, et al. A map of metabolic phenotypes in patients with myalgic encephalomyelitis/chronic fatigue syndrome. JCI Insight. 2021 doi: 10.1172/jci.insight.149217. - DOI - PMC - PubMed
    1. Johnston S, Brenu EW, Staines D, Marshall-Gradisnik S. The prevalence of chronic fatigue syndrome/myalgic encephalomyelitis: A meta-analysis. Clin. Epidemiol. 2013;5:105–110. - PMC - PubMed

Publication types