. 2023 Apr;19(4):507-517.
doi: 10.1038/s41589-022-01244-8. Epub 2023 Feb 2.

3-Mercaptopyruvate sulfur transferase is a protein persulfidase

Affiliations

3-Mercaptopyruvate sulfur transferase is a protein persulfidase

Brandán Pedre et al. Nat Chem Biol. 2023 Apr.

Abstract

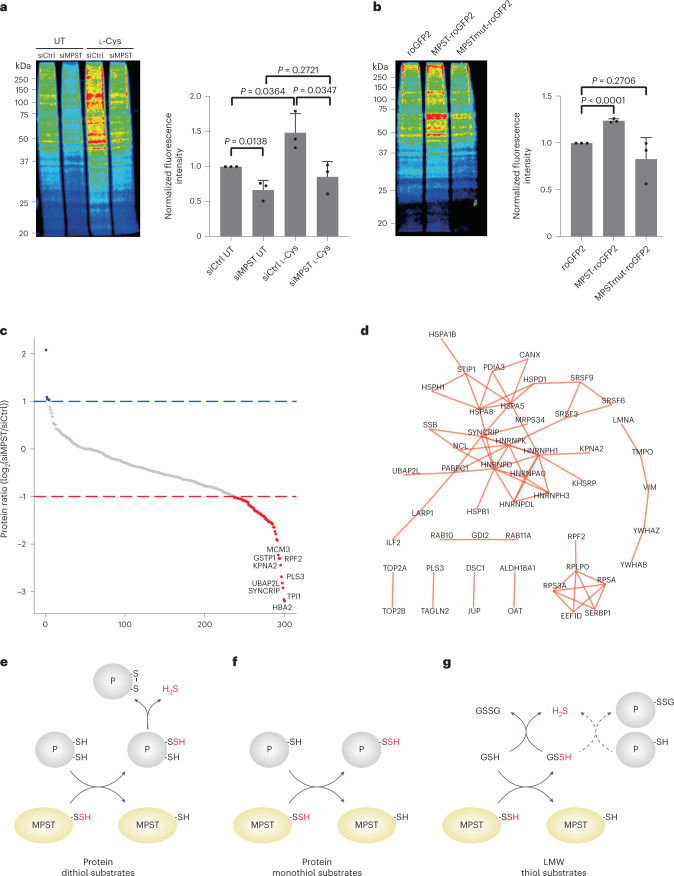
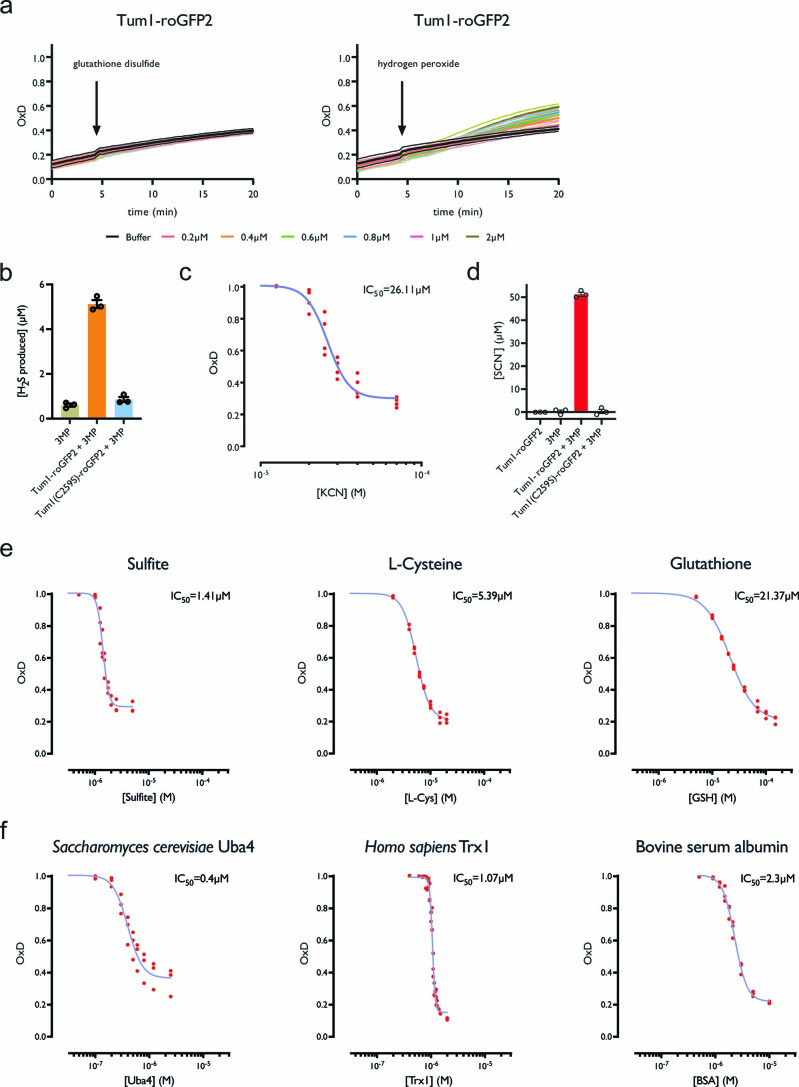
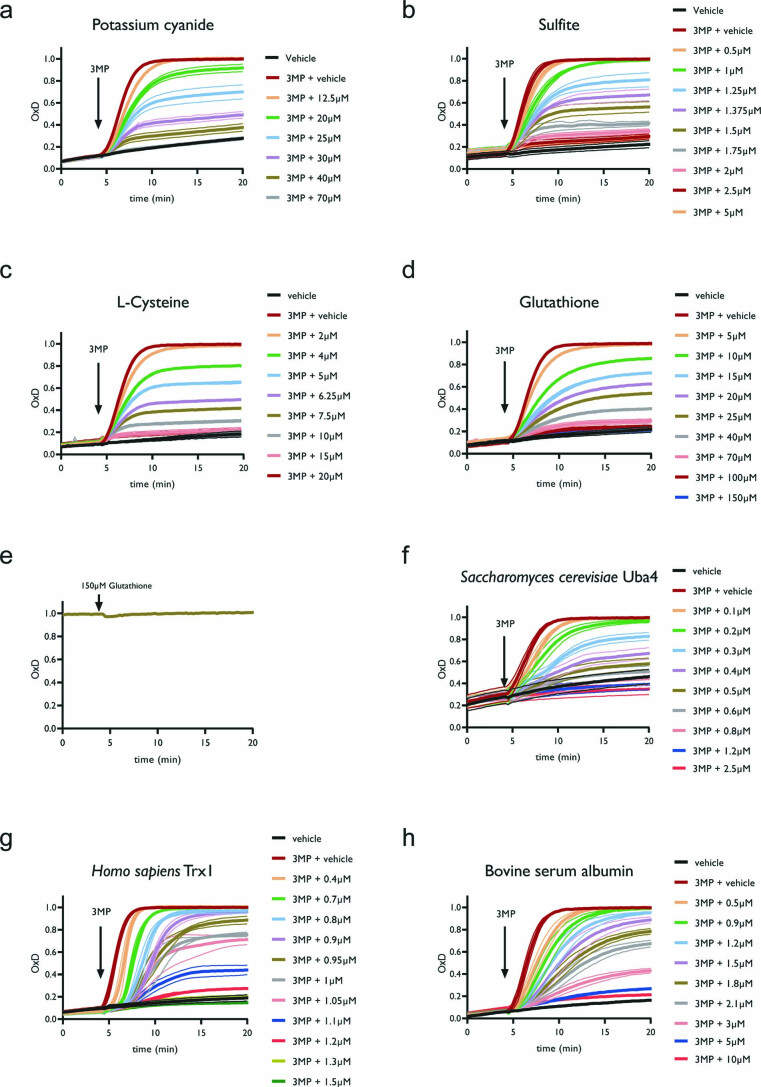
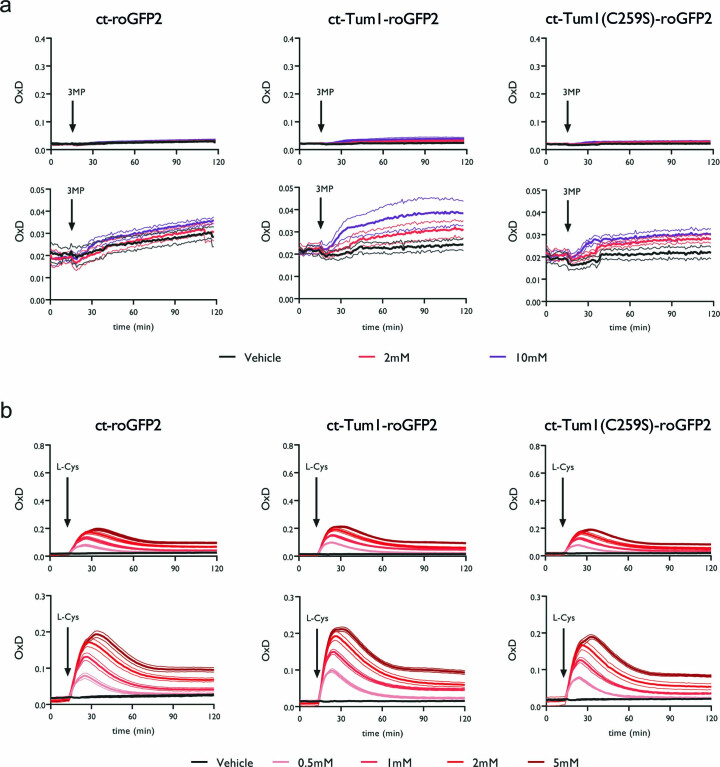
Protein S-persulfidation (P-SSH) is recognized as a common posttranslational modification. It occurs under basal conditions and is often observed to be elevated under stress conditions. However, the mechanism(s) by which proteins are persulfidated inside cells have remained unclear. Here we report that 3-mercaptopyruvate sulfur transferase (MPST) engages in direct protein-to-protein transpersulfidation reactions beyond its previously known protein substrates thioredoxin and MOCS3/Uba4, associated with H2S generation and transfer RNA thiolation, respectively. We observe that depletion of MPST in human cells lowers overall intracellular protein persulfidation levels and identify a subset of proteins whose persulfidation depends on MPST. The predicted involvement of these proteins in the adaptation to stress responses supports the notion that MPST-dependent protein persulfidation promotes cytoprotective functions. The observation of MPST-independent protein persulfidation suggests that other protein persulfidases remain to be identified.


Conflict of interest statement

The authors declare no competing interests.

Figures

Fig. 1
Fig. 1. Tum1-roGFP2 couples 3MP desulfuration to roGFP2 oxidation, releasing H2S in the process.
a, Degree of oxidation (OxD) of 100 nM Tum1-roGFP2 (left panel), roGFP2 (center panel) and Tum1(C259S)-roGFP2 (right panel), in response to increasing 3MP concentrations. b, Degree of oxidation of 100 nM Tum1-roGFP2, in response to increasing concentrations of l-cysteine (left panel), 3-mercaptolactate (center panel) and thiosulfate (right panel). c, H2S release from 2.5 μM Tum1-roGFP2 on addition of 50 μM 3MP, as measured by an H2S-selective electrode. d, The half-maximum inhibitory concentration (IC50) values for LMW compounds acting as Tum1 sulfur acceptors. e, IC50 values for proteins acting as Tum1 sulfur acceptors. All data are based on n = 3 independent experiments. Source data
Fig. 2
Fig. 2. Mitochondrial Tum1-roGFP2 responds to 3MP and l-Cys.
a, Response of roGFP2 (left), Tum1-roGFP2 (center) and Tum1(C259S)-roGFP2 (right), expressed in the mitochondrial matrix (mt), to exogenously added 3MP. b, Response of roGFP2 (left), Tum1-roGFP2 (center) and Tum1(C259S)-roGFP2 (right), expressed in the mitochondrial matrix (mt), to exogenously added l-Cys. Data are based on n = 3 independent experiments, except for Tum1-roGFP2 + 3MP (n = 2). Source data
Fig. 3
Fig. 3. Mitochondrial Tum1-roGFP2 responds to endogenously produced 3MP.
a, Response of mitochondrial Tum1-roGFP2 to l-Cys in the parental strain (WT, left panel) and in a strain lacking mitochondrial cysteine transaminase (Δaat1, right panel). b, Response of mitochondrial probes roGFP2 (left), Tum1-roGFP2 (center) and Tum1(C259S)-roGFP2 (right) to exogenously added d-Cys (purple) or d-Ala (green), in a strain expressing mitochondrial DAAO. All data are based on n = 3 independent experiments. Source data
Fig. 4
Fig. 4. Tum1 oxidizes roGFP2 independently of forced proximity.
a, Response of cytosolic (ct) Tum1-roGFP2 to l-Cys in the parental (WT, left) and Δtum1 strain (right). b, In vitro response of roGFP2 (100 nM) to increasing 3MP concentrations in the presence of an equimolar amount of 100 nM wild-type (left panel) or mutant Tum1 (right panel). c, In vitro response of the Tum1-roGFP2 fusion protein (100 nM) to 3MP (solid lines) in comparison to the response of an equimolar mixture of 100 nM roGFP2 and 100 nM Tum1 (dashed lines). d, In vitro response of roGFP2 (100 nM) to 3MP in the presence of increasing concentrations of Tum1. All data are based on n = 3 independent experiments. Source data
Fig. 5
Fig. 5. Tum1 directly persulfidates other proteins.
a,b, Mass spectra of H. sapiens Trx1(C35S) (a) and roGFP2(C205S) (b) exposed to Tum1 and 3MP (red curve), or to an inactive Tum1 system (black curve). n = 1. c, Oxidation of roGFP2 (420 nM) by immobilized Tum1-SSH, in the absence of LMW compounds (beads; red line), or by the corresponding supernatant (SN; black line) of the reaction between immobilized Tum1 (2 µM) and 3MP (100 µM), that is, in the absence of Tum1-SSH. Control (ctrl) experiments were performed in absence of 3MP. n = 2 independent experiments. d, The same experiment as in c, but with the initial reaction between immobilized Tum1 (2 µM) and 3MP (100 µM) conducted in the presence of GSH (100 µM), thus diminishing formation of MPST-SSH. n = 2 independent experiments. e, Oxidation of roGFP2 (420 nM) by immobilized Tum1-SSH in the presence of GSH (beads + GSH; purple line), or by the corresponding supernatant in the presence of GSH (SN + GSH; blue line). Left panel: 420 nM GSH. Right panel: 2,100 nM GSH. The curves obtained in c (beads and SN in the absence of GSH; red and black lines, respectively) are included for direct comparison. n = 2 independent experiments. Source data
Fig. 6
Fig. 6. MPST contributes to global protein persulfidation.
a, Overall persulfidation levels in HEK293 MSR cells before and after depletion of MPST (left panel). Cells were treated with 5 mM l-Cys for 30 min or were left untreated (UT). Relative persulfidation levels are indicated by Coomassie-normalized fluorescence intensity (right panel). Data are presented as mean and individual values (n = 3 biologically independent experiments) ± s.e.m. Statistical analysis based on a two-tailed unpaired t-test. b, Overall persulfidation levels in HEK293 MSR cells ectopically overexpressing roGFP2, MPST-roGFP2 or MPST(C248S)-roGFP2 (MPSTmut-roGFP2) (left panel). Relative persulfidation levels are indicated by Coomassie-normalized fluorescence intensity (right panel). Data are presented as mean and individual values (n = 3 biologically independent experiments) ± s.e.m. Statistical analysis based on a two-tailed unpaired t-test. c, Influence of MPST depletion on the persulfidation of individual proteins. Proteins depleted by at least twofold in MPST-depleted cells are marked in red. d, Interaction analysis of candidate MPST target proteins. Edges represent experimentally supported protein–protein interactions (confidence score >0.4) acquired from the STRING database. The graph was generated with Cytoscape. eg, Summary of MPST-driven transpersulfidation. The MPST-bound persulfide (MPST-SSH) sulfurates thiol-containing molecules, the outcome depending on the type of acceptor. e, Sulfur transfer to proteins (P) with vicinal dithiols (roGFP2, Trx1) generates a protein disulfide and releases H2S. f, Sulfur transfer to protein monothiols leads to longer-lived protein persulfides. g, Sulfur transfer to GSH generates GSSH, which releases H2S to generate GSSG or (dotted lines) to glutathionylate proteins. Source data
Extended Data Fig. 1
Extended Data Fig. 1. Comparison of sulfur acceptors for MPST.
(a) Degree of oxidation (OxD) of Tum1-roGFP2 in response to increasing glutathione disulfide (left panel) or hydrogen peroxide concentrations (right panel). (b) Concentrations of H2S as measured 5 min after addition of 3MP. Data are presented as mean and individual values (n = 3 independent experiments) +/- SEM. (c) Competition of 3MP-dependent Tum1-roGFP2 oxidation (OxD) by increasing concentrations of potassium cyanide (KCN). (d) Catalytically active Tum1-roGFP2 converts cyanide to thiocyanate (SCN), in a 3MP- dependent manner. Data are presented as mean and individual values (n = 3 independent experiments) +/- SEM. (e) Competition of 3MP-dependent Tum1-roGFP2 oxidation (OxD) by increasing concentrations of sulfite (left panel), l-cysteine (center panel), and glutathione (right panel). (f) Competition of 3MP-dependent Tum1-roGFP2 oxidation (OxD) by increasing concentrations of S. cerevisiae Uba4 (left panel), H. sapiens thioredoxin 1 (Trx1) (center panel), and bovine serum albumin (right panel). All data are based on n = 3 independent experiments. Source data
Extended Data Fig. 2
Extended Data Fig. 2. Competition between roGFP2 and other sulfur acceptors.
(a) Competition of 3MP-dependent Tum1-roGFP2 oxidation (OxD) by increasing concentrations of potassium cyanide (KCN). (b) Competition of 3MP-dependent Tum1-roGFP2 oxidation (OxD) by increasing concentrations of sulfite. (c) Competition of 3MP-dependent Tum1-roGFP2 oxidation (OxD) by increasing concentrations of L-cysteine. (d) Competition of 3MP-dependent Tum1-roGFP2 oxidation (OxD) by increasing concentrations of glutathione. (e) Lack of reduction of oxidized Tum1-roGFP2 upon the addition of 150 μM glutathione. (f) Competition of 3MP-dependent Tum1-roGFP2 oxidation (OxD) by increasing concentrations of S. cerevisiae Uba4. (g) Competition of 3MP-dependent Tum1-roGFP2 oxidation (OxD) by increasing concentrations of H. sapiens thioredoxin 1 (Trx1). (h) Competition of 3MP-dependent Tum1-roGFP2 oxidation (OxD) by increasing concentrations of bovine serum albumin. All data are based on n = 3 independent experiments, except (e) (n = 1). Source data
Extended Data Fig. 3
Extended Data Fig. 3. Response of cytosolic probes to 3MP and l-Cys.
(a) Response of roGFP2 (left panels), Tum1-roGFP2 (center panels) and Tum1(C259S)-roGFP2 (right panels), expressed in the cytosol (ct), to exogenously added 3MP. The lower panels show the same curves on a smaller y axis scale. (b) Response of roGFP2 (left panels), Tum1-roGFP2 (center panels) and Tum1(C259S)-roGFP2 (right panels), expressed in the cytosol (ct), to exogenously added l-Cys. The lower panels show the same curves on a smaller y axis scale. All data are based on n = 3 independent experiments. Source data
Extended Data Fig. 4
Extended Data Fig. 4. Response of mitochondrial Tum1-roGFP2 to d-Cys.
(a) Mitochondrial Tum1-roGFP2 does not respond to exogenously added d-cysteine (d-Cys) when expressed in cells lacking D-amino acid oxidase. Data are based on n = 3 independent experiments. Source data
Extended Data Fig. 5
Extended Data Fig. 5. Tum1 oxidizes roGFP2 by transpersulfidation, not disulfide exchange.
(a-b) Mass spectra of roGFP2 (a) and roGFP2(C148S) (b) exposed to Tum1 in the presence (red curves) or absence (black curves) of 3MP. n = 1 experiment. (c-d) Mass spectra of roGFP2(C148S) (c) and roGFP2(C205S) (d) in the m/z = 60500-62000 region. The lack of signals indicates the absence of mixed disulfide conjugates between Tum1 and roGFP2. n = 1 experiment. Source data
Extended Data Fig. 6
Extended Data Fig. 6. MPST-bound sulfane sulfur is not released into the supernatant.
(a-d) Reactivity of SSP4 towards immobilized Tum1-SSH (beads, red lines), or towards the corresponding supernatant (SN, black lines) of the reaction between immobilized Tum1 and 3MP, in the absence (a), or presence of Na2S (10 µM) (b), in the presence of GSH (100 µM) (c), and in the presence of both GSH (100 µM) and Na2S (10 µM) (d). Control (ctrl) experiments were performed in absence of 3MP. Data are based on n = 2 independent experiments. (e) Oxidation of roGFP2 by immobilized Tum1-SSH (beads, red line), or by the corresponding supernatant (SN, black line) of the reaction of immobilized Tum1 and 3MP, performed in the presence of Na2S (10 µM). Data are based on n = 2 independent experiments. Source data
Extended Data Fig. 7
Extended Data Fig. 7. Depletion and overexpression of MPST.
(a) Loading control for the experiment shown in main Fig. 6a. (b) Depletion of MPST in HEK293 MSR cells, as demonstrated by anti-MPST immunoblotting. (c) Loading control for the experiment shown in main Fig. 6b. (d) Overexpression of roGFP2 (left), MPST-roGFP2 (center), and MPST(C259S)-roGFP2 (MPSTmut-roGFP2, right) in HEK293 MSR cells, as demonstrated by anti-GFP immunoblotting. All data are based on n ≥ 3 replicates. Source data

References

    1. Zivanovic J, et al. Selective persulfide detection reveals evolutionarily conserved antiaging effects of s-sulfhydration. Cell Metab. 2019;30:1152–1170.e13. doi: 10.1016/j.cmet.2019.10.007. - DOI - PMC - PubMed
    1. Gao X-H, et al. Quantitative H2S-mediated protein sulfhydration reveals metabolic reprogramming during the integrated stress response. eLife. 2015;4:e10067. doi: 10.7554/eLife.10067. - DOI - PMC - PubMed
    1. Dóka É, et al. A novel persulfide detection method reveals protein persulfide- and polysulfide-reducing functions of thioredoxin and glutathione systems. Sci. Adv. 2016;2:e1500968. doi: 10.1126/sciadv.1500968. - DOI - PMC - PubMed
    1. Wedmann R, et al. Improved tag-switch method reveals that thioredoxin acts as depersulfidase and controls the intracellular levels of protein persulfidation. Chem. Sci. 2016;7:3414–3426. doi: 10.1039/C5SC04818D. - DOI - PMC - PubMed
    1. Xie L, et al. Hydrogen sulfide induces Keap1 S-sulfhydration and suppresses diabetes-accelerated atherosclerosis via Nrf2 activation. Diabetes. 2016;65:3171–3184. doi: 10.2337/db16-0020. - DOI - PMC - PubMed

Publication types

LinkOut - more resources