. 2023 Feb;29(2):483-492.
doi: 10.1038/s41591-022-02194-3. Epub 2023 Feb 2.

Landscape of pathogenic mutations in premature ovarian insufficiency

Affiliations

Landscape of pathogenic mutations in premature ovarian insufficiency

Hanni Ke et al. Nat Med. 2023 Feb.

Abstract

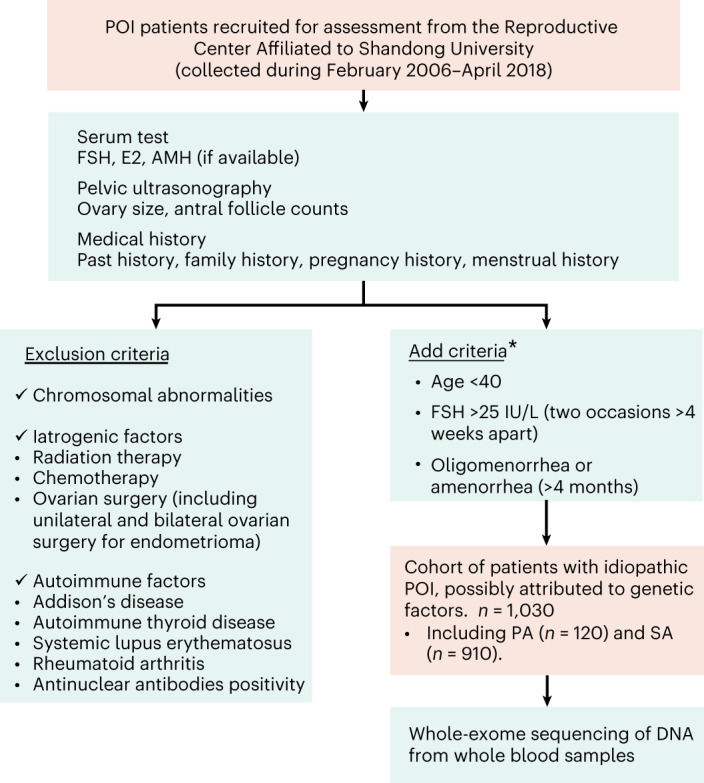
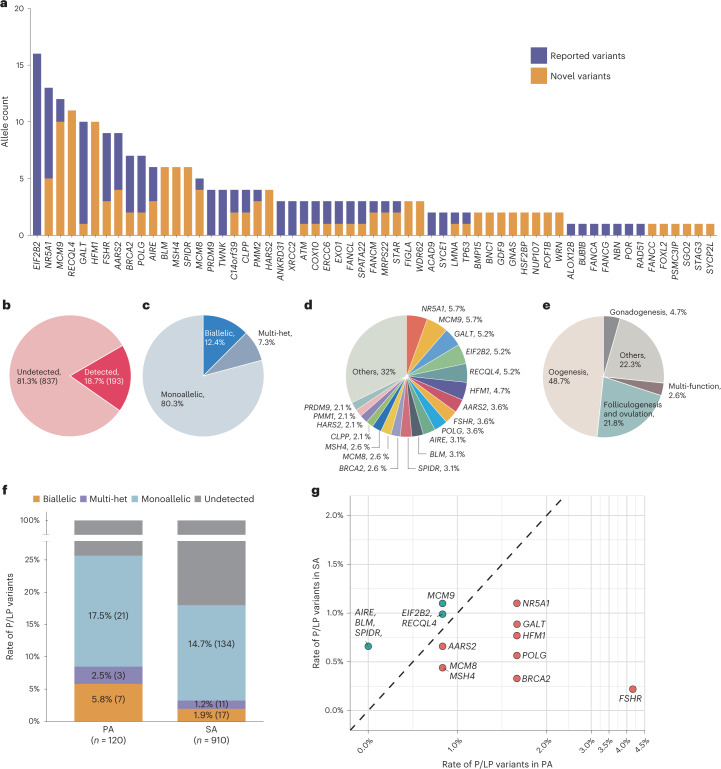
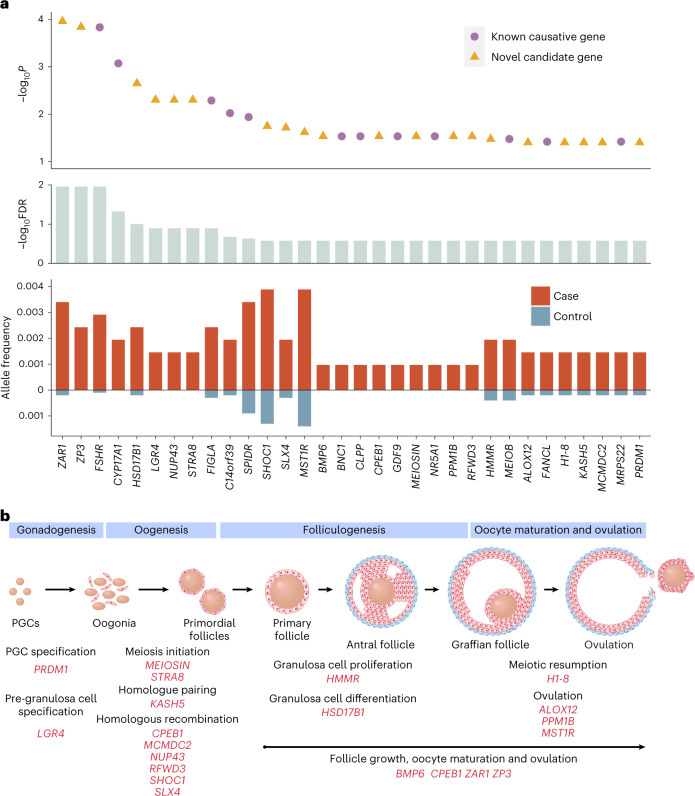
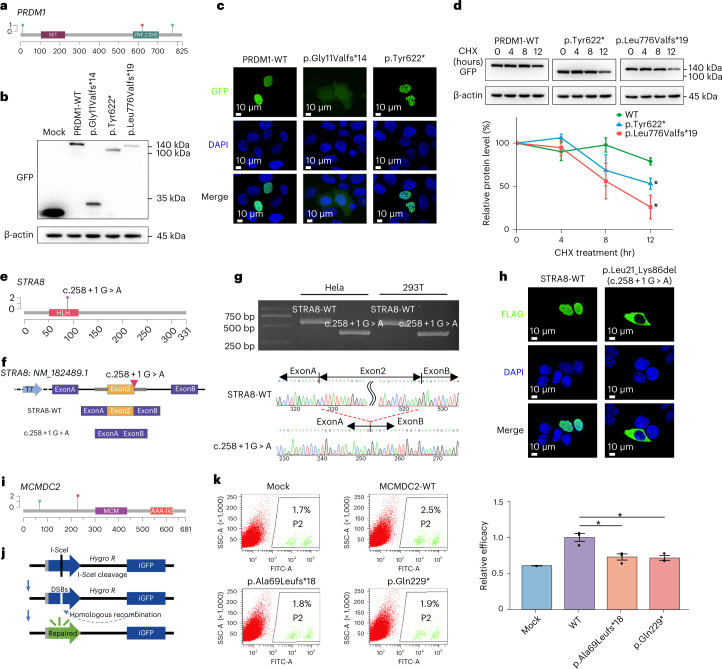
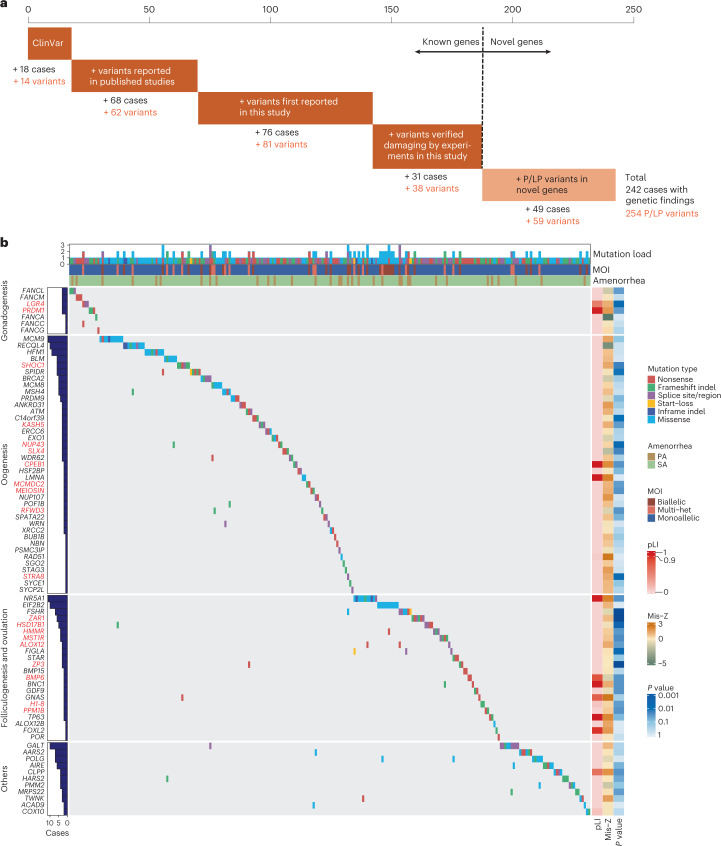
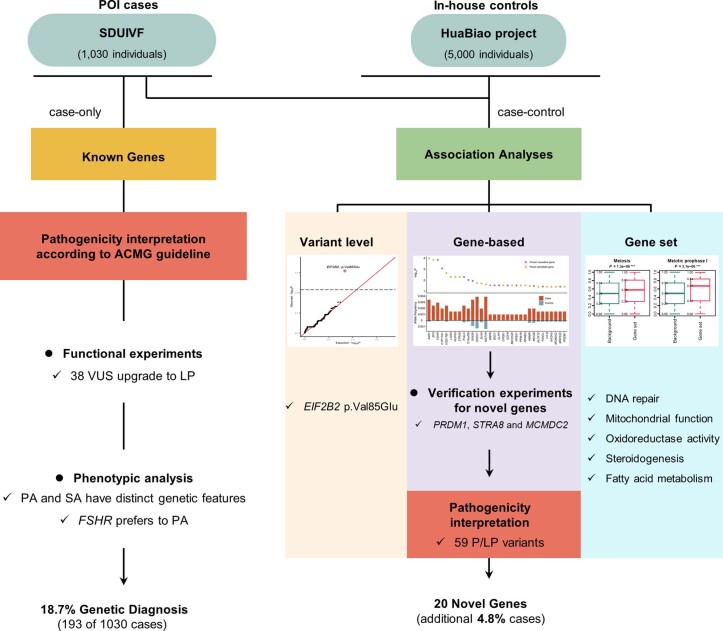
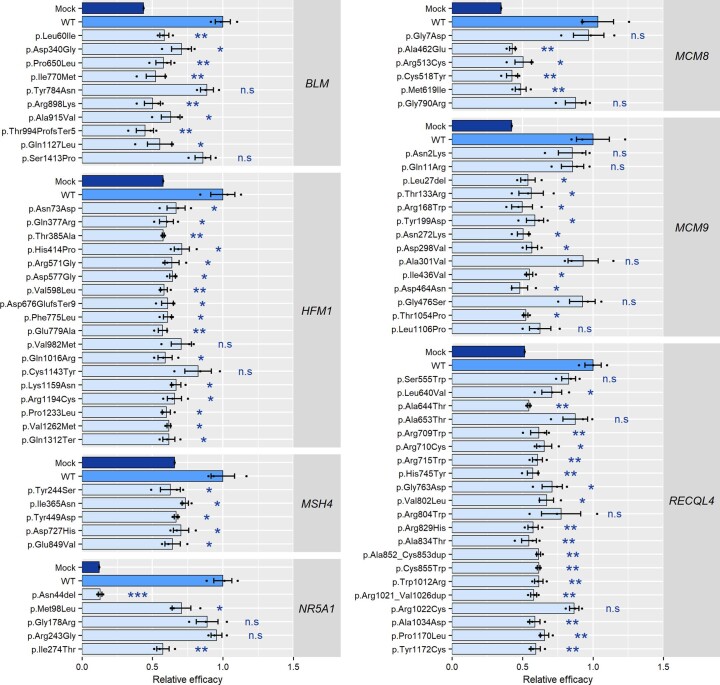
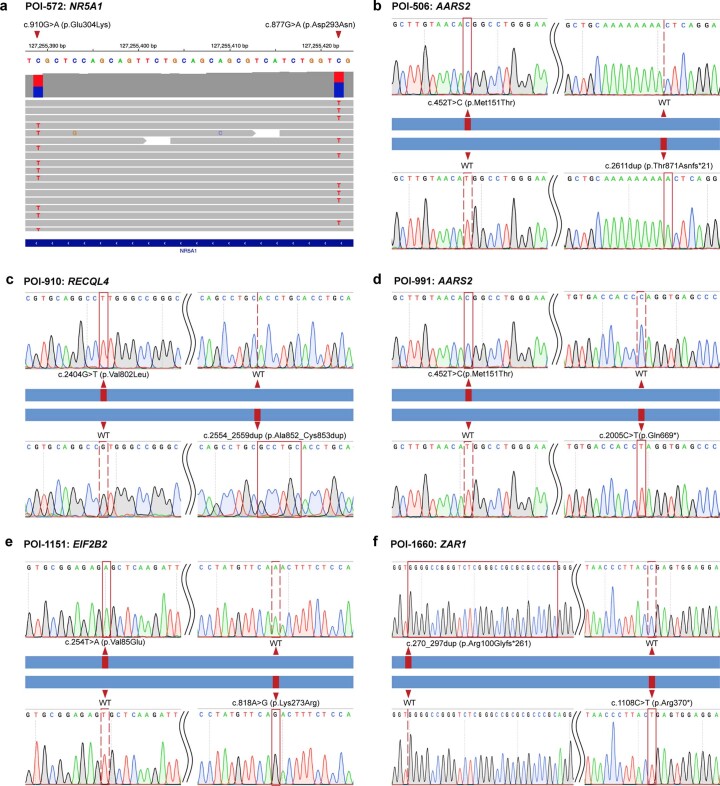
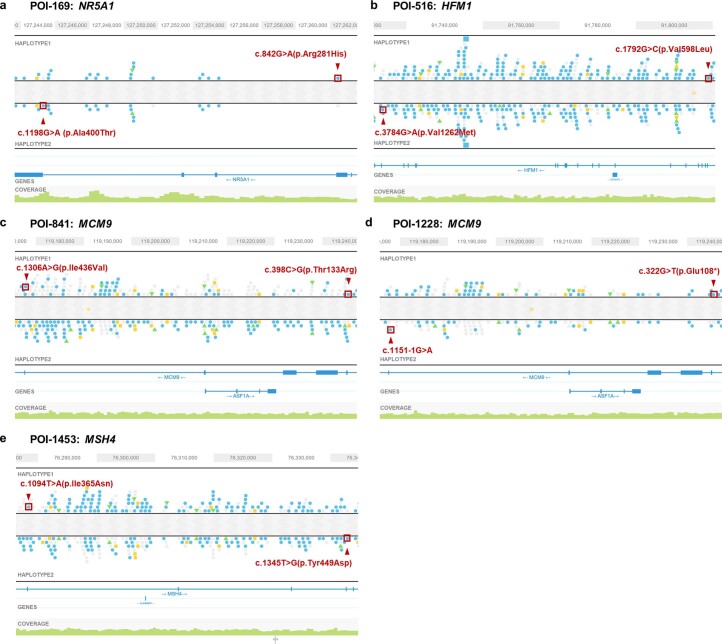
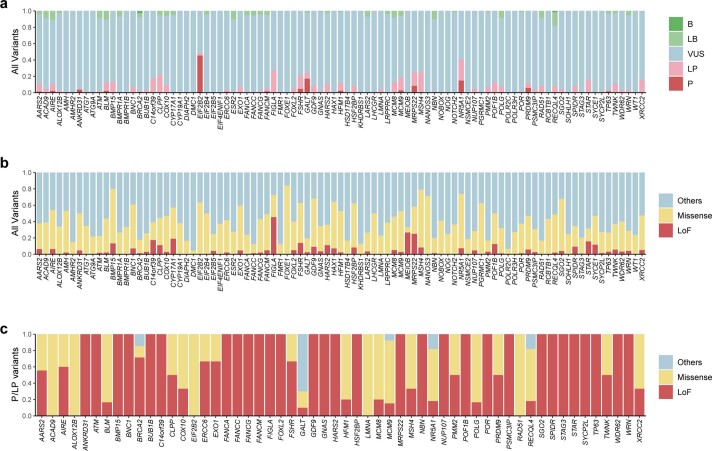
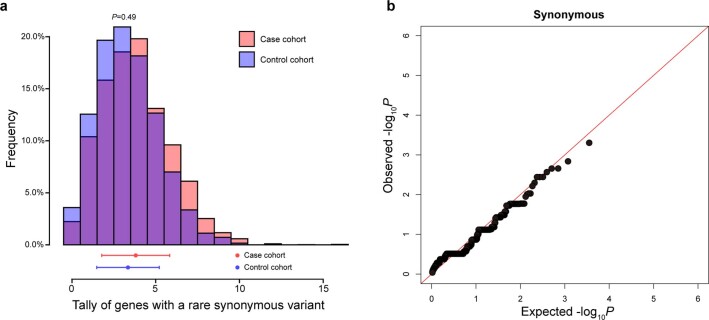
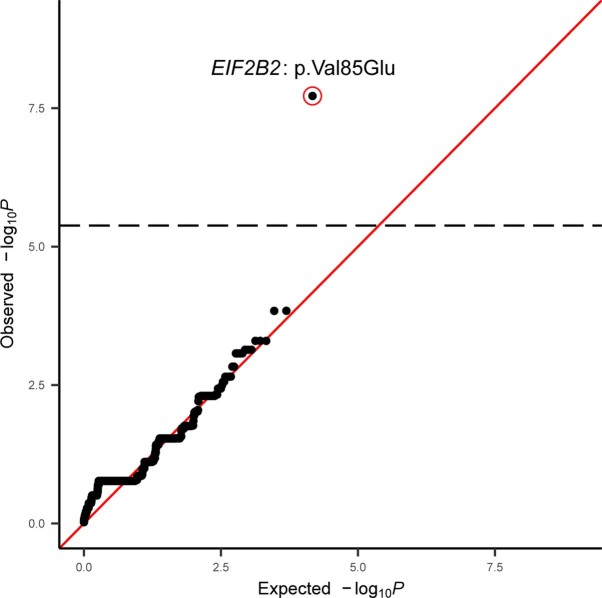
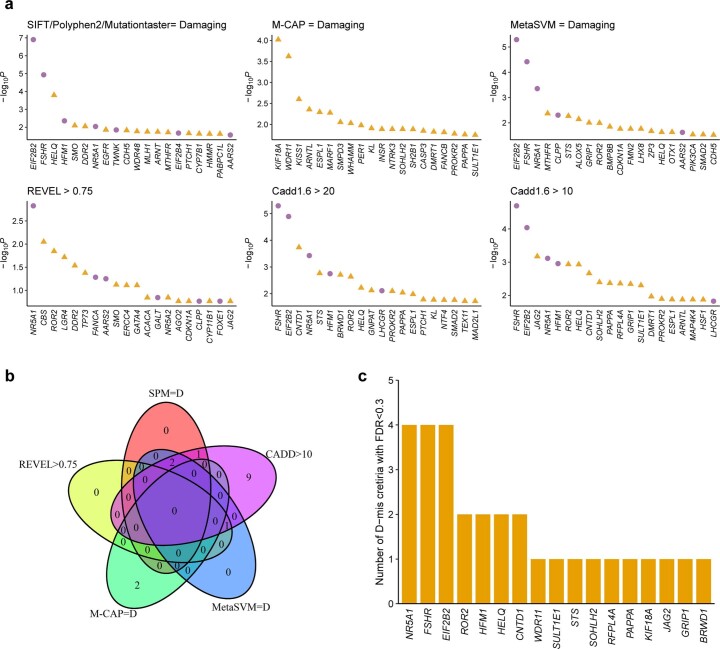
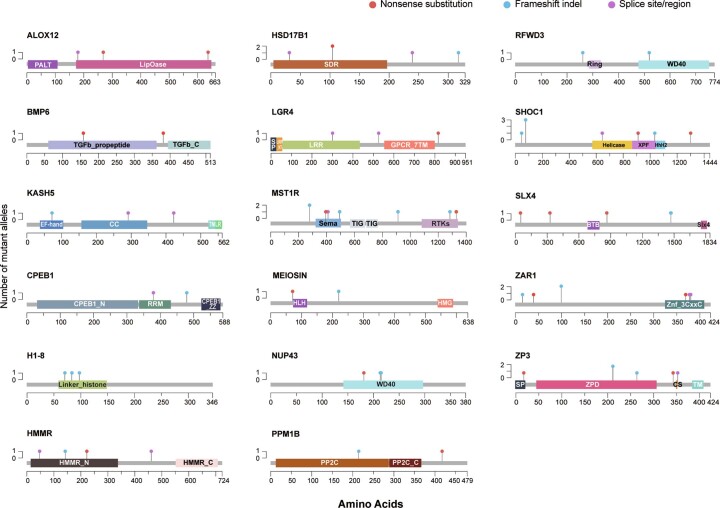
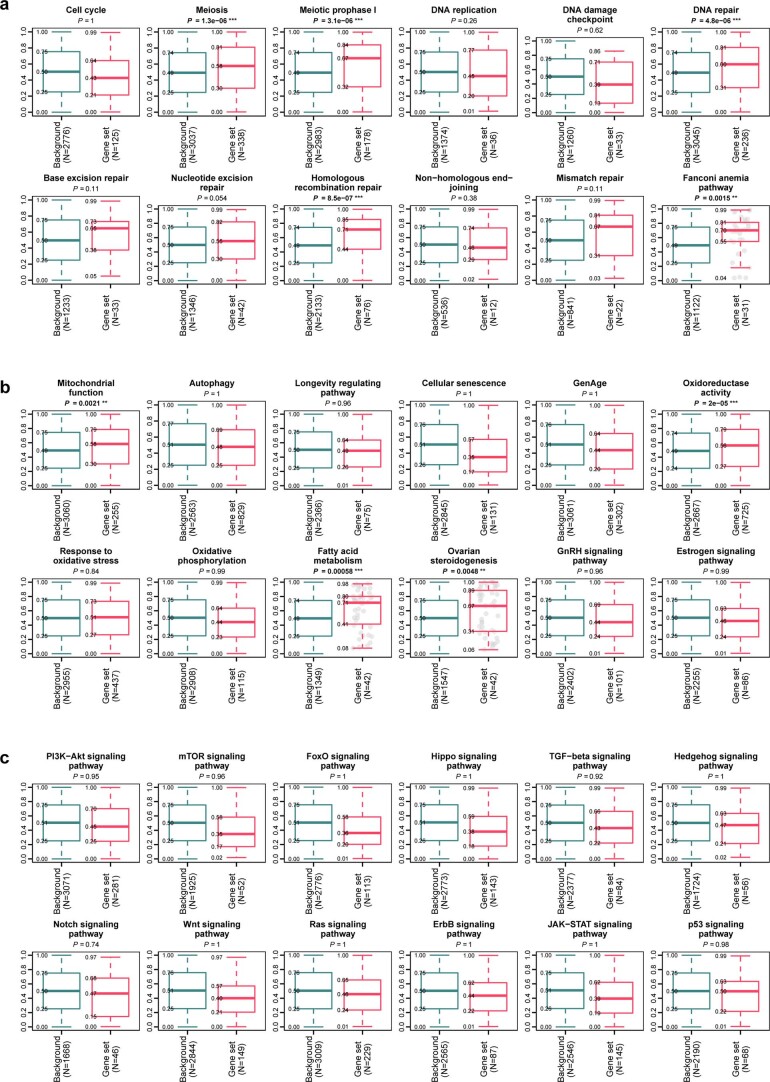
Premature ovarian insufficiency (POI) is a major cause of female infertility due to early loss of ovarian function. POI is a heterogeneous condition, and its molecular etiology is unclear. To identify genetic variants associated with POI, here we performed whole-exome sequencing in a cohort of 1,030 patients with POI. We detected 195 pathogenic/likely pathogenic variants in 59 known POI-causative genes, accounting for 193 (18.7%) cases. Association analyses comparing the POI cohort with a control cohort of 5,000 individuals without POI identified 20 further POI-associated genes with a significantly higher burden of loss-of-function variants. Functional annotations of these novel 20 genes indicated their involvement in ovarian development and function, including gonadogenesis (LGR4 and PRDM1), meiosis (CPEB1, KASH5, MCMDC2, MEIOSIN, NUP43, RFWD3, SHOC1, SLX4 and STRA8) and folliculogenesis and ovulation (ALOX12, BMP6, H1-8, HMMR, HSD17B1, MST1R, PPM1B, ZAR1 and ZP3). Cumulatively, pathogenic and likely pathogenic variants in known POI-causative and novel POI-associated genes contributed to 242 (23.5%) cases. Further genotype-phenotype correlation analyses indicated that genetic contribution was higher in cases with primary amenorrhea compared to that in cases with secondary amenorrhea. This study expands understanding of the genetic landscape underlying POI and presents insights that have the potential to improve the utility of diagnostic genetic screenings.


Conflict of interest statement

The authors declare no competing interests.

Figures

Fig. 1
Fig. 1. Flow chart for selecting the idiopathic POI cohort potentially attributable to genetic defects.
A total of 1,790 patients with POI were recruited for the initial assessment, during which serum tests, pelvic ultrasounds and medical records were assessed for each participant. WES was performed in 1,030 patients who met inclusion criteria. *The inclusion criteria were based on 2016 ESHRE guidelines for POI. E2, estrogen.
Fig. 2
Fig. 2. Overview of P/LP variants identified in known POI genes.
a, Allele counts of P/LP variants detected in 59 of 95 known POI genes, including both novel and reported variants. Previously reported variants are those identified to be damaging according to ClinVar or published studies. b, Contribution yield of known POI-causative genes in 1,030 patients. c, The proportion of each mode of inheritance in the 193 patients carrying P/LP variants in known POI genes. d, The proportional contribution of each gene among 193 cases. e, The proportion of patients classified according to annotated function of the affected genes. ‘Oogenesis’ indicates genes involved in meiotic prophase I and HR. ‘Others’ indicates genes involved in the regulation of energy, metabolism and autoimmunity. ‘Multi-function’ refers to mutations in genes implicated in multiple pathways. f, The contribution rate of mode of inheritance in patients with PA and SA. g, The prevalences of P/LP variants in cases with PA and SA are shown for 15 genes detected in more than five cases.
Fig. 3
Fig. 3. Discovery of novel causative genes through large case–control association analysis of POI.
a, LoF variants in 32 genes were enriched in cases with POI when compared with controls (cases n = 1,030; controls n = 5,000). Genes with FDR < 0.3 are shown. The upper graph shows P values for difference in the prevalence of LoF variants between cases and control individuals generated by one-sided Fisher’s exact tests; middle graph shows FDR; lower graph displays the allele frequency of LoF variants in each gene. b, Overview of 20 novel genes with LoF variants significantly enriched in POI. The upper graph is a schematic representation of the ovary development process, categorized into four stages: gonadogenesis, oogenesis, folliculogenesis and oocyte maturation and ovulation. The lower graph depicts the physiological roles and molecular mechanisms throughout ovary development of 20 significantly enriched genes. LGR4 and PRDM1 are involved in gonadogenesis; KASH5, CPEB1, MCMDC2, MEIOSIN, NUP43, RFWD3, SHOC1, SLX4 and STRA8 are involved in various meiotic processes; and ALOX12, BMP6, CPEB1, H1-8, HMMR, HSD17B1, MST1R, PPM1B, ZAR1 and ZP3 are involved in follicle development, oocyte maturation and ovulation. Genes may be engaged in multiple processes.
Fig. 4
Fig. 4. Experimental validation of LoF variants identified in PRDM1, STRA8 and MCMDC2.
a, Map of LoF variant locations relative to essential functional domains in PRDM1. b, Western blots of transiently expressed WT, p.Gly11Valfs*14, p.Tyr622* and p.Leu776Valfs*19 mutants of GFP-tagged PRDM1 in HEK293 cells. Data are representative of two independent experiments. c, Representative fluorescence microscopy images of transiently expressed WT, p.Gly11Valfs*14 and p.Tyr622* mutants of GFP-tagged PRDM1 in HeLa cells. Data are representative of three independent experiments. d, Top: western blots of WT, p.Tyr622* and p.Leu776Valfs*19 mutants of GFP-tagged PRDM1 at 0 hours, 4 hours, 8 hours and 12 hours in HEK293 cells from CHX chase assays. Bottom: quantification of PRDM1 protein levels normalized to β-actin. e, Map of c.258 + 1 G > A location relative to essential functional domain in STRA8. f, Schematic representation of mini-gene assay strategy and splicing mode of STRA8-WT and c.258 + 1 G > A. g, Agarose gel electrophoresis and Sanger sequencing chromatograms of cDNA after transfection of STRA8-WT or c.258 + 1 G > A into HeLa and 293T cells. Data are representative of two independent experiments in two cell lines. h, Representative fluorescence images of transiently expressed WT and p.Leu21_Lys86del (c.258 + 1 G > A) mutant of FLAG-tagged STRA8 in HeLa cells. Data are representative of three independent experiments. i, Map of LoF variant locations relative to essential functional domains in MCMDC2. j, Schematic diagram illustrating the principles of HR assays (Methods). k, Left: representative flow cytometry profiles measuring the proportion of cells with DNA repair by HR (GFP+ cells) after transfection with WT, p.Ala69Leufs*18 and p.Gln229* mutants of MCMDC2 among HEK293 cells with a GFP-based I-SceI-cleavable reporter. d,k, Representative data from n = 3 biological replicates. Data are shown as means ± s.e.m. Two-sided t-test was used to determine significance. The asterisk refers to P < 0.05 compared with WT. SET, SET domain; ZNF_C2H2, zinc fingers, C2H2 type; HLH, helix-loop-helix DNA-binding domain; MCM, MCM P-loop containing nucleoside triphosphate hydrolase domain; AAA-lid, AAA-lid domain found in MCM proteins. Source data
Fig. 5
Fig. 5. Landscape of P/LP variants identified in known causative genes and novel POI-associated genes.
a, Contributions of each step, based on varying degrees of evidence, in the analytical pipeline in identifying P/LP variant in 1,030 patients with POI. In total, 193 patients had P/LP variants in known genes, and an additional 49 patients had P/LP variants in novel causative genes. b, Integrated matrix of P/LP variants and the 242 patients with detected variants. Rows are genes grouped by ovarian development stages, and columns are patients with POI. The upper panels show patient mutation load, phenotype information and mode of inheritance (MOI). The left panel shows the number of patients carrying P/LP variants in each gene. The right panels show the pLI, Mis-Z and raw P values of genes using one-sided Fisher’s exact tests.
Extended Data Fig. 1
Extended Data Fig. 1. Graphical abstract.
Summary of the WES analysis approach and findings. Abbreviations: SDUIVF, Hospital for Reproductive Medicine Affiliated to Shandong University.
Extended Data Fig. 2
Extended Data Fig. 2. Experiment validation of variants with uncertain significance in seven genes.
Variants with uncertain significance (VUS) identified in BLM, HFM1, MCM8, MCM9, MSH4, and RECQL4 were verified through homologous recombination (HR) reporter system. Variants identified in NR5A1 were verified through luciferase assay. The relative HR repair efficiency or transcriptional activity of wild-type (WT, blue column) and mutant (light blue column) proteins were compared with the mock group (cells transfected with pcDNA3.1 or pENTER vector, dark blue column) using two-sided Student’s t-test. Three independent experiments were conducted. Error bars indicate s.e.m. The numbers indicate P values. *P-value < 0.05. **P-value<0.01. ***P-value<0.001.n.s, not statistically significant. Source data
Extended Data Fig. 3
Extended Data Fig. 3. Phasing results of two P/LP variants in the same patient via IGV visualization and TA cloning sequencing.
a, IGV visualization of mapped reads containing c.877 G > A and c.910 G > A detected in NR5A1 in case POI-572. The two P/LP variants located in different reads and were confirmed to be in trans. b, TA clone sequencing results of c.452 T > C and c.2611dup detected in AARS2 in case POI-506. The two P/LP variants located in different clones and were confirmed to be in trans. c, TA cloning sequencing results of c.2404 G > T and c.2554_2559dup detected in RECQL4 in case POI-910. The two P/LP variants located in different clones and were confirmed to be in trans. d, TA cloning sequencing results of c.452 T > C and c.2005C > T detected in AARS2 in case POI-991. The two P/LP variants located in different clones and were confirmed to be in trans. e, TA cloning sequencing results of c.254 T > A and c.818 A > G detected in EIF2B2 in case POI-1151. The two P/LP variants located in different clones and were confirmed to be in trans. f, TA cloning sequencing results of c.270_297dup and c.1108 C > T detected in ZAR1 in case POI-1660. The two P/LP variants located in different clones and were confirmed to be in trans.
Extended Data Fig. 4
Extended Data Fig. 4. Phasing results of two P/LP variants in ultra long distance via 10×Genomics.
a, Haplotype browser of c.842 G > A and c.1198 G > A detected in NR5A1 in case POI-169. HAPLOTYPE 1 and HAPLOTYPE 2 are displayed as two separate tracks for multiple variations. The small icons represent SNPs (solid blue circles), small insertions (solid green triangles) and deletions (solid yellow rectangles). The GENES track displays annotated reference genes and the direction of each gene is indicated with arrows. Each vertical green bar in the COVERAGE track shows the average coverage-per-base for the area of the genome under the bar. The two variants were phased to different haplotype tracks and confirmed to be in trans. b, Haplotype browser of c.1792G > C and c.3784 G > A detected in HFM1 in case POI-516. The two variants were phased to different haplotype tracks and confirmed to be in trans. c, Haplotype browser of c.398 C > G and c.1306 A > G detected in MCM9 in case POI-841. The two variants were phased to the same haplotype track and confirmed to be in cis. d, Haplotype browser of c.322 G > T and c.1151-1 G > A detected in MCM9 in case POI-1228. The two variants were phased to different haplotype tracks and confirmed to be in trans. e, Haplotype browser of c.1094 T > A and c.1345 T > G detected in MSH4 in case POI-1453. The two variants were phased to different haplotype tracks and confirmed to be in trans.
Extended Data Fig. 5
Extended Data Fig. 5. Overview of mutations identified in known POI genes.
a, Distribution of pathogenic (P), likely pathogenic (LP), uncertain significance (VUS), likely benign (LB) and benign (B) variants across genes among all rare variants detected in known POI genes. b, Distribution of LoF, missense and other types (including in-frame indels and splice region) of all detected variants across genes. c, Distribution of LoF, missense and other types of P/LP variants across genes.
Extended Data Fig. 6
Extended Data Fig. 6. Association analyses of synonymous variants.
a, Rates of gene with rare synonymous qualifying variants in 703 POI candidate genes. The upper panel shows the distribution of tally of genes carrying at least a rare synonymous qualifying variant among all tested genes when comparing the POI case cohort (red distribution, n = 1,030) to the control cohort (blue distribution, n = 5,000). We found no statistically significant difference between case and control contribution (two-sided Wilcoxon rank sum test, P = 0.49). The lower panel shows mean (points) and SD (bars) of qualifying genes of the case cohort (red) and the control cohort (blue). b, The quantile-quantile plot of the expected versus observed P values comparing the burden of synonymous variants in 703 genes (two-sided Fisher’s exact test). There is no significant inflation between the case and control cohort.
Extended Data Fig. 7
Extended Data Fig. 7. Association analyses of rare coding variants between cases with POI and in-house controls.
The quantile-quantile plot comparing observed versus expected P values for each rare coding variants in 703 genes (cases n = 1,030, controls n = 5,000, one-sided Fisher’s exact test). The dashed line represents the Bonferroni-corrected P <0.05 threshold. EIF2B2 p.Val85Glu is the only variant that significantly associated with POI.
Extended Data Fig. 8
Extended Data Fig. 8. Association analysis for damaging missense variants between POI and controls.
a, P value for the difference in the burden of damaging missense variants evaluated by different algorithms in individual genes (one-sided Fisher’s exact test). The top 20 genes are shown. b, Venn diagrams showing the intersection of significantly enriched genes classified according to different D-mis criteria. c, The number of D-mis criteria that each gene met.
Extended Data Fig. 9
Extended Data Fig. 9. Locations of LoF variants and their affected domains in the proteins encoded by 17 novel significantly enriched genes.
Variants in relation to critical functional domain or motifs are depicted. Different types of variants are shown as solid circles and distinguished by color. The x axis represents the number of amino acid residues and the y axis represents the number of variants. Abbreviations of protein domains: BTB, Broad-Complex, Tramtrack and Bric a brac; CC, Coiled-coil domain; CS, Cleavage site; GPCR_7TM, GPCR, rhodopsin-like, 7 transmembrane domain; HhH2, Helix-harpin-helix DNA-binding domain; HLH, Helix-loop-helix DNA-binding domain; HMG, High-mobility group domain; LipOase, Lipoxygenase domain; LR, Luminal region; LRR, Leucine-rich repeat domain; PALT, Polycystin-1, Lipoxygenase, Alpha-Toxin domain; PP2C, Protein serine/threonine phosphatase 2C, catalytic domain; Ring, Ring finger domain; RRM, RNA recognition motifs; RTKs, Receptor tyrosine kinase domain; SDR, Short-chain dehydrogenase/reductase; SP, Signal peptide; TGFb: Transforming growth factor beta like domain; TIG: Immunoglobulin-like fold domain; TM, Transmembrane domain; WD40, WD40-repeat-containing domain; XPF, XPF-like central domain; Znf_3CxxC, Zinc fingers, 3CxxC-type; ZPD, Zona pellucida domain.
Extended Data Fig. 10
Extended Data Fig. 10. Gene set analysis.
Gene-level associations of rare LoF variants between 1,030 cases with POI and 5,000 in-house control individuals are calculated from one-sided Fisher’s exact test, and then we used one-sided Wilcoxon rank sum test between each gene set and comparison set to conduct gene set analysis and generate set-level P values. * P < 0.05, ** P < 0.01, *** P < 0.001. The ordinate shows rank percentiles (1 = highest, 0 = lowest) for gene-level associations within background genes and those genes linked to each gene set. Labels indicate minimum, 25th percentile, median, 75th percentile and maximum. N in x-axis represents the number of genes used in association tests. a, Gene sets regarding cellular process, DNA replication and DNA repair. b, Gene sets regarding metabolism, aging and endocrinology. c, Gene sets regarding signal transduction.

Comment in

References

    1. Welt CK. Primary ovarian insufficiency: a more accurate term for premature ovarian failure. Clin. Endocrinol. 2008;68:499–509. doi: 10.1111/j.1365-2265.2007.03073.x. - DOI - PubMed
    1. Nelson LM. Clinical practice. Primary ovarian insufficiency. N. Engl. J. Med. 2009;360:606–614. doi: 10.1056/NEJMcp0808697. - DOI - PMC - PubMed
    1. Golezar S, Ramezani Tehrani F, Khazaei S, Ebadi A, Keshavarz Z. The global prevalence of primary ovarian insufficiency and early menopause: a meta-analysis. Climacteric. 2019;22:403–411. doi: 10.1080/13697137.2019.1574738. - DOI - PubMed
    1. De Vos M, Devroey P, Fauser BCJM. Primary ovarian insufficiency. Lancet. 2010;376:911–921. doi: 10.1016/S0140-6736(10)60355-8. - DOI - PubMed
    1. Qin Y, Jiao X, Simpson JL, Chen ZJ. Genetics of primary ovarian insufficiency: new developments and opportunities. Hum. Reprod. Update. 2015;21:787–808. doi: 10.1093/humupd/dmv036. - DOI - PMC - PubMed

Publication types

Substances