. 2023 Feb;4(2):181-202.
doi: 10.1038/s43018-022-00510-x. Epub 2023 Feb 2.

Integrative multi-omics networks identify PKCδ and DNA-PK as master kinases of glioblastoma subtypes and guide targeted cancer therapy

Affiliations

Integrative multi-omics networks identify PKCδ and DNA-PK as master kinases of glioblastoma subtypes and guide targeted cancer therapy

Simona Migliozzi et al. Nat Cancer. 2023 Feb.

Abstract

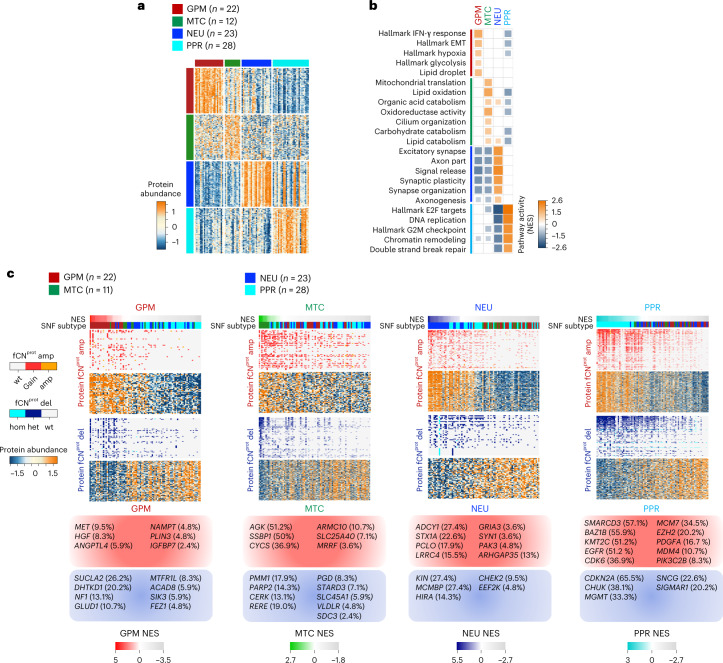
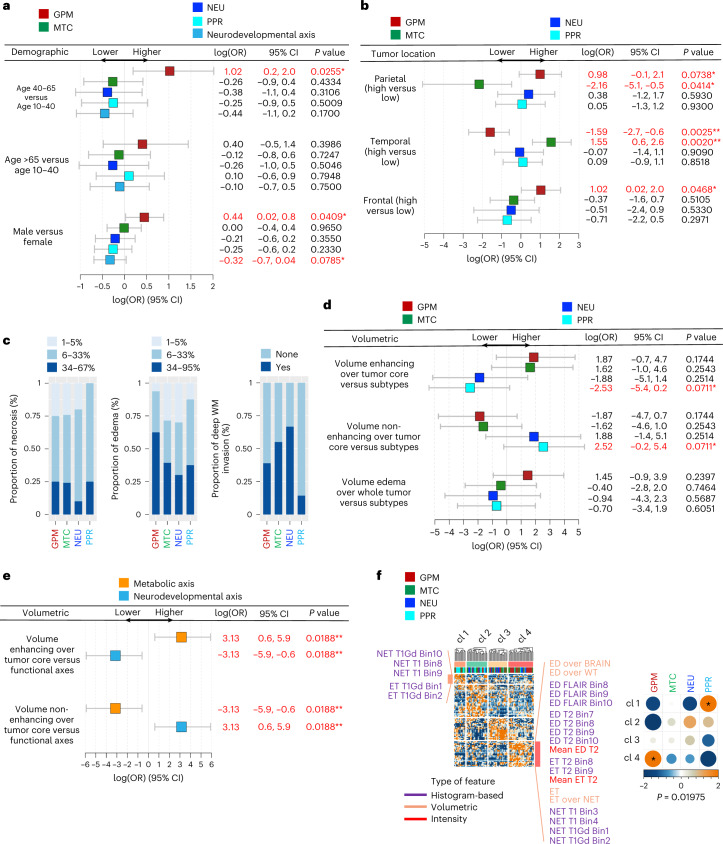
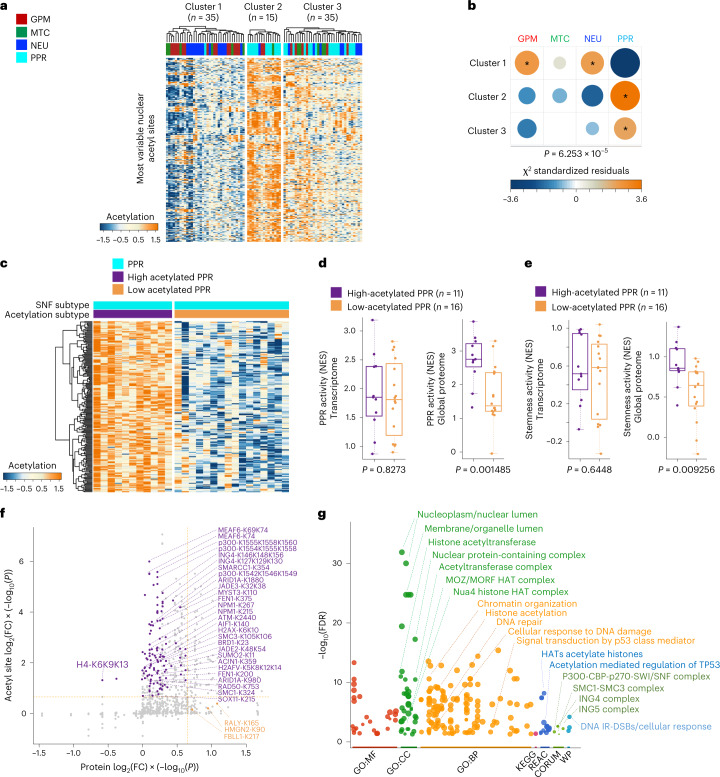
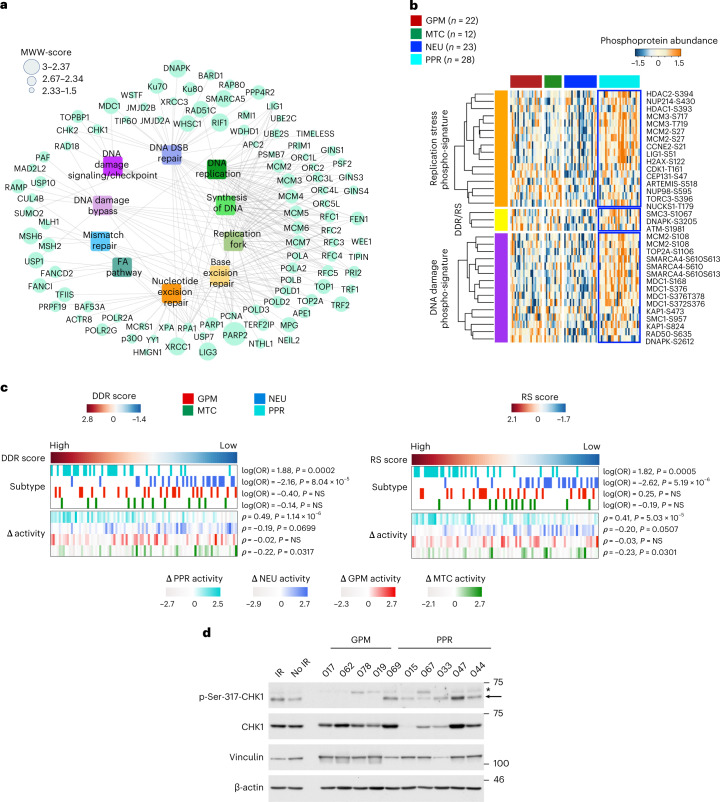
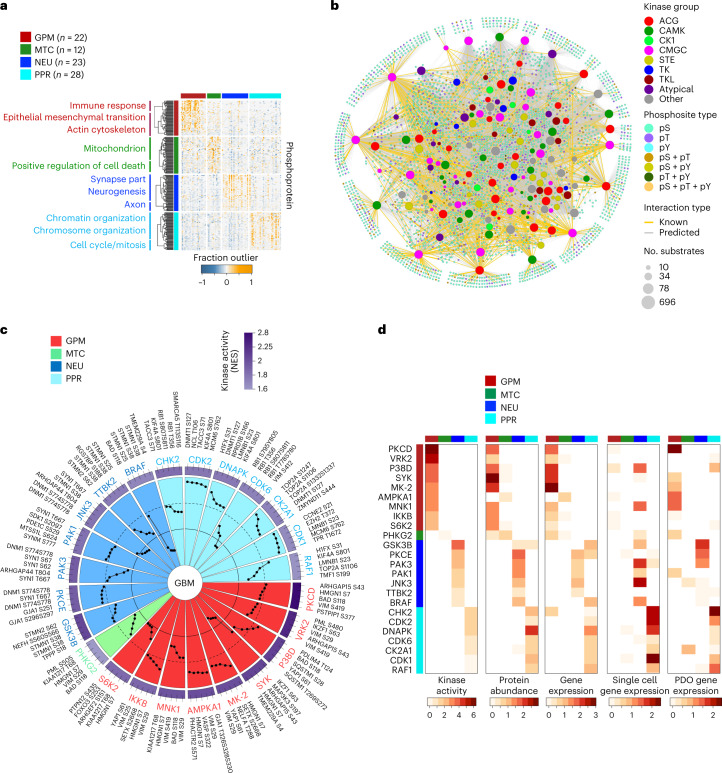
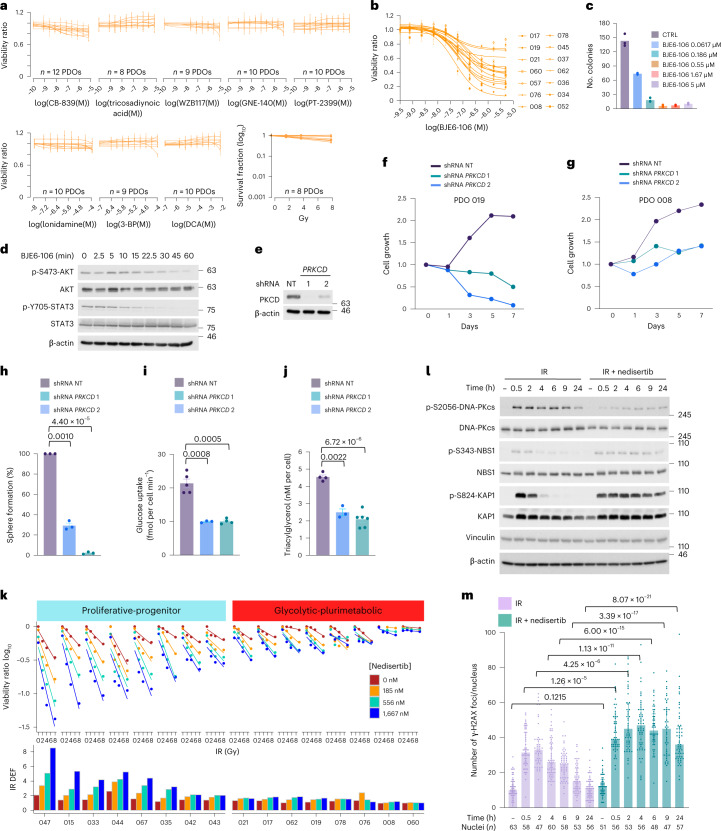
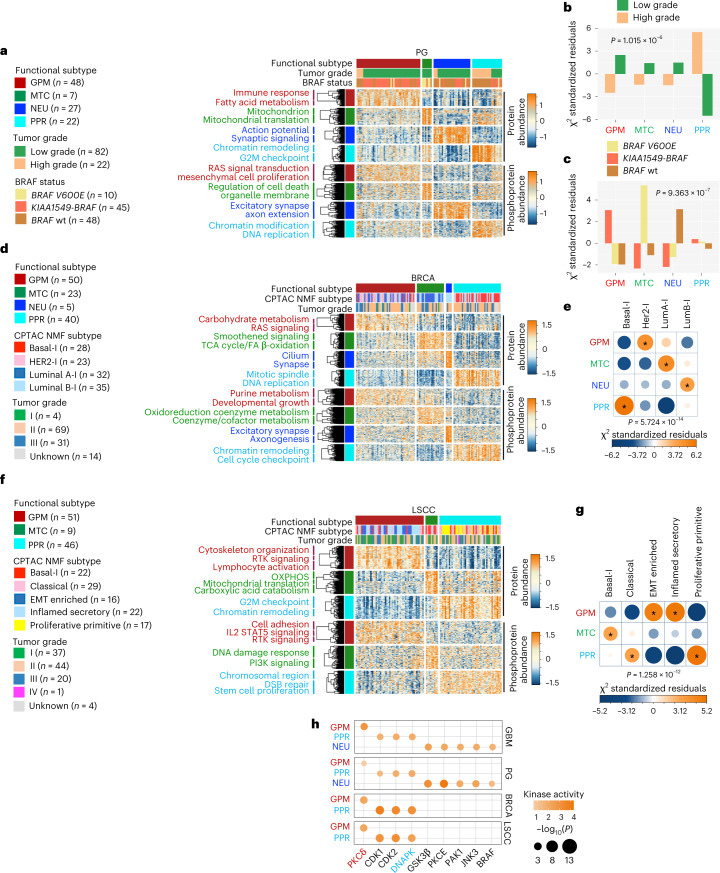
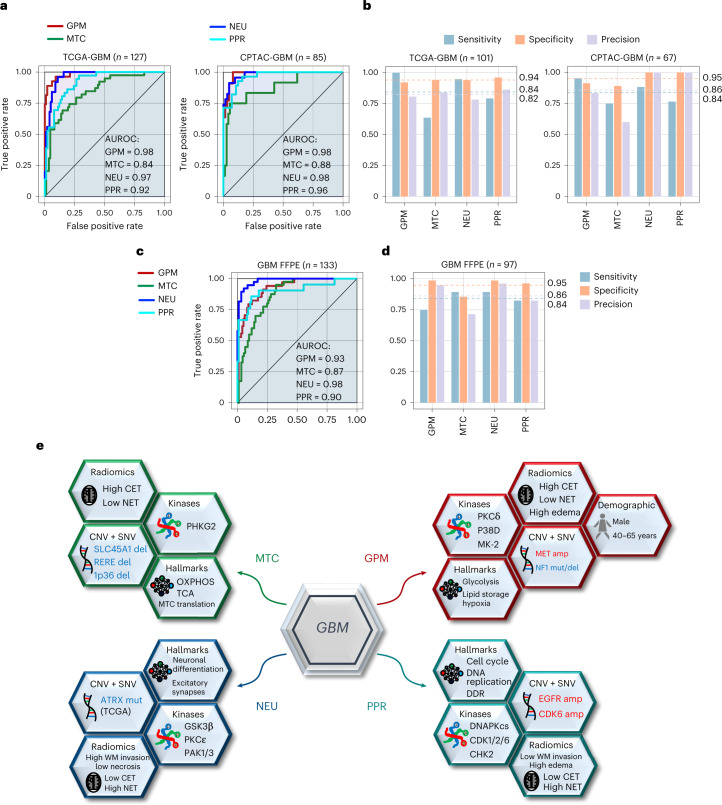
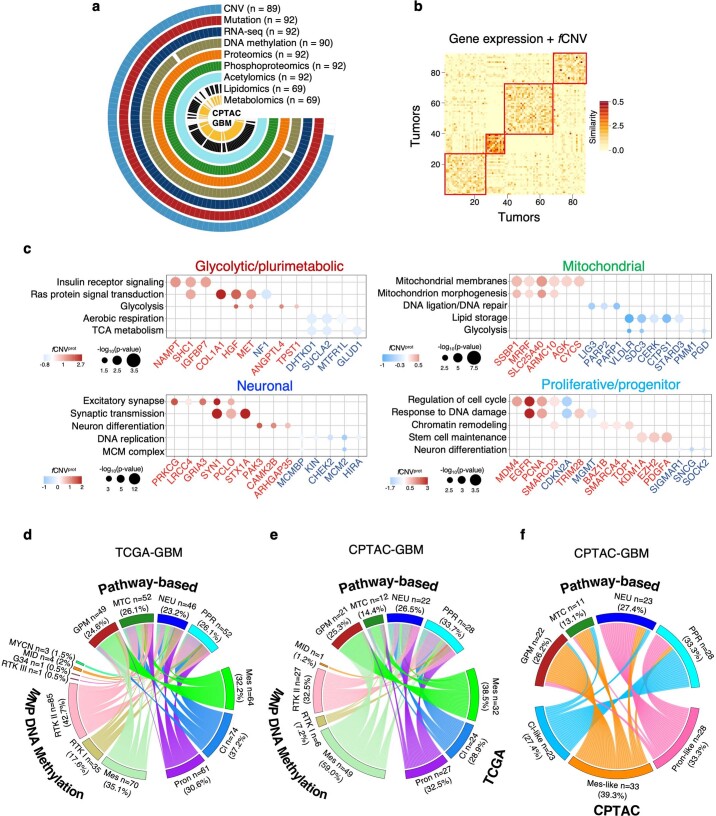
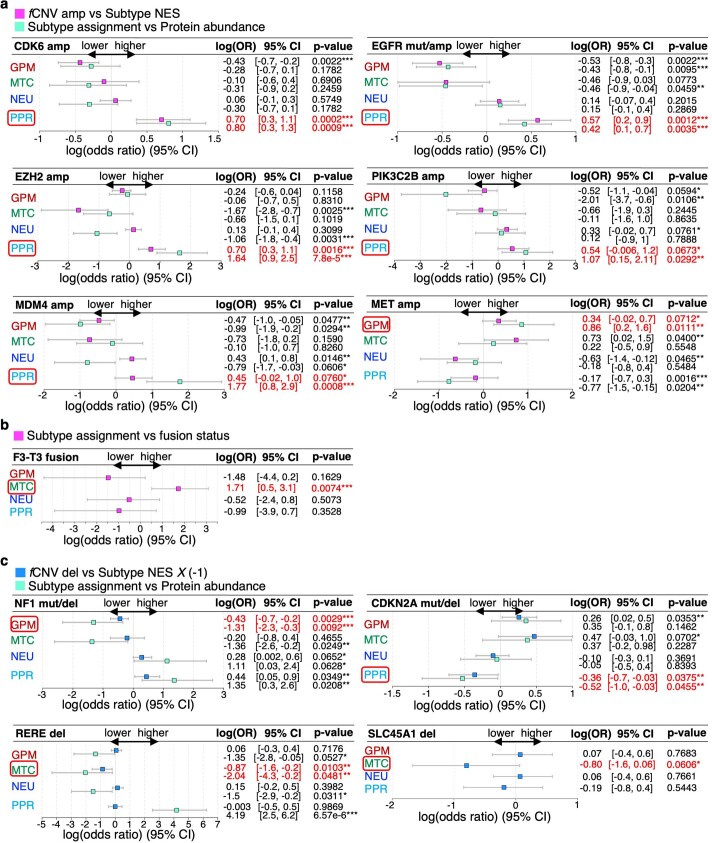
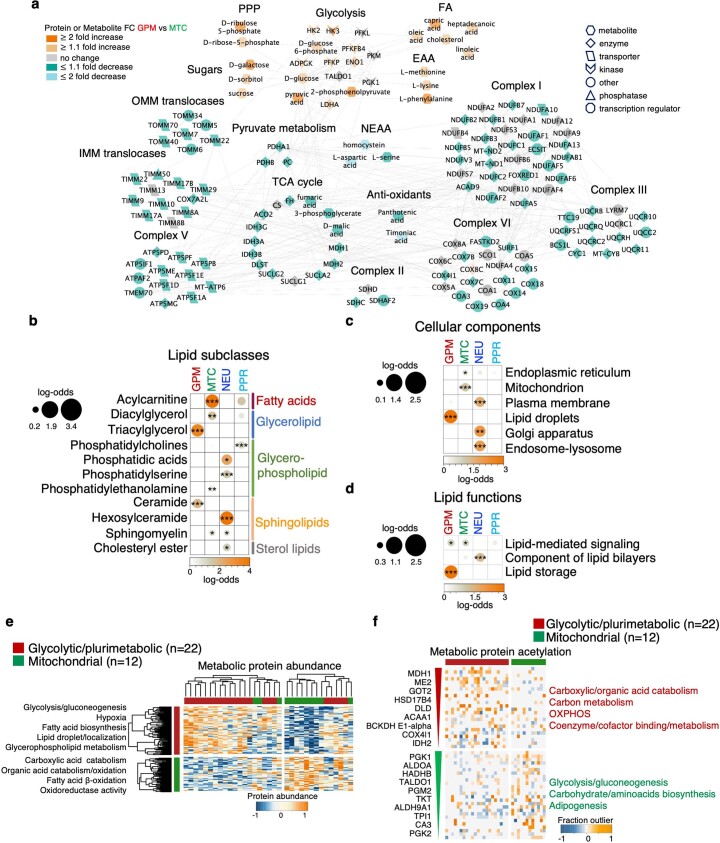
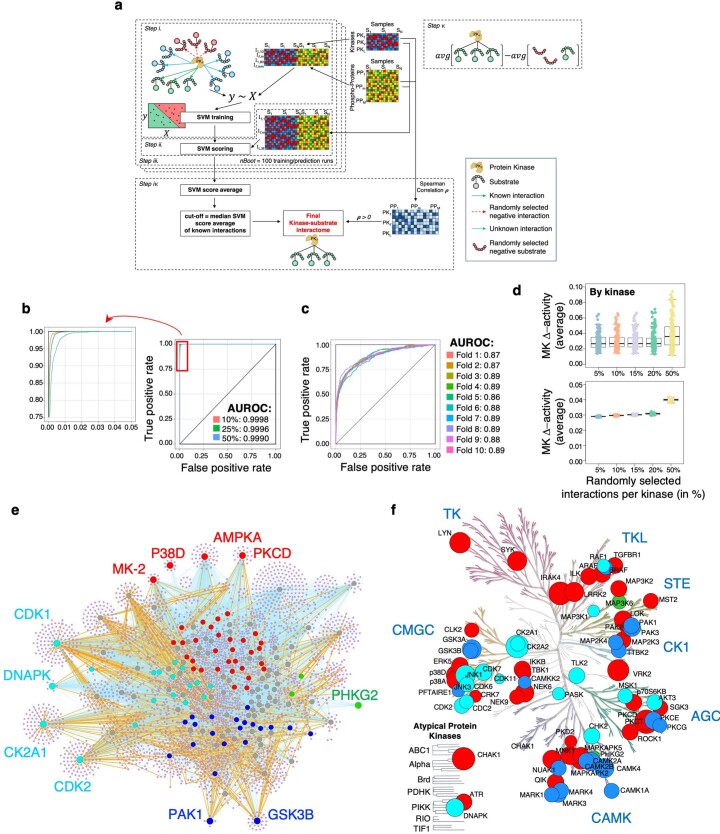
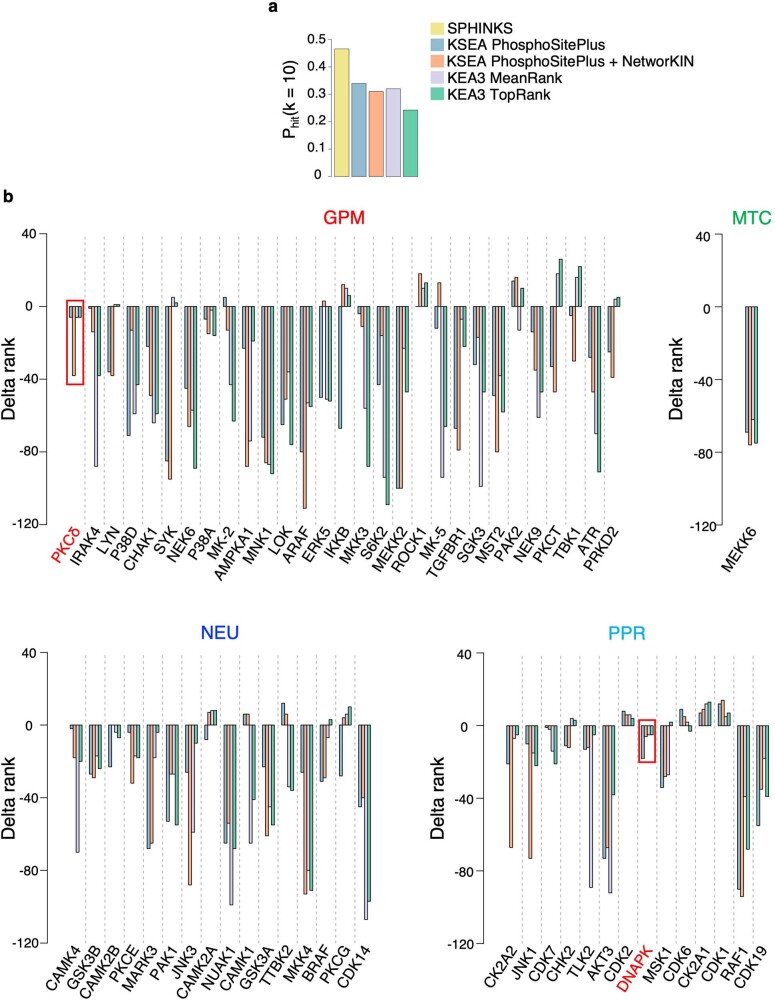
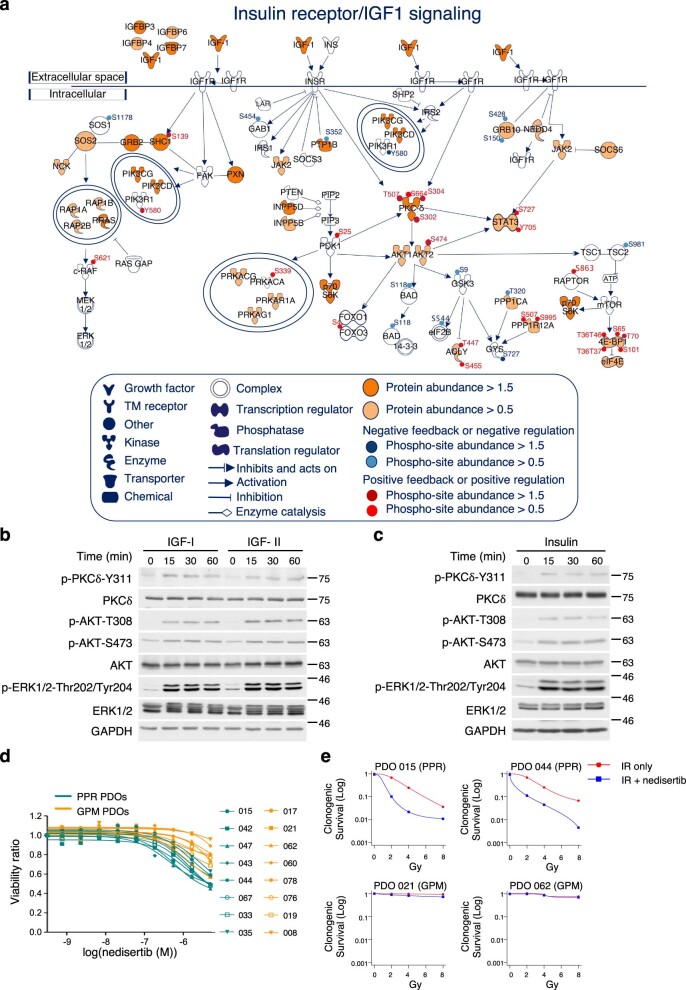
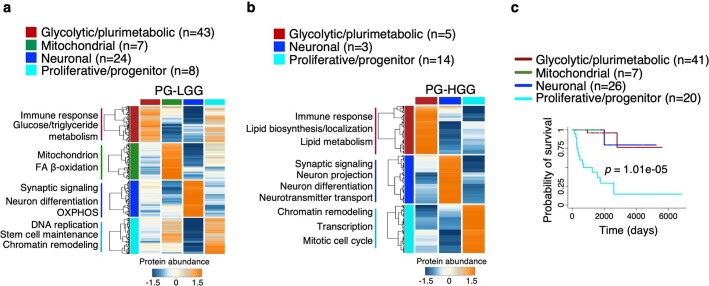
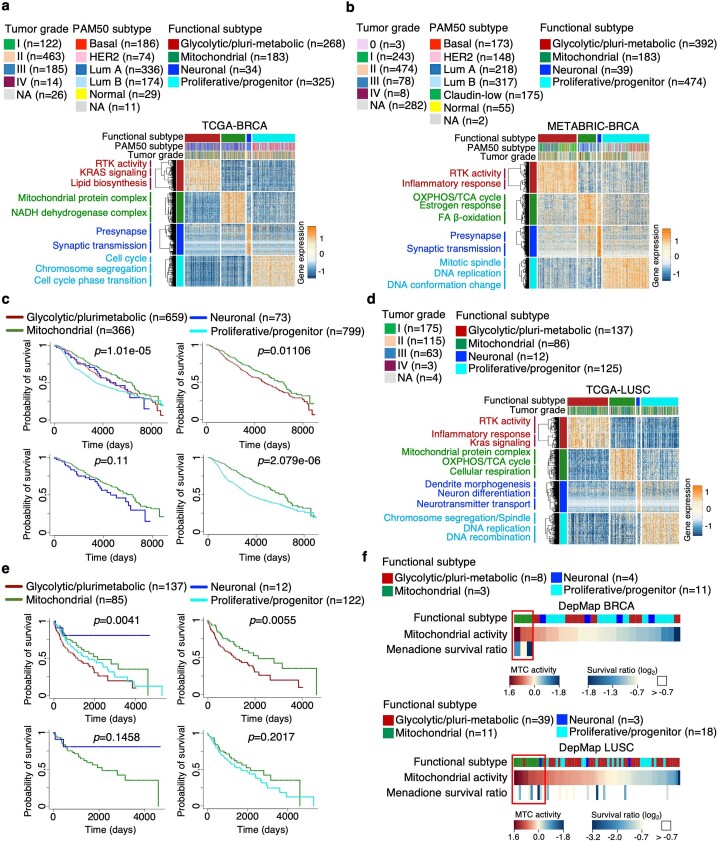
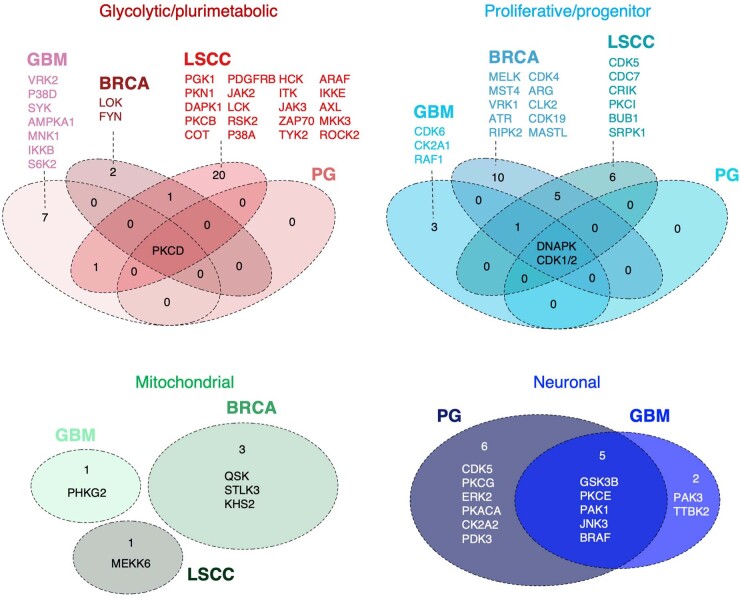
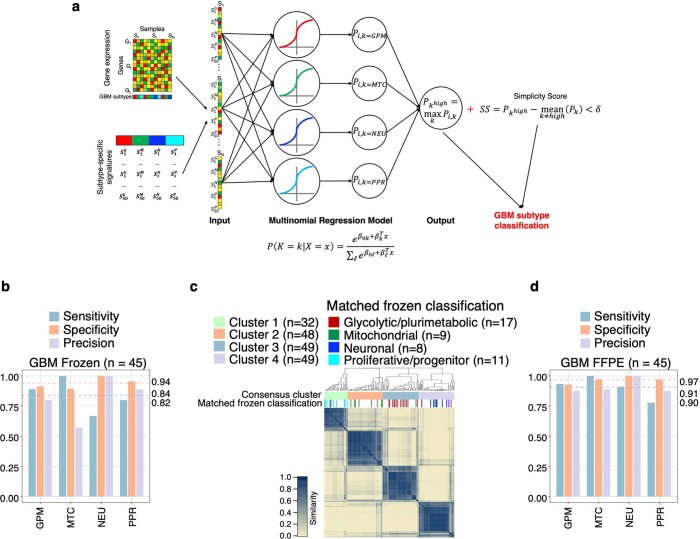
Despite producing a panoply of potential cancer-specific targets, the proteogenomic characterization of human tumors has yet to demonstrate value for precision cancer medicine. Integrative multi-omics using a machine-learning network identified master kinases responsible for effecting phenotypic hallmarks of functional glioblastoma subtypes. In subtype-matched patient-derived models, we validated PKCδ and DNA-PK as master kinases of glycolytic/plurimetabolic and proliferative/progenitor subtypes, respectively, and qualified the kinases as potent and actionable glioblastoma subtype-specific therapeutic targets. Glioblastoma subtypes were associated with clinical and radiomics features, orthogonally validated by proteomics, phospho-proteomics, metabolomics, lipidomics and acetylomics analyses, and recapitulated in pediatric glioma, breast and lung squamous cell carcinoma, including subtype specificity of PKCδ and DNA-PK activity. We developed a probabilistic classification tool that performs optimally with RNA from frozen and paraffin-embedded tissues, which can be used to evaluate the association of therapeutic response with glioblastoma subtypes and to inform patient selection in prospective clinical trials.


Conflict of interest statement

A.L. and A.I. are inventors of a biomarker technology that has been licensed to QIAGEN. A.I. received sponsored research funding from AstraZeneca and Taiho Pharmaceutical and has served as a paid consultant/advisor to AIMEDBIO. A.L. received sponsored research funding from Celgene. A.L. and A.I. are inventors of a patent application based on this work. All other authors declare no competing interests.

Figures

Fig. 1
Fig. 1. Proteogenomic interpretation of GBM functional subtypes.
a, Heat map showing the 150 highest scoring proteins in the ranked lists of GPM, MTC, NEU and PPR GBM subtypes (two-sided MWW test). Rows indicate proteins and columns indicate tumors (n = 85 GBM samples). Color tracks indicate GBM subtypes (left and top). b, Grid plot showing NES of the highest active, non-redundant biological pathways for each GBM subtype (logit(NES) > 0.58, FDR < 0.005; two-sided MWW-GST). The number of GBM samples is as in a. IFN, interferon. c, Integrative heat map showing CNVs (top) and protein abundance (bottom) of genes with fCNVprot gain (amp) or loss (del) (two-sided MWW test). Gains/amplifications are indicated in red; loss/deletions are in blue. In each panel, tumors are ordered from left to right according to highest to lowest subtype activity NES (top track); bottom track indicates tumor classification. The number (n) of GBM samples for each subtype is indicated. For each subtype, representative genes with the highest frequency of fCNVprot gain (red squares) or loss (blue squares) are listed. wt, wild type; NES, normalized enrichment score; FDR, false discovery rate; GST, gene set test.
Fig. 2
Fig. 2. Association between demographic, imaging-based features and functional subtypes.
a, Forest plots of age and sex association with GBM functional subtypes or the aggregated of PPR and NEU in the TCGA dataset (n = 503 GBM samples; univariate logistic regression). log(OR) estimates, 95% confidence intervals (CI) and P values are reported (*: P < 0.10; **: P < 0.05). OR, odds ratio. log(OR) estimates higher/lower than 0 represent positive/negative association. b, Forest plots of the association between tumor location and GBM functional subtypes in the TCGA dataset (n = 88 GBM samples; univariate logistic regression). log(OR) estimates, 95% CI and P values are reported. c, Bar plots showing the proportion of necrosis and edema in functional subtypes of GBM from the TCGA cohort (n = 63 GBM samples) and deep white matter (WM) invasion from TCGA (n = 40 GBM samples) and REMBRANDT (n = 14 GBM samples) datasets. d, Forest plots of the association between contrast-enhancing, non-contrast-enhancing tumor or edema and GBM functional subtypes in the TCGA dataset (n = 88 GBM samples; univariate logistic regression). log(OR) estimates, 95% CI and P values are reported. e, Forest plot of the association between contrast-enhancing or non-contrast-enhancing tumor and metabolic or neurodevelopmental GBM subtypes in the TCGA dataset (n = 88 GBM samples; univariate logistic regression). log(OR) estimates, 95% CI and P values are reported. f, Unsupervised clustering on 175 differential quantitative radiomic features in GBM subtypes (n = 88 GBM samples, left; two-sided MWW test). Top track shows clusters; bottom track shows tumor classification. Representative radiomic features for cluster 1 (enriched with PPR tumors) and cluster 4 (enriched with GPM tumors) are indicated. Association between radiomic clusters and GBM subtypes (right). Circles are color coded and their size reflects the standardized residuals (chi-squared test). Orange-to-blue scale indicates positive to negative enrichment. Asterisks indicates standardized residuals > 1.5.
Fig. 3
Fig. 3. Protein acetylation defines distinct PPR subpopulations.
a, Heat map showing unsupervised clustering of GBM tumors using the most variable nuclear protein acetyl sites (n = 320 acetyl sites). The number (n) of GBM samples for each cluster is indicated. b, Association between acetylation clusters and functional subtypes of GBM. Circles are color coded and their size reflects the standardized residuals (chi-squared test). Orange-to-blue scale indicates positive to negative enrichment. Asterisks indicate standardized residuals > 2. The number (n) of GBM samples is as in a. c, Heat map showing unsupervised clustering of differential acetylated nuclear proteins in PPR tumors with high (n = 11 PPR GBM samples in cluster 2 of a) and low (n = 16 PPR GBM samples in cluster 3 of a) acetylation of nuclear proteins (log2(FC) > 0.3, P < 0.001; two-sided MWW test). d, Box plots of PPR activity calculated from the transcriptome (left) or global proteome (right) in PPR GBM with low and high acetylation (two-sided MWW test). Box plots span the first to third quartiles and whiskers show 1.5× interquartile range. The number (n) of PPR GBM samples with low and high acetylation is indicated. e, Box plots of stemness activity calculated from transcriptome (left) or global proteome (right) in PPR GBM with low and high acetylation (two-sided MWW test). Box plots span the first to third quartiles and whiskers show 1.5× interquartile range. The number (n) of PPR GBM samples with low and high acetylation is indicated. f, Starburst plot integrating global protein and acetyl site abundance of high- (n = 11 PPR GBM samples) versus low-acetylated PPR GBM (n = 16 PPR GBM samples; two-sided MWW test). The x axis indicates protein log2(FC) multiplied by −log10(P). The y axis indicates acetyl site log2(FC) multiplied by −log10(P). The horizontal and vertical lines denote the cutoff of log2(FC) = 0.5 multiplied by −log10(P = 0.05). g, Gene Ontology overrepresentation analysis of acetylated proteins in f using gProfiler (FDR < 0.05). The number (n) of PPR GBM samples with low and high acetylation is as in f. FC, fold change.
Fig. 4
Fig. 4. GBM of the PPR subtype exhibits phospho-programs of DDR activity and replication stress and distinct sensitivity to DDR inhibition.
a, DDR signaling network including the most enriched pathways and the highest abundant proteins in PPR GBM (MWW score > 1.5) compared to the other subtypes (logit(NES) > 1, P < 0.001, two-sided MWW-GST, n = 85 GBM samples). FA, Fanconi anemia. b, Heat map showing the phospho-protein abundance of biologically validated phosphorylation sites upregulated by irradiation-induced DDR and aphidicolin-induced DNA RS. The number (n) of GBM samples for each subtype is indicated. c, DDR (left) and RS-induced (right) signature score of GBM classified according to four functional subtypes. Top track, left to right represents tumors ranked by the highest to the lowest DDR or RS score. Heat map showing tumor subtype assignment (Fisher’s exact test) (top). Each row represents a functional subtype. Heat map showing for each tumor the difference between subtype-specific proteomic and transcriptomic activity (Spearman’s correlation) (bottom). Each row represents a subtype-specific activity. White to red, GPM; green, MTC; blue, NEU; cyan, PPR. Subtype-specific color scale indicates lowest to highest Δ enrichment score for each subtype. The number (n) of GBM samples is as in b. d, Immunoblot of GPM PDOs (n = 4 PDOs, each derived from an independent patient) and PPR PDOs (n = 6 PDOs, each derived from an independent patient) analyzed using the indicated antibodies. Vinculin and β-actin are shown as loading control. * indicates nonspecific band. The experiment was repeated twice with similar results. NS, not significant. Source data
Fig. 5
Fig. 5. Protein phosphorylation-kinase networks by SPHINKS reveal subtype-specific master kinases and signaling.
a, Heat map depicting the 70 highest significant outlier phosphorylated proteins in each functional GBM subtype (P < 0.005; BlackSheep). Unsupervised clustering and biological pathways significantly enriched are presented on the left (P < 0.01; Fisher’s exact test). The number (n) of GBM samples for each subtype is indicated. b, Global kinase–substrate phosphosite interactome inferred by SPHINKS. Nodes represent kinases and substrate phosphosites and lines their interactions. Kinase families and phosphorylated amino acid residues are indicated by different colors. Node size of the kinases is proportional to the number of interacting phosphosites. Yellow interactions indicate substrate phosphosites reported in the PhosphoSitePlus database; gray interactions are inferred new interactions. The number (n) of GBM samples is as in a. c, Circular plot depicting the most active kinases in each GBM subtype compared to all other subtypes (effect size > 0.3, P < 0.01; two-sided MWW test) with the outermost circle representing the color scale of kinase activity. The five predicted kinase-regulated phosphorylation sites with the highest SPHINKS score are indicated by black dots with SPHINKS score within the dashed line, > 0.95; SPHINKS score between dashed and continuous line, 0.95–0.90; and SPHINKS score inside the continuous line, < 0.90. The number (n) of GBM samples is as in a. d, Heat maps showing kinase activity (NES), MWW protein abundance score and MWW gene expression score of SPHINKS MKs specific for each CPTAC-GBM subtype (two-sided MWW test, n = 85 GBM samples). Heat maps depicting MWW gene expression score of the same kinases in single GBM cells (n = 17,367 single glioma cells) and PDOs (n = 79 PDOs) signify the cancer cell intrinsic expression of the top-scoring kinases identified by SPHINKS. Only values of logit(NES) > 0.58 are shown.
Fig. 6
Fig. 6. Validation of dependency of GBM cells on specialized protein kinases.
a, Viability curves of PDOs, each derived from an independent patient. Each curve represents one independent PDO assayed for the indicated compound or IR. Data in each curve are mean ± s.d. of n = 3 or 6 technical replicates for compound treatment (Source Data Fig. 6) and n = 8 technical replicates for IR. Experiments were performed twice with similar results. b, Viability curves of GPM PDOs (n = 14 PDOs, each derived from an independent patient) treated with BJE6-106. Data in each curve are mean ± s.d. of n = 6 or 18 technical replicates for each PDO (Source Data Fig. 6). The experiment was repeated three times with similar results. c, Colony-forming assay using GPM PDO cells treated with BJE6-106. Data are the mean of n = 3 technical replicates from one representative experiment. Experiment was repeated twice with similar results. CTRL, control. d, Western blot of GPM PDO cells treated with 50 μM of BJE6-106. Experiment was repeated twice with similar results. e, Western blot of GPM PDO cells transduced with lentivirus expressing two independent shRNAs targeting PRKCD or non-targeting shRNA (NT). Experiment was repeated three times with similar results. f,g, Growth curves of two independent GPM PDOs, PDO 019 (f) and PDO 008 (g) transduced as in e. Data are mean of n = 5 (f) and n = 6 (g) technical replicates from one representative experiment. Experiments were repeated twice with similar results. h, Quantification of sphere-forming assay for GPM PDO cells (PDO 008) transduced as in e. Data are mean ± s.d. of n = 3 independent infections/biological replicates. i, Rate of glucose uptake in GPM PDO cells (PDO 019) transduced as in e. Data are mean ± s.d. of n = 6 for shRNA NT, n = 3 for shPRKCD 1 and n = 4 for shPRKCD 2 technical replicates from two independent infections/biological replicates. j, Concentration of triacylglycerol in GPM PDO cells (PDO 019) transduced as in e. Data are mean ± s.d. of n = 4 for shRNA NT, n = 3 for shPRKCD 1 and n = 6 for shPRKCD 2 technical replicates from two independent infections/biological replicates. k, Cell viability after IR minus or plus nedisertib of PPR PDOs (n = 8 PDOs, each derived from an independent patient) and GPM PDOs (n = 8 PDOs, each derived from an independent patient). Data in each curve are mean of n = 4 technical replicates. Experiment was repeated twice with similar results. l, Western blot of PPR PDO cells treated with IR (4 Gy) or IR plus nedisertib (556 nM). Experiment was repeated twice with similar results. m, Quantification of γ-H2AX foci per nucleus in PPR PDO cells (PDO 044) after treatment as in l; the number (n) of nuclei is indicated (Source Data Fig. 6). Data are mean ± s.e.m. In each quantitative experiment, significance was established by two-tailed t-test, unequal variance or the Mann–Whitney test for experiment in m. In western blots, vinculin and β-actin are shown as loading controls. Source data
Fig. 7
Fig. 7. Functional activities of GBM subgroups classify different cancer types and inform survival and master kinases.
a, Heat map showing the 150 highest scoring proteins (top) and phosphosites (bottom) of four functional subtypes of CPTAC-PG; rows show proteins/phosphosites and columns show tumors (n = 104 PG samples; two-sided MWW test). Left and top tracks indicate the functional subtypes; middle track indicates tumor grade; and bottom track indicates BRAF status. Unsupervised clustering of protein/phosphosite signatures and pathways significantly enriched are reported on the left (P < 0.05; Fisher’s exact test). b, Association of tumor grade with functional PG subtypes. Bars indicate standardized residuals (chi-squared test). The number (n) of PG samples is as in a. c, Association of BRAF status with functional subtypes of PG-LGG (n = 82 PG-LGG samples). Bars indicate standardized residuals (chi-squared test). d, Heat map showing the 150 highest scoring proteins (top) and phosphosites (bottom) of functional subtypes in CPTAC-BRCA (two-sided MWW test). Rows are proteins/phosphosites and columns are tumors (n = 118 BRCA samples). Left and top tracks indicate functional subtypes; middle track indicates NMF multi-omics classification of CPTAC-BRCA (I, inclusive); and bottom track indicates tumor grade. Unsupervised clustering of protein/phosphosites signatures and pathways significantly enriched are reported on the left (P < 0.05; Fisher’s exact test). e, Association of NMF-based BRCA with functional subtypes. Circles are color coded and their size reflects the standardized residuals (chi-squared test). Orange-to-blue scale indicates positive to negative enrichment. The number (n) of BRCA samples is as in d. f, Heat map showing the 150 highest scoring proteins (top) and phosphosites (bottom) of functional subtypes in CPTAC-LSCC (two-sided MWW test). Rows are proteins/phosphosites and columns are tumors (n = 106 LSCC samples). Left and top tracks indicate functional subtypes; middle track indicates the NMF multi-omics classification of CPTAC-LSCC; bottom track indicates tumor grade. Unsupervised clustering of protein/phosphosites signature and pathways significantly enriched are reported on the left (P < 0.05; Fisher’s exact test). g, Association of NMF-based LSCC with functional subtypes. Circles are color coded and their size reflects the standardized residuals (chi-squared test). Orange-to-blue scale indicates positive to negative enrichment. The number (n) of LSCC samples is as in f. h, Grid plot showing top-scoring MKs common to each functional GBM, PG, BRCA and LSCC subtype (GBM, n = 85 samples; PG, n = 104 samples; BRCA, n = 118 samples; LSCC, n = 106 samples). Dots are colored according to kinase activity and their size reflect the significance of the differential activity in each group (effect size > 0.3 and P < 0.01; two-sided MWW test). All asterisks in e,g indicate standardized residuals higher than 1.5.
Fig. 8
Fig. 8. Probabilistic classifier for the identification of functional tumor subtypes of IDH wild-type GBM and schematic multi-omics and clinical modules of functional subtypes of GBM.
a, GBM subtype-specific ROC curves for the multinomial regression model using RNA-seq data from frozen samples. Validation includes RNA-seq data from TCGA (left) or CPTAC (right) GBM samples. The number (n) of GBM samples for each dataset is indicated. b, Comparison bar plot of sensitivity, specificity and precision in each GBM subtype of the multinomial regression model as in a. Dashed lines and corresponding values indicate the average of each performance measure (blue, sensitivity; orange, specificity; purple, precision) in each GBM subgroup. The number (n) of GBM samples for each dataset is indicated. c, GBM subtype-specific ROC curves for the multinomial regression model using RNA-seq data from FFPE samples. Validation includes RNA-seq obtained from FFPE tumor samples. The number of GBM samples for each dataset (n) is indicated. d, Comparison bar plot of sensitivity, specificity and precision in each GBM subtype of the multinomial regression model as in c. Dashed lines and corresponding values indicate the average of each performance measure (blue, sensitivity; orange, specificity; purple, precision) in each GBM subgroup. The number (n) of GBM samples for each dataset is indicated. e, Functional activities, genetic alterations, MKs, clinical characteristics, radiomic features and therapeutic vulnerability compose modules that distinguish each functional subtype. GBM driver genes in each module recapitulate the functional hallmark of each subtype (for example, CDK6 amplification/CDKN2A deletion for the PPR proliferation/stemness features; MET amplification/NF1 deletion for glycolysis/RAS pathway activation in GPM GBM; FGFR3-TACC3 fusion for mitochondrial activation in MTC tumors). GPM is the only subtype that significantly associates with a specific sex (male) and age group (45–65 years). GPM and MTC subtypes exhibit positive correlation with frontal/parietal and temporal tumor location, respectively. GPM, PPR and NEU are linked with radiologic features that are compatible with the biological traits of these subgroups (CET, NET and DWM invasion, respectively). In agreement with the enhanced OXPHOS and MK activity of PKCδ and DNA-PKcs in MTC, GPM and PPR, respectively, these subtypes are distinctly sensitive to mitochondrial, PKCδ and DNA-PKcs inhibitors. CET, contrast-enhancing tumor; NET, non-contrast-enhancing tumor; DWM, deep white matter).
Extended Data Fig. 1
Extended Data Fig. 1. Definition of functional subtypes of GBM by SNF and relationship to prior GBM classifiers.
a, Circular plot indicating the annotation of data available for each platform and individual tumors of CPTAC-GBM cohort (n = 93 GBM samples). The number (n) of GBM samples for each platform is indicated. b, Integrative clustering of GBM tumors by SNF (n = 89 GBM samples). Heat map of patient-to-patient similarity coefficients generated by the integration of subtype-specific gene expression of the highest 50 genes in the ranked lists of the functional subtypes of 52 GBM samples classified as anchors and fCNVs associated with the four GBM subtypes from TCGA. Yellow-to-orange scale represents low to high similarity coefficient. c, Dot plot showing the genes harboring fCNVprot gain or loss and relative pathway enrichment for each GBM subtype (n = 85 GBM samples). Dot size indicates significance of the pathway enrichment (P < 0.05, Fisher’s exact test) and color the log2(FC) of the protein abundance in tumors harboring the fCNVprot alteration compared to wild-type tumors (blue to red scale indicate fCNVprot gain, red scale; fCNVprot loss, blue scale; two-sided MWW test). d-e, Chord diagram of GBM subtype assignment of the indicated classifiers in each individual tumor from TCGA (n = 199 GBM samples) (d) and CPTAC (n = 83 GBM samples) (e) datasets. f, Chord diagram of GBM subtype assignment according to the indicated classifiers in each individual tumor from the CPTAC dataset (n = 85 GBM samples).
Extended Data Fig. 2
Extended Data Fig. 2. Association between fCNV status of GBM driver genes and pathway-based subtypes.
a, Forest plots showing the association between fCNV amplification/mutation status of GBM driver oncogenes and subtype transcriptomic activity (magenta) or abundance of protein of the corresponding gene (light blue) in the CPTAC-GBM cohort (n = 84 GBM samples; univariate logistic regression). log(odd ratio) estimates (OR), 95% confidence intervals (CI) and P values are reported. log(OR) estimates higher/lower than 0 represent positive/negative association. b, FGFR3-TACC3 fusion analysis was performed using a cohort of GBM profiled by FFPE tissue RNA-Seq (n = 170 GBM samples; univariate logistic regression). log(OR) estimates, 95% CI and P values are reported. c, Forest plots showing the association between fCNV deletion/mutation status in GBM tumor suppressor genes and subtype transcriptomic activity (blue) or protein abundance of the corresponding gene (light blue; n = 84 GBM samples; univariate logistic regression). log(OR) estimates, 95% CI and P values are reported. For tumor suppressor genes, subtype activity values (NES) were multiplied by −1 for visualization purposes.
Extended Data Fig. 3
Extended Data Fig. 3. Multiplatform validation of the metabolic axis of the GBM subtypes.
a, Comparative analysis of the interactome network including intermediate metabolites and enzymes of the indicated metabolic activities in GPM versus MTC tumors (GPM GBM samples: n = 16; MTC GBM samples: n = 10 for metabolites; GPM GBM samples: n = 22; MTC GBM samples: n = 12 for proteins; two-sided MWW test). Orange to green scale indicates metabolite/protein increase to decrease in GPM versus MTC samples; [glycolytic intermediates: logit(NES) = 1.76, P = 0.0007, mitochondrial intermediates: logit(NES) = −1.65, P = 0.018; glycolytic proteins: logit(NES) = 1.27, P = 0.017, mitochondrial proteins: logit(NES) = −1.19, P = 5.93e-13; two-sided MWW-GST]. b-d, Enrichment analysis of b, lipid subclasses and c, LION terms, grouped according to cellular components and d, lipid functions. Lipid subclasses and LION terms significantly enriched in at least one GBM subtype are reported (n = 64 GBM samples; log odds ratio > 0, P < 0.05; Fisher’s exact test). Circles are color-coded and their size reflect the log odds ratio. Asterisks: * P < 0.05, ** P < 0.005, *** P < 0.001. e, Heat map showing unsupervised clustering of metabolic proteins differentially expressed between MTC and GPM samples [log2(FC) > 0.3, P < 0.05; two-sided MWW test]. Biological pathways significantly enriched in metabolic proteins are reported on the right (log odds ratio > 0, P < 0.05; Fisher’s exact test). n, number of GBM samples in GPM and MTC subtypes. f, Heat map depicting the outlier fraction of acetylated metabolic protein in GPM and MTC tumors (P < 0.05; BlackSheep). Representative outlier acetylated proteins are listed on the left according to decreasing P value. Biological pathways significantly enriched in outlier acetylated proteins are reported on the right (P < 0.0005; Fisher’s exact test). n, number of GBM samples in GPM and MTC subtypes.
Extended Data Fig. 4
Extended Data Fig. 4. Computational strategy for the identification of MKs in functional GBM subtypes and benchmarking of SPHINKS approach.
a, The reconstruction of an unbiased kinome network combines SVM classifiers trained on different instances of the negative set as follows: (step i) train SVM classifier on validated kinase-substrate interactions (green arrows, positive training set) and a subset of randomly selected unknown interactions (red dotted arrow, negative set) using kinase abundance from proteomics and substrate abundance from phosho-proteomics; (step ii) compute a score for all the interactions in the network according to the SVM classifier; (step iii) perform bagging and obtain the average SVM scores; (step iv) retain only interactions whose average score was above the average SVM score threshold (50% of the known interactions) and whose Spearman’s correlation was positive; (step v) calculate MKs activity as the difference of two terms, the weighted average of the predicted substrate’s abundances using the SPHINKS score as weight (left), and the weighted average of randomly selected control substrate-set (right). b, ROC curves of the predictions of the interactions by SPHINKS derived from simulated phospho-proteomic matrix with different rates of missing values. The top-left side of plot was magnified for accurate visualization. c, ROC curves of the interactions by SPHINKS for each of the 10 cross-validation iterations of experimentally validated interactions. d, Box plots of the average kinase Δ-activity (percentage) from unperturbed versus 100 networks perturbed with random phosphosites interactions for each kinase replacing true interactions in the network (p = 5%, 10%, 15%, 20%, 50%). In the upper plot, each dot represents the average Δ-activity for each kinase across all runs at each perturbation percentage; in the lower plot, each dot represents the average Δ-activity for each run across all kinases at each ratio of perturbation. Box plots span the first to third quartiles and whiskers show the 1.5 × interquartile range. e, Kinase-substrate interactome from SPHINKS highlighting MKs for each functional subtype indicated by colors: red, green, blue and cyan, MKs in GPM, MTC, NEU, and PPR, respectively (effect size > 0.3, P < 0.01; two-sided MWW test; n = 85 GBM samples). Nodes represent kinases and substrates, and lines their interactions. Gray nodes are subtype non-specific kinases; purple nodes are kinase-targeted phosphosites substrates. Orange lines indicate kinase-phosphosite interactions from PhosphoSitePlus; cyan lines represent novel kinase-substrate interactions inferred by the SPHINKS. f, MKs significantly active in each functional GBM subtype were mapped onto the human kinome tree. Red, green, blue and cyan, MKs in GPM, MTC, NEU, and PPR, respectively. The size of the circles is proportional to the kinase activity. The number of GBM samples is as in e.
Extended Data Fig. 5
Extended Data Fig. 5. Benchmarking of SPHINKS against previously published kinase-substrate inference methods.
a, Bar plot showing the probability of correctly identifying upregulated or downregulated kinases by the analysis of the ‘top-10-hit’ using the indicated inference methods (n = 103 kinase perturbations). b, Bar plot of the differential rank (Δ-rank) of activity between SPHINKS and the indicated inference methods for the kinases significantly active in each GBM subtype by SPHINKS and common to the networks of all five approaches (n = 85 GBM samples). Kinases are ordered according to the rank of activity by SPHINKS.
Extended Data Fig. 6
Extended Data Fig. 6. Global and phospho-proteomics events in insulin receptor/IGF-PKCδ pathway in GPM GBM and enrichment of DDR and RS phospho-proteins as a specific feature of PPR GBM.
a, Signaling network highlighting the molecules and proteins involved in IGF-I/insulin signaling of GPM GBM tumors. Orange or red scale indicates the MWW score derived from the proteomic or phosphosite ranked list of GPM tumors when compared to the others, respectively (two-sided MWW test, n = 85 GBM samples). Molecules in white are proteins not profiled or whose abundance was not significantly higher in GPM when compared to the other subtypes. b-c, Western blot analysis of GPM PDO cells incubated with b, IGF-I (10 ng/ml), IGF-II (10 ng/ml) and c, insulin (100 ng/ml) for the indicated times using the indicated antibodies. GAPDH is shown as a loading control. Each experiment was repeated independently 2 times with similar results. d, Viability curves of n = 8 PPR PDOs each derived from an independent patient and n = 8 GPM PDOs, each derived from an independent patient treated with increasing concentration of Nedisertib. Data are mean ± s.d. of n = 4 technical replicates for each PDO from one representative experiment. Experiments were repeated 2 times with similar results. e, Quantification of clonogenic assay of 2 PPR PDOs (PDO 015 and PDO 044, top panels) each derived from an independent patient and 2 GPM PDOs (PDO 021 and PDO 062, bottom panels) each derived from an independent patient treated with IR or IR plus Nedisertib (1667nM). Data are mean of n = 3 technical replicates from one representative experiment. Experiments were repeated 2 times with similar results. Source data
Extended Data Fig. 7
Extended Data Fig. 7. Proteomics characterization and clinical outcome of PG stratified according to functional subtypes.
a-b, Heat map showing the median abundance of the 150 highest scoring proteins of the ranked lists (two-sided MWW test) of the four functional subtypes in a, PG-LGG and b, PG-HGG (two-sided MWW test). Rows are proteins and columns are functional subtypes (n = 82 PG-LGG samples; n = 22 PG-HGG samples). Left and top color tracks indicate functional subtypes. Unsupervised clustering was performed for each subtype-specific protein signature. For each subtype, biological pathways significantly enriched by each gene subcluster are reported on the left (P < 0.05, Fisher’s exact test). c, Kaplan–Meier curves of PG (n = 94 patients) stratified by SNF combining gene and protein signatures obtained from the functional GBM subtypes. Patients in the PPR subgroup exhibit significantly worse survival (log-rank test).
Extended Data Fig. 8
Extended Data Fig. 8. Functional classification of BRCA and LSCC and prognostic implications.
a-b, Heat map showing the 150 highest scoring genes of the ranked lists of the four functional subtypes obtained from tumors classified in a, TCGA- (n = 810 BRCA samples) and b, METABRIC-BRCA (n = 1,088 BRCA samples) datasets (two-sided MWW test). Rows are genes and columns are tumors. Horizontal top and left tracks indicate functional subtypes; horizontal middle track indicates PAM50 classification of BRCA by TCGA; horizontal lower track indicates tumor grade. Unsupervised clustering was performed for each subtype-specific gene signature. Biological pathways significantly enriched by each gene subcluster are reported on the left (P < 0.05; Fisher’s exact test). c, Kaplan–Meier curves and log-rank test analysis of 1,897 BRCA patients from the combined TCGA (n = 809 patients) and METABRIC datasets (n = 1,088 patients), stratified according to the four functional subclasses (log-rank test). d, Heat map showing the 150 highest scoring genes of the ranked lists of the four functional subtypes in LUSC from TCGA database (n = 360 LUSC samples; two-sided MWW test). Rows are genes and columns are tumors. Horizontal top and left tracks indicate functional subtypes; horizontal lower track indicates tumor grade. Unsupervised clustering was performed for each subtype-specific gene signature. For each subtype, biological pathways significantly enriched by each gene subcluster are reported on the left (P < 0.05; Fisher’s exact test). e, Kaplan–Meier curves of 356 patients with LUSC from the TCGA dataset stratified according to the four functional subclasses. f, Mitochondrial activity (NES) and menadione survival ratio (log2) for 26 BRCA (upper plot) and 71 LUSC (lower plot) cell lines from DepMap. Upper track, functional classification; middle track, mitochondrial activity; lower track, menadione survival ratio. Survival ratio: difference between mitochondrial cell lines versus the others; log2(FC) = −1.31, p = 0.008 for BRCA; log2(FC) = −0.63, p = 0.076 for LUSC; two-sided t-test, unequal variance.
Extended Data Fig. 9
Extended Data Fig. 9. Common and specific Master Kinases across CPTAC-GBM, -PG, -BRCA, and -LSCC.
Venn diagrams reporting the common and specific master kinases of each functional subtype resulted significantly activated in CPTAC-GBM, -PG, -BRCA, and -LSCC (GBM: n = 85 samples; PG: n = 104 samples; BRCA: n = 118 samples; LSCC: n = 106 samples).
Extended Data Fig. 10
Extended Data Fig. 10. Clinical-grade probabilistic tool for the classification of frozen and FFPE IDH wild-type GBM.
a, Schematics of the approach for calculating the probability of a GBM sample of belonging to one of the four defined functional subtypes. The Agilent expression data of 506 samples from the TCGA cohort of GBM were classified into one of the four functional subtypes (top left). The standardized expression of all the genes from the subtype-specific gene signatures (bottom left) was used to train a multinomial regression model with lasso penalty using glmnet (middle part). Each sample (input) was used to build a multi-class logistic regression model that returns four probabilities Pi,k, one for each functional GBM subtype. We classified a tumor into one subtype if the fitted probability of the particular subtype was the highest (Pkhigh) and the sample showed a simplicity score (SS) above a defined threshold (δ). Tumors that did not comply with the defined thresholds remained unclassified. b, Comparison bar plot of sensitivity, specificity, and precision in each GBM subtype of the multinomial regression model using RNA-Seq data from 45 matched frozen samples. c, Consensus clustering generated from the 178 FFPE GBM samples using the expression of the 200 genes from the FFPE-specific gene signatures. Columns and rows represent FFPE samples. Color bar on the top defines four subgroups according consensus clustering. Track at bottom indicates the functional classification of the corresponding 45 matched frozen samples. The number (n) of samples in each cluster and subtype is indicated. Yellow-to-blue scale indicates low to high similarity. d, Comparison bar plot of sensitivity, specificity, and precision in each GBM subtype of the multinomial regression model using RNA-Seq data from 45 matched FFPE samples. Dashed lines and corresponding values indicate the average of each performance measure (blue: sensitivity; orange: specificity; purple: precision) in each GBM subgroup.

Comment in

References

    1. Simon R, Roychowdhury S. Implementing personalized cancer genomics in clinical trials. Nat. Rev. Drug Discov. 2013;12:358–369. doi: 10.1038/nrd3979. - DOI - PubMed
    1. Kundra R, et al. OncoTree: a cancer classification system for precision oncology. JCO Clin. Cancer Inform. 2021;5:221–230. doi: 10.1200/CCI.20.00108. - DOI - PMC - PubMed
    1. Mertins P, et al. Proteogenomics connects somatic mutations to signalling in breast cancer. Nature. 2016;534:55–62. doi: 10.1038/nature18003. - DOI - PMC - PubMed
    1. Zhang B, et al. Proteogenomic characterization of human colon and rectal cancer. Nature. 2014;513:382–387. doi: 10.1038/nature13438. - DOI - PMC - PubMed
    1. Garofano L, et al. Pathway-based classification of glioblastoma uncovers a mitochondrial subtype with therapeutic vulnerabilities. Nat. Cancer. 2021;2:141–156. doi: 10.1038/s43018-020-00159-4. - DOI - PMC - PubMed

Publication types

Substances