. 2023 Mar;4(3):344-364.
doi: 10.1038/s43018-023-00513-2. Epub 2023 Feb 2.

A palmitate-rich metastatic niche enables metastasis growth via p65 acetylation resulting in pro-metastatic NF-κB signaling

Affiliations

A palmitate-rich metastatic niche enables metastasis growth via p65 acetylation resulting in pro-metastatic NF-κB signaling

Patricia Altea-Manzano et al. Nat Cancer. 2023 Mar.

Abstract

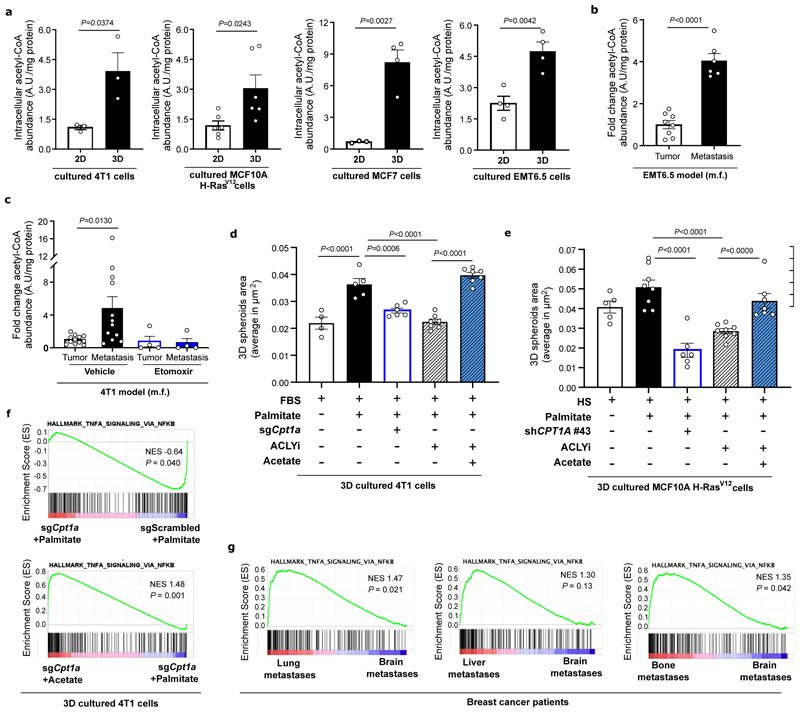
Metabolic rewiring is often considered an adaptive pressure limiting metastasis formation; however, some nutrients available at distant organs may inherently promote metastatic growth. We find that the lung and liver are lipid-rich environments. Moreover, we observe that pre-metastatic niche formation increases palmitate availability only in the lung, whereas a high-fat diet increases it in both organs. In line with this, targeting palmitate processing inhibits breast cancer-derived lung metastasis formation. Mechanistically, breast cancer cells use palmitate to synthesize acetyl-CoA in a carnitine palmitoyltransferase 1a-dependent manner. Concomitantly, lysine acetyltransferase 2a expression is promoted by palmitate, linking the available acetyl-CoA to the acetylation of the nuclear factor-kappaB subunit p65. Deletion of lysine acetyltransferase 2a or carnitine palmitoyltransferase 1a reduces metastasis formation in lean and high-fat diet mice, and lung and liver metastases from patients with breast cancer show coexpression of both proteins. In conclusion, palmitate-rich environments foster metastases growth by increasing p65 acetylation, resulting in a pro-metastatic nuclear factor-kappaB signaling.


Conflict of interest statement

Competing interests’ statement

S-MF has received funding from Gilead, Bayer AG, Merck, Black Belt Therapeutics and Alesta Therapeutics, has consulted for Fund+ and is in the advisory board of Alesta Therapeutics. TGPG has consulted for Boehringer Ingelheim. All other authors declare no competing interests.

Figures

Extended Data Figure 1
Palmitate and oleate levels are increased upon high fat diet exposure, and only palmitate is released by AT2 cells during pre-metastatic niche formation a. Fraction of free fatty acids (grey) over total fatty acid content (black) of liver interstitial fluid of healthy BALB/c mice (n=7). b. Mouse weight gain upon high fat or control diet over the course of the experiment. Data are presented as mean ± SEM(n =60). Mixed-effects analysis with Sidak’s multiple comparisons. Asterisks represent statistical significance as follows: ***p < 0.001, ****p < 0.0001. c. Palmitate and oleate abundance in lung interstitial fluid of BALB/c mice after 16 weeks on control (CD) or high fat (HFD) diet (n=11). Data are presented as mean ± SEM of absolute concentration measured by mass spectrometry. Unpaired two-tailed t-tests with Welch correction. d. Palmitate and oleate abundance in liver interstitial fluid of BALB/c mice after 16 weeks on CD or HFD diet (n=8). Data are presented as mean ± SEM of absolute concentration measured by mass spectrometry. Unpaired two-tailed t-tests with Welch correction. e. Schematic illustration for experimental pre-metastatic niche formation procedure. CM, control media; TCM, tumor conditioned media; i.v. intravenous. f. Changes in gene expression in lung populations upon TCM injection relative to CM injections, for genes whose upregulation has been previously linked to pre-metastatic niche formation, such as S100a8, S100a9, Mmp9 90,91 and Tlr3 and Cxcl2 in lung alveolar type II cells 91, Tlr4 and Saa3 in lung endothelial cells and macrophages 92; Slc2a1, Pdk1, and Ldha in macrophages 93, and S100 genes in lung fibroblasts 94. The color scale denotes log2 fold changes in TCM vs. CM. g. Relative glucose concentration in the lung interstitial fluid of healthy BALB/c mice exposed to control media or tumor condition media. Data are presented as mean ± SEM(n ≥7). Unpaired two-tailed t-tests with Welch correction. h. Granulocytes population (which includes neutrophils) present in lungs after induction of pre-metastatic niche formation using tumor conditioned media or control media. Data are presented as mean ± SEM (n=3). Unpaired two-tailed t-tests with Welch correction. i. Palmitate and oleate abundance in lung (n=16) and liver (n ≥7) interstitial fluid of BALB/c mice injected with control media (CM) or 4T1-tumor conditioned media (TCM) (3 weeks, 3 times/week). Data are presented as mean ± SEM. Unpaired two-tailed t-tests with Welch correction. j. Palmitate concentration in liver interstitial fluid of healthy or 4T1 tumor-bearing (PT) BALB/c mice. Data are presented as mean ± SEM (n ≥15).
Extended Data Figure 2
High fat diet moderately impacts gene expression but increases the fraction of lung resident alveolar type II cells a. UMAP plots for the scRNA-seq data corresponding to lungs preconditioned with control media (CM) and tumor conditioned media (TCM), or control diet (CD) and high fat diet (HFD). Color-coded based on GSVA-based marker scores for gene sets corresponding to alveolar type I (AT1) and II (AT2) marker genes. Identified clusters are indicated within black circles. Marker scores are scaled to the range 0–1 for each market set (see Methods). b. scRNA-seq-based gene expression vs. cell type and diet condition profiles for known marker for AT1 and AT2 cells and lipid-related genes indicated on the left-hand side. Scaled expression levels are indicated by the color scale, where (CP100k) ¯ denotes the average gene expression level (in counts per 100k reads) over all cells of a given type in each condition, and (CP100k) ¯ the average of the latter over all cell types and condition media. The areas of the circles represent the percentage of cells with non-zero expression of each gene among all cells of each type and in each dietary condition. CD, control diet; HFD, high fat diet. c. Fractions of cells corresponding to AT2 cells, among all cells present in the lung of mice exposed to control (CD) or high fat (HFD) diet, as determined from scRNA-seq data.
Extended Data Figure 3
Lung metastases show an increase in lipid species enriched in palmitoyl acyl chains typically found in the pulmonary surfactant. a. Fatty acid composition of the lipid classes phosphatidylcholine, phosphatidylglycerol and phosphatidylethanolamine in breast primary tumor and lung metastasis tissues from BALB/c mice orthotopically injected with 4T1 breast cancer cells. Data are presented as mean ± SEM (n=6). Unpaired nonparametric two-tailed Mann–Whitney U-tests. b. Intracellular oleate abundance from mouse (4T1, EMT6.5) and human (MCF10A H-RasV12, MCF7) breast cancer cells cultured on soft-agar (3D) or attached (2D) conditions. Data are presented as mean ± SEM (n≥3). c. Palmitate uptake measured by 13C16-Palmitate intracellular incorporation in 3D spheroids and 2D cultured breast cancer cells after 5 days of incubation with BSA-conjugated 13C16-Palmitic acid. Data are presented as mean ± SEM (n≥4). Unpaired two-tailed t-tests with Welch correction. d. Fraction on newly synthesized fatty acids estimated by fatty acid Isotopomer Spectral Analysis (ISA) based on mass isotopomer distribution (MID) of 13C6-glucose incorporation in 3D spheroids and 2D cultured breast cancer cells in the presence of extra palmitate (75μM) for 5 days. Data are presented as mean ± SEM (n=4). Unpaired two-tailed t-tests with Welch correction. e. Intracellular palmitate and oleate abundance from 3D spheroids mouse (4T1) and human (MCF7) breast cancer cells. Data are presented as mean ± SEM (n=4). One-way ANOVA with Holm-Sidak’s multiple comparison test. f. Representative pictures of 4T1 spheroids cultured in 10%FBS, or 10%FBS in the presence of palmitate (75 μM) or oleate (116 μM). Scale bar = 0.5 μm. A representative of n=3 experiments is shown. g. Relative proliferation of 2D cultured 4T1 cells (with or without extra palmitate) normalized to condition without extra palmitate. Data are presented as mean ± SEM (n=6). h. Representative pictures of 4T07 spheroids cultured in 10%FBS with or without extra palmitate (75 μM) Scale bar = 0.5 μm. A representative of n=3 experiments is shown. i-j. 3D spheroids growth of 4T1 cells upon palmitate + oleate supplementation (i) and stearate (j) supplementation represented by the average spheroids area of >100 spheroids. Data are presented as mean ± SEM (n ≥4). One-way ANOVA with Holm-Sidak’s multiple comparison test.
Extended Data Figure 4
CPT1a expression is upregulated in metastasis and is associated with poor prognosis in breast cancer patients. a. Mitochondrial mass represented by mean relative fluorescence (MFI) of MitoTracker in 3D spheroids 4T1 cells growing in the absence or presence of palmitate or oleate for 5 days. MFI is shown relative to the level of MitoTracker fluorescence of 10% FBS condition. Data are presented as mean ± SD (n=4). b-c. Differentially expressed genes in (b) 4T1 cells cultured in 3D spheroids or 2D monolayer in the presence of extra palmitate, or (c) in 3D spheroid 4T1 in the presence or absence of extra palmitate (10% FBS + palmitate or 10% FBS). Calculated differences in gene expression are presented by plotting the negative log10 of false discovery rate (Y-axis) against the log2 fold change of gene expression (X-axis). Each dot represents an individual gene. In red, genes belong to the GEO term lipid metabolic process (GO:0006629). The highest-ranking (top 10) overexpressed genes or genes above the established cutoff are annotated. d. CPT1a expression in 3D spheroid 4T1 cells growing for 5 days in the presence of additional palmitate, oleate and stearate. A representative image of n=3 experiments is shown. e. Forest plot depicting the hazard ratio (HR) (x-axis) and corresponding 95% confidence intervals (denoted by error bars) for overall survival of patients with primary breast cancer according to CPT1A expression from two different cohorts: TCGA (n=1,221) and METABRIC (n= 1,904). Cox proportional hazards models were applied, controlling for age, tumor stage (cTNM-staging system), and tumor subtype in both datasets. Panel complementary to Figure 3i. f. 3D spheroids growth of MCF7 cells upon CPT1a knockdown compared to scrambled control upon palmitate supplementation (75 μM) represented by the average spheroids area of >100 spheroids. Data are presented as mean ± SEM (n≥4). One-way ANOVA with Tukey’s multiple comparison test. g. 3D spheroids growth (5 days) of 4T1 cells upon CPT1a inhibition using etomoxir (50 μM) in the presence of extra palmitate (75 μM) represented by the average spheroids area of >100 spheroids. Data are presented as mean ± SEM (n≥4). One-way ANOVA with Tukey’s multiple comparison test. h. 3D spheroids number per well of 4T1 cells upon palmitate supplementation (75 μM), CPT1a genetic inhibition performed by shRNA (shCpt1a) and CRISPR (sgCpt1a), and upon metabolic rescue by acetate (5mM). Data are presented as mean ± SEM (n≥4). One-way ANOVA with Tukey’s multiple comparison test.
Extended Data Figure 5
Representative lung and liver H&E staining and primary tumor weight upon CPT1a and KAT2a loss. a. Representative pictures of tissue from the lung of mice injected with 4T1 (m.f.) and EMT6.5 (i.v.) upon genetic inhibition of CPT1a compared to non-targeting sg/shRNA as a control, based on H&E staining. Arrowheads indicate metastasis tissue. Scale bars= 2 mm. b. Final primary tumor weight (grams) from individual breast tumors upon genetic inhibition of CPT1A and KAT2A in the 4T1 model (m.f.). Data are presented as mean ± SEM (n ≥11). One-way ANOVA with Dunnett’s multiple comparison test.
Extended Data Figure 6
Breast cancer spheroids in the presence of additional palmitate rely on CPT1a for acetyl-CoA production and for sustaining palmitate-induced 3D growth. a. Invasive ability in a 3D matrix of 4T1 cells upon CPT1a knockout (sgCpt1a) compared to control (Scrambled) cells. Invasion was assessed by measuring the invasive area of cancer cells stained with calcein green. Representative images are depicted in the left panel (scale bar 500 μm), quantification in the right panel. Each dot represents a different, randomly selected microscopy field (n=5). b. Migratory ability of 4T1 upon CPT1a knockout (sgCpt1a) compared to control (Scrambled) cells. Migration was assessed by analyzing the total cells migrated through transwells coated with endothelial cells. Blue, DAPI nuclear staining. Representative images are depicted in the left panel (scale bar 500 μm), quantification in the right panel. Each dot represents a different, randomly selected microscopy field (n=5). c. Relatives changes in acetyl-CoA abundance in human MCF10A H-RasV12 and MCF7 breast cancer spheroids transduced with a lentiviral vector with shRNA against CPT1A (knockdown) compared to scrambled control sequences in the presence of extra palmitate. Data are presented as mean ± SEM (n=4). Unpaired two-tailed t-tests with Welch correction. d-e. Relatives changes in acetyl-CoA abundance in mouse 4T1 breast cancer spheroids transduced with a lentiviral vector with RNA against Cpt1a (c, knockdown and d, knockout) compared to non-targeting sh/sgRNA control in the presence or absence of extra palmitate. Data are presented as mean ± SEM (n=4). One-way ANOVA with Dunnett’s multiple comparison test or two-tailed unpaired student’s T-test. f. 3D spheroids growth (5 days) of 4T1 cells upon palmitate supplementation (75 μM), CPT1a genetic inhibition (shCpt1a) and metabolic rescue with octanoate (130 μM) compared to non-targeting shRNA control, represented by the average of spheroids area of >100 spheroids. Data are presented as mean ± SEM (n=4). One-way ANOVA with Dunnett’s multiple comparison test. g. Schematic representation of the palmitate flux into the mitochondria via CPT1A and the ACLY-dependent export of the mitochondrial acetyl-CoA pool to the cytosol via citrate. h. Intracellular levels of ATP in CPT1a knockout and control 4T1 3D spheroids cultured for 5 days in medium containing extra palmitate (75 μM) or acetate as metabolic rescue (5 mM). Data are presented as mean ± SEM (n ≥4). i. Heatmap display of the log2 transformed ratios obtained for the indicated histone acetylation for CPT1a knockdown and control 4T1 3D spheroids cultured for 5 days in medium containing extra palmitate (75 μM). Relative abundances ratios, light/SILAC heavy, were obtained with the SILAC (Stable Isotope Labeling with Amino acids in Cell culture) internal standard strategy.
Extended Data Figure 7
CPT1a deletion reduces NF-κB signaling pathway but does not affect p65 DNA binding. a. Top 10 enriched pathways (p<0.05) obtained from gene set enrichment analysis (GSEA) of 4T1 spheroids upon CPT1a inhibition (sgCPT1a), in the presence of the extra palmitate (75 μM) or acetate as metabolic rescue (5 mM) using the Hallmark gene set from Molecular Signatures Database (MSigDB). NES, normalized enrichment score. b. Relative expression of genes implicated in invasion and metastasis, and that are known to be regulated via NF-κB activation in 4T1 spheroids. Fold change is calculated from normalized raw counts (RNA sequencing) of CPT1a knockout and non-targeting sgRNA control 4T1 3D spheroids cultured for 5 days in medium containing extra palmitate (75 μM) or acetate (5 mM). Data are presented as mean ± SD (n=3). Multiple testing correction with false discovery rate (FDR) estimation. c. Relative expression of genes implicated in invasion and metastasis, and that are known to be regulated via NF-κB activation in MCF10A H-RasV12 spheroids. Fold changes are calculated for CPT1a knockdown and non-targeting sgRNA control MCF10A H-RasV12 3D spheroids cultured for 5 days in medium containing extra palmitate (75 μM) or acetate (5 mM) and are normalized to gene expression in control cells. Data are presented as mean ± SEM (n=3). One-way ANOVA with Dunnett’s multiple comparison test. d. Upstream regulator analysis performed using Ingenuity Pathway Analysis using the differential gene expression of CPT1A knockout (sgCpt1a) 4T1 3D spheroids in the presence or absence of acetate (metabolic rescue, 5 mM) as input. Activation score of the top 30 upstream regulators (left column) was compared to those predicted for the differential gene expression of CPT1A knockout versus control conditions (in the presence of extra palmitate). Genes related to the activation of the NF-κB pathway are framed. Asterisks represent the overlap p-value calculated using one-sided Fisher’s Exact Test (****p < 0.0001). e. GSEA enrichment plots comparing the gene expression profiles in 4T1 3D spheroids transduced with a lentiviral vector containing sgCpt1a or sgScrambled as a control (left panel) and sgCpt1a 4T1 3D spheroids cultured with or without acetate (right panel). NES, normalized enrichment score; the P value indicates the significance of the enrichment score (permutation test). f. Total p65 binding to DNA measured by electrophoretic mobility shift assay (EMSA). Arrow indicates the position of the NF-κB containing complex. A representative of n=3 experiments is shown.
Extended Data Figure 8
Global histone acetylation and chromatin accessibility are not consistently changed upon CPT1a and/or KAT2a loss a. KAT2a expression in 3D spheroid 4T1 cells growing for 5 days in the absence or presence of additional palmitate, oleate and stearate. A representative image of n=3 experiments is shown. b. Intracellular levels of acetyl-CoA in 4T1 cells growing in 3D for 5 days in medium containing only 10% FBS, or supplemented with palmitate (75 ?m), oleate (116 μM) or acetate (5 mM). Data are presented as mean ± SEM (n=4). c. Heatmap of the signal intensity of H3K9ac-targeted gene loci in non-targeting RNA control, CPT1a and KAT2a knockout 4T1 3D spheroids cultured for 5 days in medium containing extra palmitate (75 μM) (n=3). d. Correlation plot of H3K9 acetylation in 4T1 3D spheroids cultured in the presence of palmitate upon CPT1a inhibition with and without acetate (5 days). e. Heatmap and hierarchical clustering of top-scored downregulated genes of the NF-κB signaling pathway upon CPT1a deletion in 4T1 3D spheroids cultured in the presence of palmitate for 5 days, represented together with the expression status of the same genes upon acetate rescue and KAT2a deletion non-targeting sgRNA is used in control transfected samples (n=3). f. Proliferation of 4T1 cells upon genetic inhibition of either Cpt1a or Kat2a in 2D culture measured using incucyte. Mean of growth rate ± SEMis shown (n=6). One-way ANOVA with Dunnett’s multiple comparison test. g. 3D spheroids in 4T1 cells upon pharmacologic inhibition of either KAT2a using the inhibitor CPTH2 (2 μM) or CPT1A using etomoxir (50 μM) cultured for 5 days in medium with or without extra palmitate supplementation. Size quantification is represented by the average spheroids area of >100 spheroids. Data are presented as mean ± SEM (n ≥4). One-way ANOVA with Tukey’s multiple comparison test. h. 3D spheroids number per well of 4T1 cells upon palmitate supplementation (75 μM), CPT1a or KAT2a genetic inhibition performed by CRISPR (sgCpt1a and sgKat2a) compared to non-targeting sgScrambled as a control, and upon metabolic rescue by acetate (5mM). Data are presented as mean ± SEM (n≥4). One-way ANOVA with Tukey’s multiple comparison test. i. Dose-response of 3D spheroid growth to the pharmacologic inhibition of KAT2a using CPTH2 inhibitor with or without extra supplementation of palmitate. Left panel, representative pictures. Right panel, spheroid size quantification is represented by the average spheroids area of >100 spheroids (n ≥4). Two-way ANOVA with Tukey’s multiple comparison test. j. Total area and number of metastases in lung of mice after 14 days of intravenous (i.v.) injections with 4T1 Kat2a knockout (sgKat2a) or non-targeting sgScrambled control cells analyzed by H&E staining (n≥8). Unpaired two-tailed t-tests with Welch correction.
Extended Data Figure 9
Protein and RNA expression of genetically modified breast cancer cells. a. Relative gene expression analysis of CPT1A in human (MCF10A H-RasV12 and MCF7), mouse (4T1, EO771-MCB3 and EMT6.5) breast cancer cells infected with either a control shRNA, or two different CPT1A, or Cpt1a shRNAs normalized to the control condition. Data are presented as mean ± SD (n=3). Unpaired two-tailed t-tests. b. Protein expression in mouse 4T1 cancer cells infected with either a non-targeting sgScrambled as a control or two different sgRNA against Cpt1a and Kat2a gRNAs. A representative of n=3 experiments is shown.
Extended Data Figure 10
MS/MS validation of lipids detected in metastases by MALDI-MSI molecular imaging a. MS/MS spectrum of the ion at m/z 760.5842 detected from the metastatic areas within the lung tissue in positive ion mode using the timsTOF fleX. Ions supporting the assignment of PC O-18:1_16:0 are annotated with their corresponding mass accuracy. b. MS/MS spectrum of the ion at m/z 760.5842 detected from the metastatic areas within the lung tissue in positive ion mode using the timsTOF fleX. Ions supporting the assignment of PC 20:1_16:0 are annotated with their corresponding mass accuracy. c. MS/MS spectrum of the ion at m/z 760.5842 detected from the metastatic areas within the lung tissue in positive ion mode using the timsTOF fleX. Ions supporting the assignment of PC 18:1_16:0 are annotated with their corresponding mass accuracy.
Figure 1
Figure 1. High fat diet enhances overall fatty acid availability in the lung and liver while palmitate availability is specifically increased only in lung during pre-metastatic niche formation.
a. Total fatty acid concentrations in the lung interstitial fluid of healthy BALB/c mice (n=5) and human non-cancer patients (n=7) detected by mass spectrometry. b. Total fatty acid concentrations present in the liver interstitial fluid of healthy BALB/c mice (n=7) detected by mass spectrometry. c. Relatives changes in fatty acid concentrations in lung and liver interstitial fluid of BALB/c mice after 16 weeks on control diet (CD,) or high fat diet (HFDs) (n≥10). Unpaired two-tailed t-tests with Welch correction.*P<0.05, **P<0.01, ***P<0.001. d. Percentage of cancer cells present in lung of CD and HFD feeding mice injected with CD90.1 expressing 4T1 breast cancer cells intravenously (i.v.). Data are presented as mean + SEM(n=4). Unpaired two-tailed t-tests with Welch correction. e. Metastatic area in liver of CD and HFD feeding mice injected with 4T1 breast cancer cells intrasplenic (i.sp.). Data are presented as mean + SEM (n≥9). Unpaired two-tailed t-tests with Welch correction. f. Percentage of cancer cells present in lung of CD and HFD feeding mice injected with CD90.1 expressing 4T07 breast cancer cells intravenously (i.v.). Data are presented as mean + SEM (n≥9). Unpaired two-tailed t-tests with Welch correction. g. Percentage of cancer cells present in lung of mice injected with control media (CM) or 4T1-tumor conditioned media (TCM) (3 weeks, 3 times/week) after 16 days of intravenous (i.v.) injections with CD90.1 expressing 4T1 or 4T07 breast cancer cells. Data are presented as mean ± SEM (n≥5). Unpaired two-tailed t-tests with Welch correction. h. Relatives changes in fatty acid concentrations in lung and liver interstitial fluid of BALB/c mice injected with CM or 4T1- TCM (n≥11). Unpaired two-tailed t-tests with Welch correction., ****P<0.0001. i. Palmitate (left panel) and oleate (right panel) concentration in lung interstitial fluid of healthy or 4T1 tumor-bearing (PT) BALB/c mice. Data are presented as mean ± SEM (n ≥15). Unpaired two-tailed t-tests with Welch correction. j. Palmitate concentration in lung interstitial fluid of non-cancer (emphysema) patients (n=3) compared to breast cancer patients without detected lung metastases (n=9). Data are presented as mean ± SEM. Unpaired two-tailed Mann–Whitney U-tests.
Figure 2
Figure 2. Lung resident alveolar type II (AT2) cells respond to preconditioning of metastatic breast primary tumors by increasing surfactant-related genes and palmitate release.
a. scRNA-seq-based gene expression vs. cell type and pre-conditioning media profiles for known marker for AT1 and AT2 cells and lipid-related genes indicated on the left-hand side. Scaled expression levels are indicated by the color scale, where CP100k¯ denotes the average gene expression level (in counts per 100k reads) over all cells of a given type in each condition, and CP100k¯the average of the latter over all cell types and pre-conditioning media conditions. The areas of the circles represent the percentage of cells with non-zero expression of each gene among all cells of each type and in each preconditioning media condition. CM, control media; TCM, tumor conditioned media.. b-c. Relative expression of genes implicated in lipid and production surfactant release in AT2 cells isolated from healthy or (b) 4T1 and (c) 4T07 tumor-bearing (PT) BALB/c mice. Bars represent log2 of average fold change relative to AT2 in healthy mice and single dots represent individual fold changes. Error bars represent mean ± SEM (n=5). Unpaired nonparametric two-tailed Mann–Whitney U-tests. d. Relative expression of genes involved in pulmonary surfactant production and secretion in alveolar type II (AT2) cells exposed to control (CM) or tumor conditioned media (TCM) for 72h. Data are presented as mean ± SEM (n=6). Unpaired nonparametric two-tailed Mann–Whitney U-tests. e. Relative palmitate and oleate levels present in control (CM) or tumor conditioned media (TCM) before and after exposure to lung resident AT2 cells for 72h. Data are shown as mean ± SEM of fold changes compared with levels in media before incubation with AT2 cells (n=6). One-way ANOVA with Tukey’s multiple comparison test.
Figure 3
Figure 3. Intracellular palmitate levels as well as CPT1a expression are increased in breast cancer spheroids and lung metastasis.
a. MALDI-MSI ion images (50 μm pixel) of lipids PC O-18:1/16:0, PC 20:1_16:0 and PC18:1_16:0 within the lung tissue. Metastases are identified by optical image of the lung tissue section following by H&E staining and are denoted by red line based on bisecting k-means segmentation map. b. Fatty acid abundance in 4T1 and EMT6.5 primary tumor tissues and the matching lung metastases. Data represent normalized metabolite ion counts (n=5). Unpaired nonparametric two-tailed Mann–Whitney U-tests. Asterisks represent statistical significance (**p≤ 0.01). c. Intracellular palmitate abundance from mouse (4T1, EMT6.5) and human (MCF10A H-RasV12, MCF7) breast cancer cells cultured on soft-agar (3D) or attached (2D) conditions. Data are presented as mean ± SEM (n≥3). Unpaired two-tailed t-tests with Welch correction. d. 3D spheroids growth upon palmitate or oleate supplementation represented by the average of spheroids area of >100 spheroids. Data are presented as mean ± SEM (n ≥5). One-way ANOVA with Holm-Sidak’s multiple comparison test. e. CPT1a expression in breast cancer cells growing in 2D monolayer or 3D spheroid with or without additional palmitate. A representative image of n=3 experiments is shown. f. Relative Cpt1a gene expression in 4T1 and EMT6.5 (m.f.) breast-derived lung metastases normalized to Cpt1a gene expression of their breast primary tumors. Data are presented as mean ± SEM (n ≥3). Unpaired nonparametric two-tailed Mann–Whitney U-tests. g. CPT1A gene expression in breast primary tumors compared to metastatic tissues (GEO accession number GSE2109 (HS-00002(33)). Data are presented as mean ± SD (n ≥7). Unpaired two-tailed t-tests with Welch correction. h. Differently expressed genes in primary tumors of metastatic patients (metastasis already present at diagnosis) compared to non-metastatic patients (no metastasis during at least 7 years of followup). CPT1A transcript is identified as upregulated (considering an FDR-adjusted p-value threshold of < 0.05) and is colored in red. Multiple testing correction with false discovery rate (FDR) estimation. i. Kaplan–Meier survival for breast cancer patients with high or low levels of CPT1a gene expression. Comparison of survival curves was done using Mantel-COX test and Gehan-Breslow-Wilcoxon test (n=369).
Figure 4
Figure 4. Silencing CPT1a counteracts palmitate-induced spheroid growth and inhibits metastasis formation in lean and obese mice.
a-b. 3D spheroids growth of 4T1 and MCF10A H-RasV12 cells upon palmitate supplementation (75 μM), CPT1a genetic inhibition performed by shRNA (shCpt1a and shCPT1A) and CRISPR (sgCpt1a) compared to cells infected with non-targeted sh/sgRNA as a control, and upon metabolic rescue by acetate (5mM), represented by the average of spheroids area of >100 spheroids. Data are presented as mean ± SEM(n ≥4). One-way ANOVA with Tukey’s multiple comparison test. c-d. Metastatic burden in lung of mice injected with 4T1 in the mammary fat pad (m.f.) upon genetic (c) knockdown or (d) knockout of Cpt1a compared to cells infected with non-targeted sgRNA as a control, analyzed by H&E staining. Data are presented as mean ± SEM (n≥11). Data for sg-control and sgCpt1a are also shown in Figure 7f. Unpaired two-tailed t-tests with Welch correction. Representative H&E staining images are shown in Extended Data Figure 5a. e-f. Total area and number of metastases in lung of mice after 12-14 days of intravenous (i.v.) injections with EMT6.5 or EO771-MC3B cancer cells previously transduced with a lentiviral vector with shRNA against Cpt1a or scramble sequence as a control, and analyzed by H&E staining. Data are presented as mean ± SEM (n≥5).. Unpaired two-tailed t-tests with Welch correction. Representative H&E staining images are shown in Extended Data Figure 6a. g. Percentage of breast cancer cells present in lung of mice after 14 days of intravenous (i.v.) injections with CD90.1-4T1 cells. Mice were treated intraperitoneally with the CPT1a inhibitor etomoxir (40 mg/kg) or vehicle (water) daily starting after 4 days of cancer cell injections. Data are presented as mean ± SEM (n≥7). Unpaired two-tailed t-tests with Welch correction. h. Percentage of cancer cells (mean ± SEM) present in lung of mice after 12 days of intravenous (i.v.) injections with CD90.1-labeled 4T1 or EMT6.5 cancer cells, and expressingshRNA against Cpt1a or scramble sequence as a control. Before injections, mice were maintained during 16 weeks in CD and HFD (n ≥4). Data for 4T1 sh-control in CD and HFD are also shown in Figure 1d. Two-way ANOVA with Tukey’s multiple comparison test. i. Metastatic burden in lung of mice injected with 4T1 in the mammary fat pad (m.f.) upon Cpt1a knockout compared to cells infected with non-targeted sgRNA as a control, analyzed by H&E staining. Data are presented as mean ± SEM (n≥5). Before injections, mice were maintained during 16 weeks in CD and HFD. Unpaired two-tailed t-tests with Welch correction. Representative H&E staining images are shown in Extended Data Figure 5a.
Figure 5
Figure 5. CPT1a activity sustains acetyl-CoA levels in spheroids and lung metastases.
a. Intracellular levels of acetyl-CoA in breast cancer cells incubated in 2D monolayer and 3D spheroids cultures for 5 days in medium containing extra palmitate. Data are presented as mean ± SEM (n=4).Unpaired two-tailed t-tests with Welch correction. b. Relatives changes in acetyl-CoA abundance in EMT6.5 (m.f.) breast primary tumors and lung metastases. Data are shown as fold changes compared with the acetyl-CoA abundance in the primary tumors. Data are presented as mean ± SEM (n=4). Unpaired two-tailed t-tests with Welch correction. c. Relatives changes in acetyl-CoA abundance in 4T1 (m.f.) breast primary tumors and lung metastases upon acute inhibition of CPT1A using the inhibitor etomoxir (40 mg/kg i.p.) or vehicle (water). Data are shown as fold changes compared with the acetyl-CoA abundance in the primary tumors of the group of mice treated with the vehicle. Data are presented as mean ± SEM and points represented as zero were below the detection limit (n≥4).. One-way ANOVA with Dunnett’s multiple comparison test. d-e. 3D spheroids growth upon genetic inhibition of either Cpt1a/CPT1A compared to cells infected with scramble as a control together with pharmacologic ALCY inhibition using BMS-303141 (20 μM, 5 days) in (d) 4T1 and (e) MCF10A H-RasV12 cells with or without extra palmitate and in the presence of the acetate as metabolic rescue (5 mM, 5 days). 3D spheroid growth is represented by the average spheroids area of >100 spheroids. Data are presented as mean ± SEM (n ≥4). One-way ANOVA with Tukey’s multiple comparison test. f. GSEA enrichment plots comparing gene expression profiles in 4T1 3D spheroids transduced with a lentiviral vector containing sgCpt1a or sgControl (top panel) and sgCpt1a 4T1 3D spheroids cultured with or without acetate (bottom panel). NES, normalized enrichment score; the P value indicates the significance of the enrichment score (permutation test). g. GSEA enrichment plots comparing gene expression profiles of HALLMARK_TNFA_SIGNALING_VIA_NFKB signature from the Molecular Signature Database (MsigDB) in breast cancer metastases at different organ sites from patients (GSE14018). NES, normalized enrichment score; the P value indicates the significance of the enrichment score (unpaired one-tailed t-tests).
Figure 6
Figure 6. CPT1a is required for p65 acetylation and NF-κB signaling.
a. Acetylated p65 (NF-κB p65ac) in nuclear extracts of 3D spheroids transduced with a lentiviral vector containing sgCpt1a or sgcontrol and cultured for 3 days in the presence of extra palmitate (75 μM), acetate (5 mM) or the NF-κB inhibitor PDTC (0.5 μM). Histone H3 is shown as a loading control of NF-κB p65ac. A representative of n=3 experiments is shown. b-c. 3D growth (5 days) of (b) 4T1 and (c) MCF10A H-RasV12 cells upon treatment with the NF-κB inhibitor (PDTC, 0.5 μM) in the presence of extra palmitate and 4T1 3D spheroids growth upon activation of the pathway via either supplementation of TNFa (10 ng/μL) or extra palmitate (75 μM) is shown. 3D spheroid growth is represented by the average spheroids area of >100 spheroids. One-way ANOVA with Tukey’s multiple comparison test (4T1, n≥4) and Unpaired two-tailed t-tests with Welch correction (MCF10A H-RasV12, n=4). Data are presented as mean ± SEM. d. 3D growth (5 days) of 4T1 (left panel) and MCF10A H-RasV12 (right pale) cells upon treatment with the NF-κB inhibitor to the inhibitory impact of CPT1a inhibition (sgCpt1a) compared to non-targeting shRNA as a control, in the presence of the extra palmitate (75 μM) or acetate as metabolic rescue (5 mM). 3D spheroid growth is represented by the average spheroids area of >100 spheroids. Data are presented as mean ± SEM (n ≥4). One-way ANOVA with Tukey’s multiple comparison test.
Figure 7
Figure 7. Silencing CPT1a and KAT2a inhibit metastasis formation in vivo and are co-expressed in palmitate-enriched environments.
a. Differential expression of acetyltransferases in 4T1 3D spheroids in the with or without palmitate supplementation after 5 days of incubation. Data represent the fold changes compared with the non-supplemented condition (n=4). Unpaired two-tailed t-tests with Welch correction. Asterisks represent statistical significance *p < 0.01, ***p < 0.001, ****p < 0.0001. b. Relative Kat2a expression in 4T1 3D spheroids (5 days) with or without additional palmitate (75 μM), oleate (116 μM) or acetate (5 mM) (n =6). One-way ANOVA with Tukey’s multiple comparison test. c. Acetylated p65 (NF-κB p65ac) in nuclear extracts of 3D spheroids transduced with a lentiviral vector containing sgCpt1a, sgKat2a or sgcontrol, and cultured for 3 days in the presence of extra palmitate (75 μM) or the NF-κB inhibitor PDTC (0.5 μM). Histone H3 is shown as a loading control of NF-κB p65ac. A representative of n=3 experiments is shown. d. 3D spheroid growth of 4T1 cells silenced for Cpt1a or Kat2a compared to non-targeting sgRNA as a control, with or without extra palmitate (5 days). Data are presented as mean ± SEM (n ≥4). One-way ANOVA with Tukey’s multiple comparison test. e. 3D spheroid growth represented by the average spheroids area of >100 spheroids in MCF7 and MCF10A H-RasV12 cells upon pharmacologic inhibition of KAT2a using the inhibitor CPTH2 (5μM) cultured for 5 days with or without palmitate supplementation. is. Data are presented as mean ± SEM (n ≥4). One-way ANOVA with Tukey’s multiple comparison test. f. Metastatic burden in lungs of mice injected with 4T1 into the mammary fat pad (m.f.) upon genetic knockout of Cpt1a and Kat2a compared to non-targeting sgRNA as a control. Data are presented as mean ± SEM (n ≥11). Data for control and sgCpt1a are also shown in Figure 4c. One-way ANOVA with Dunnett ’s multiple comparison test. g. CPT1a and KAT2a protein expression in different metastasis sites of breast cancer patients 2004 and 2009 from the UPTIDER program. A representative of n=2 experiments is shown. h. Tumor secreted factors and high fat diet are two independent factors increasing palmitate levels in the lung environment. Metastasizing cancer cells use the available palmitate to drive p65 acetylation in a CPT1a dependent manner resulting in pro-metastatic NF-κB signaling.

Comment in

References

    1. Bergers G, Fendt SM. The metabolism of cancer cells during metastasis. Nature reviews Cancer. 2021;21:162–180. doi: 10.1038/s41568-020-00320-2. - DOI - PMC - PubMed
    1. Martin-Perez M, Urdiroz-Urricelqui U, Bigas C, Benitah SA. The role of lipids in cancer progression and metastasis. Cell metabolism. 2022;34:1675–1699. doi: 10.1016/j.cmet.2022.09.023. - DOI - PubMed
    1. Broadfield LA, Pane AA, Talebi A, Swinnen JV, Fendt SM. Lipid metabolism in cancer: New perspectives and emerging mechanisms. Dev Cell. 2021;56:1363–1393. doi: 10.1016/j.devcel.2021.04.013. - DOI - PubMed
    1. Altea-Manzano P, Cuadros AM, Broadfield LA, Fendt SM. Nutrient metabolism and cancer in the in vivo context: a metabolic game of give and take. EMBO Rep. 2020;21:e50635. doi: 10.15252/embr.202050635. - DOI - PMC - PubMed
    1. Peinado H, et al. Pre-metastatic niches: organ-specific homes for metastases. Nature Reviews Cancer. 2017;17:302–317. doi: 10.1038/nrc.2017.6. - DOI - PubMed

Publication types