. 2023 Mar;26(3):430-446.
doi: 10.1038/s41593-022-01251-x. Epub 2023 Feb 2.

Integrative in situ mapping of single-cell transcriptional states and tissue histopathology in a mouse model of Alzheimer's disease

Affiliations

Integrative in situ mapping of single-cell transcriptional states and tissue histopathology in a mouse model of Alzheimer's disease

Hu Zeng et al. Nat Neurosci. 2023 Mar.

Abstract

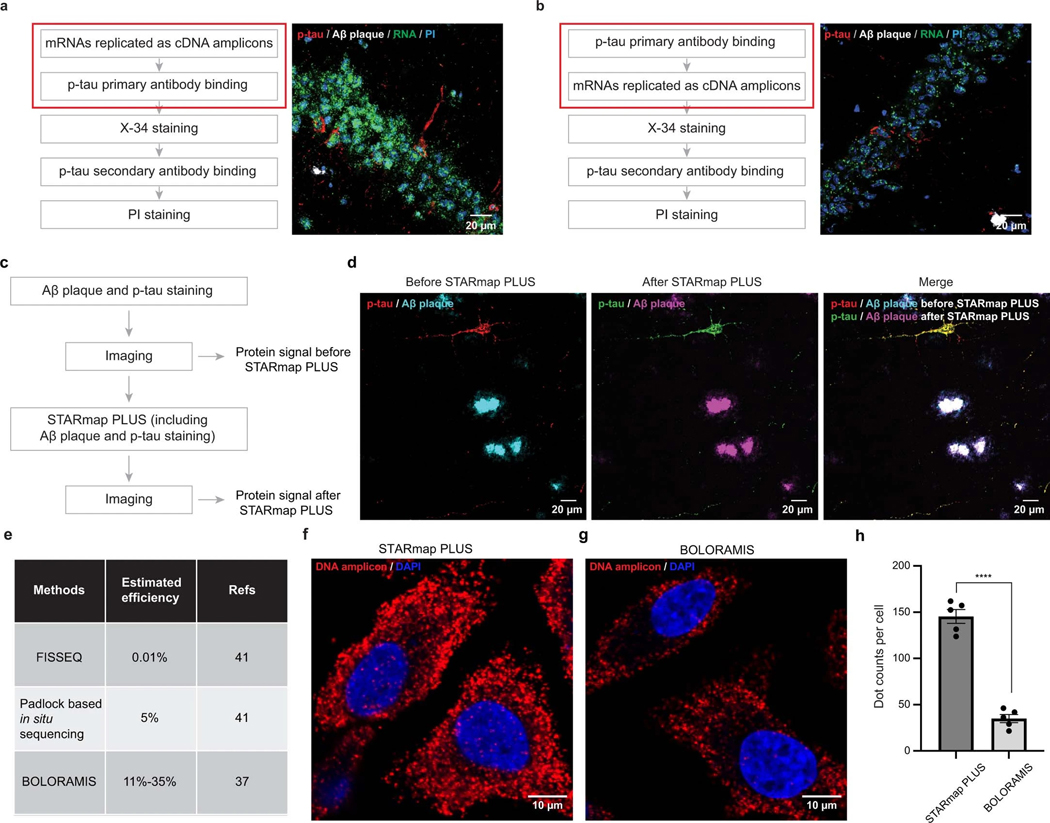
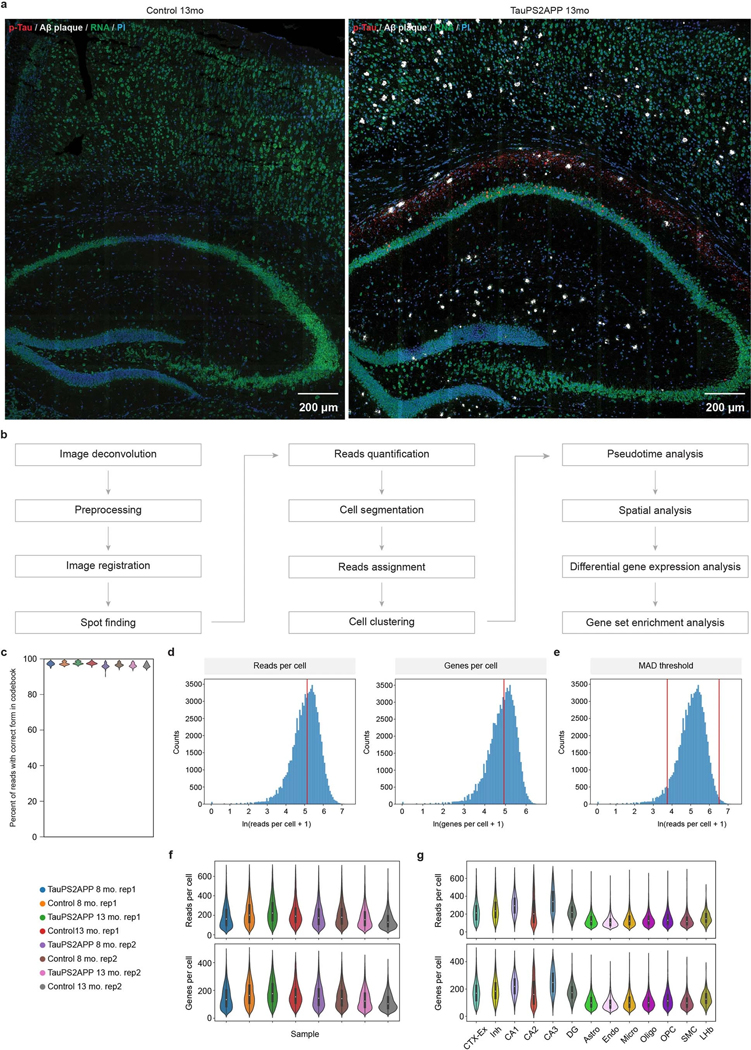
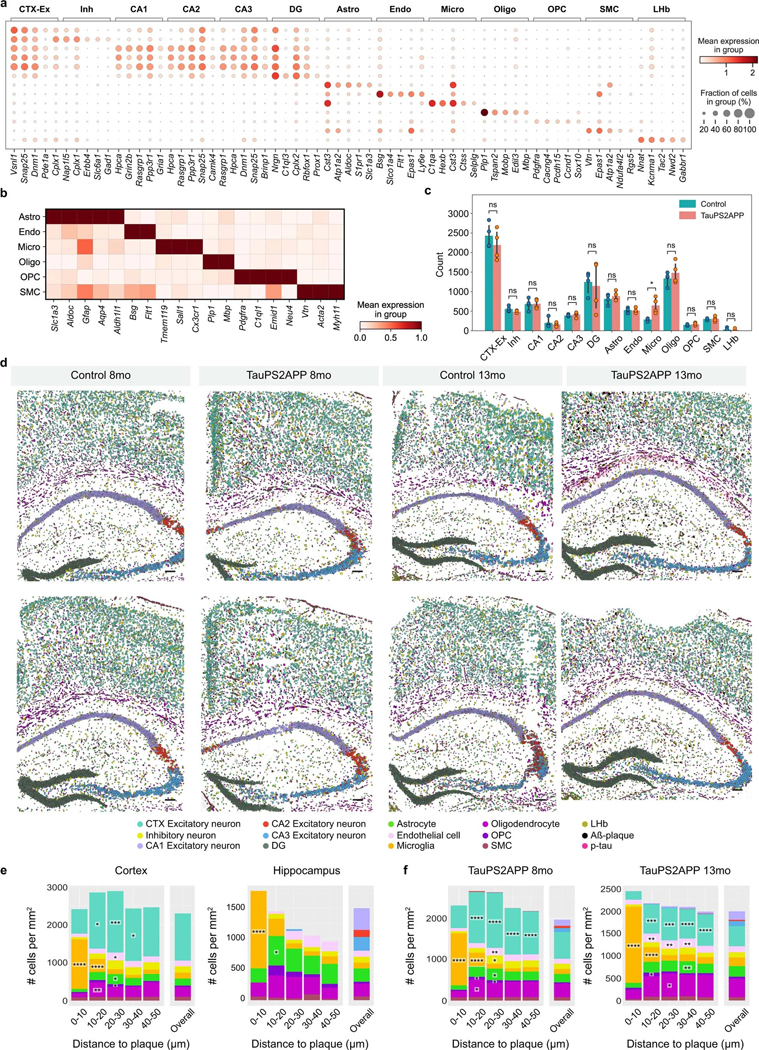
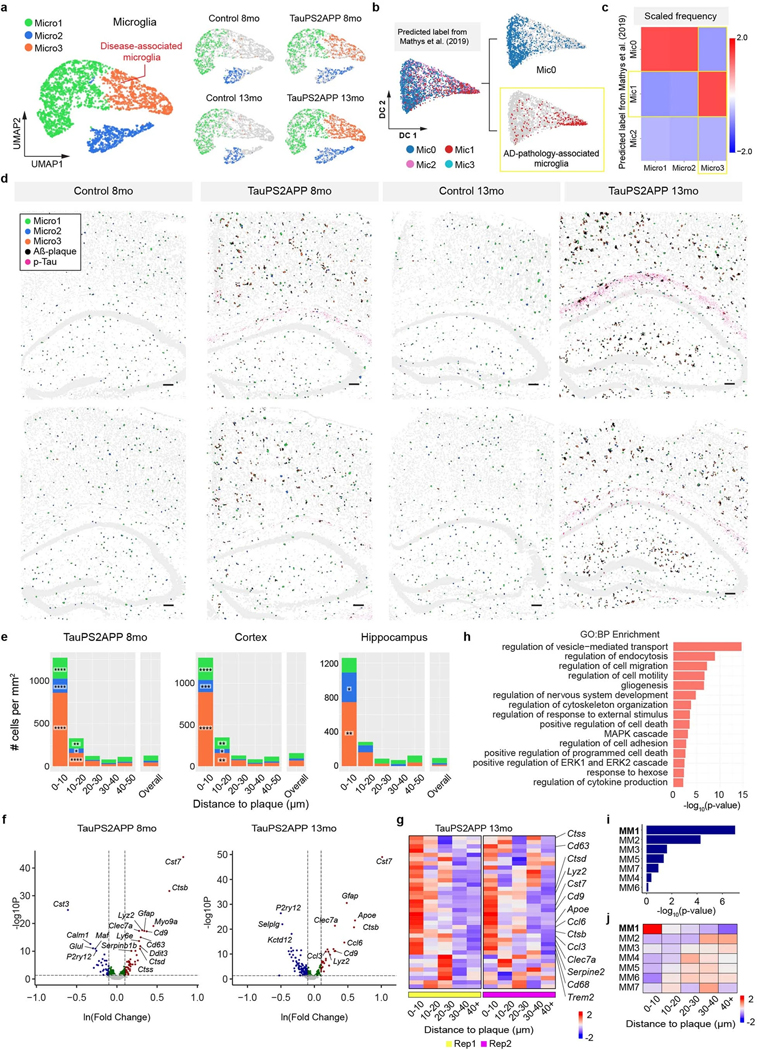
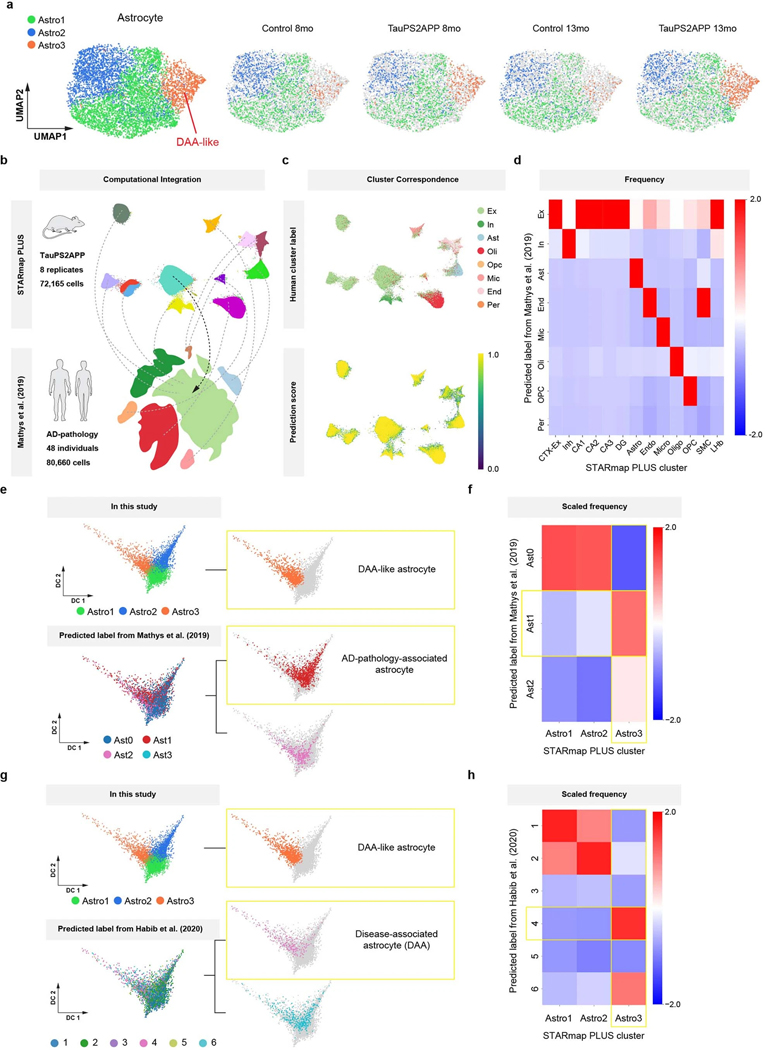
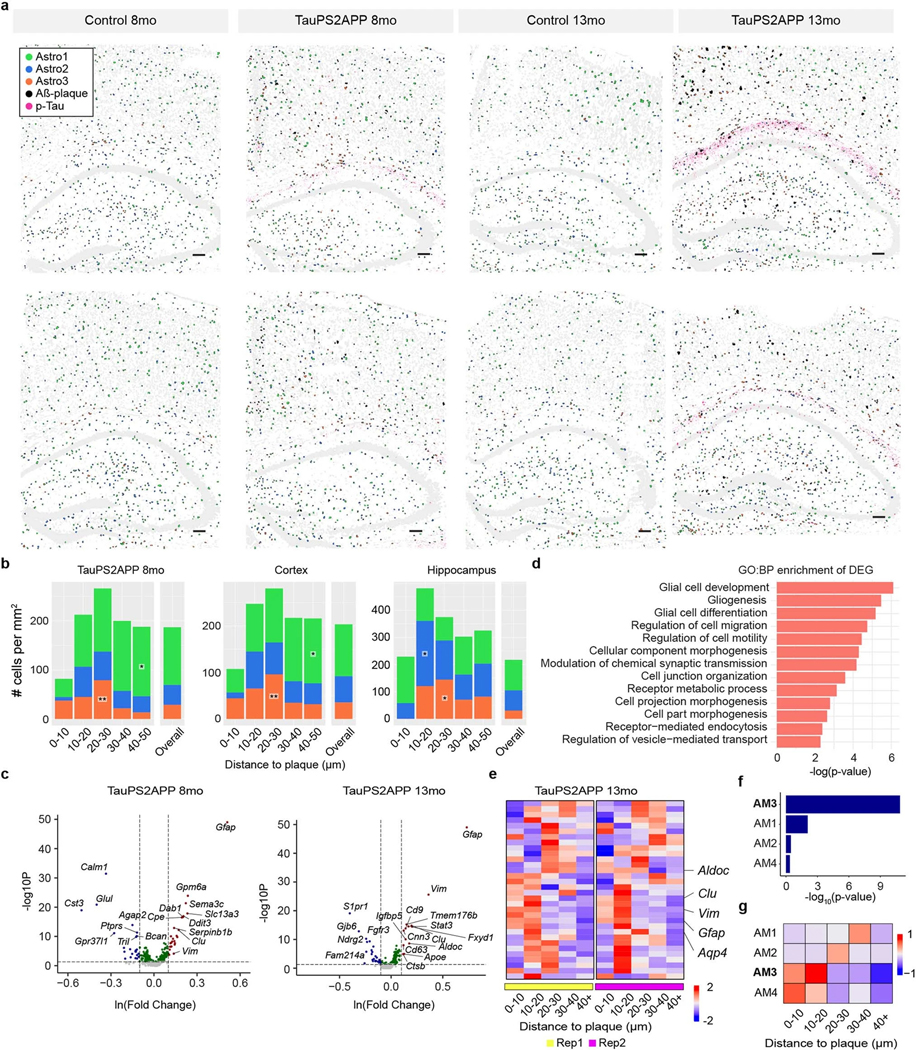
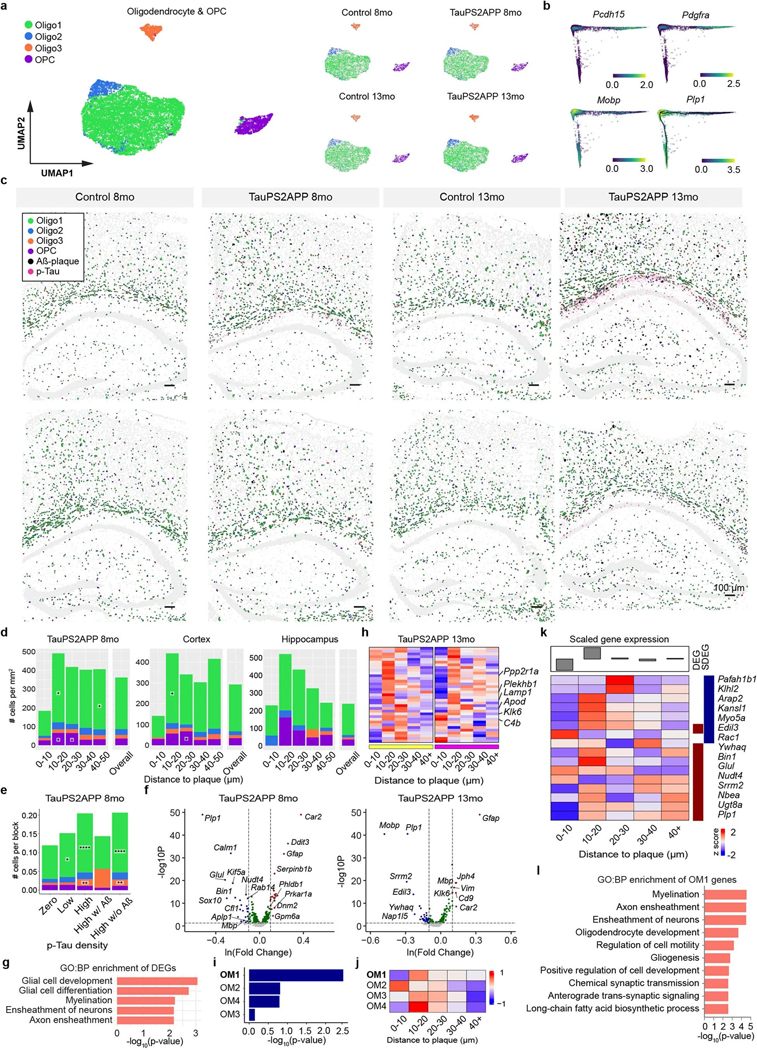
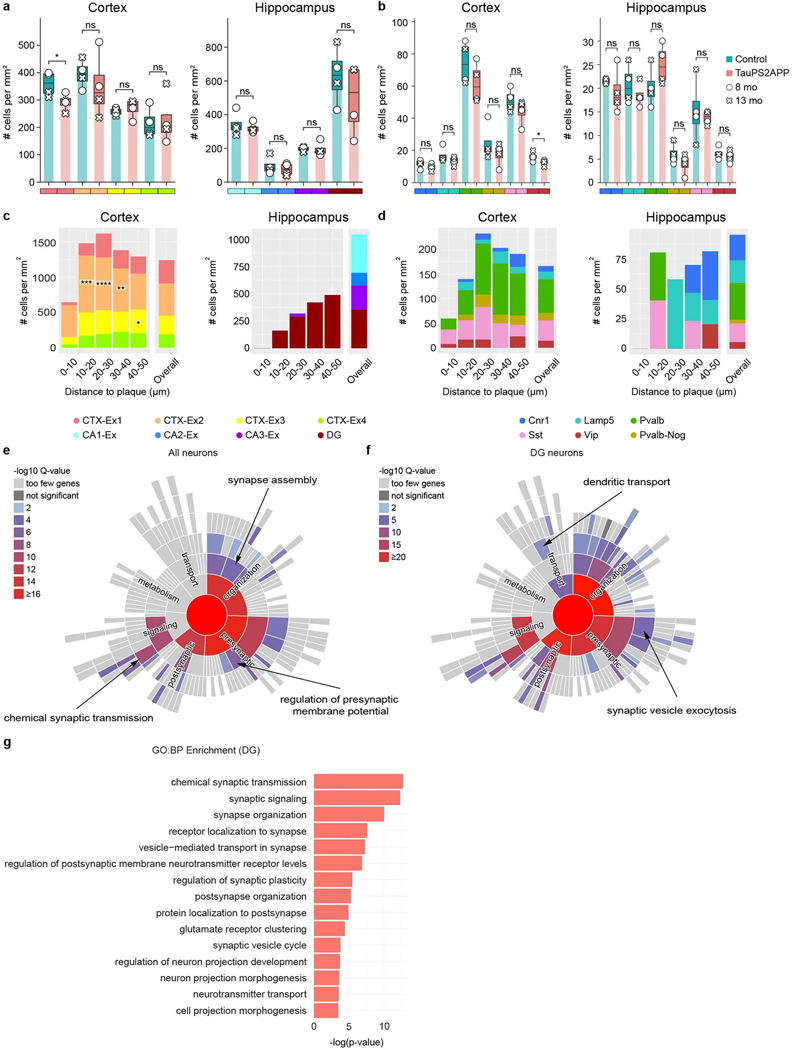
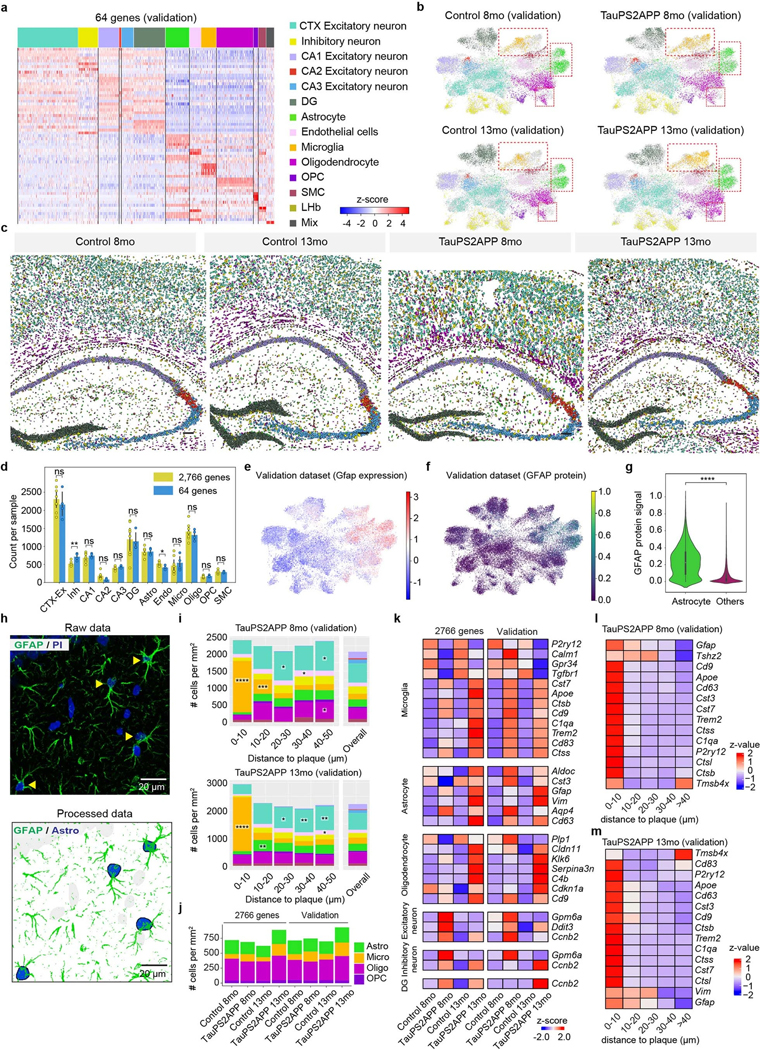
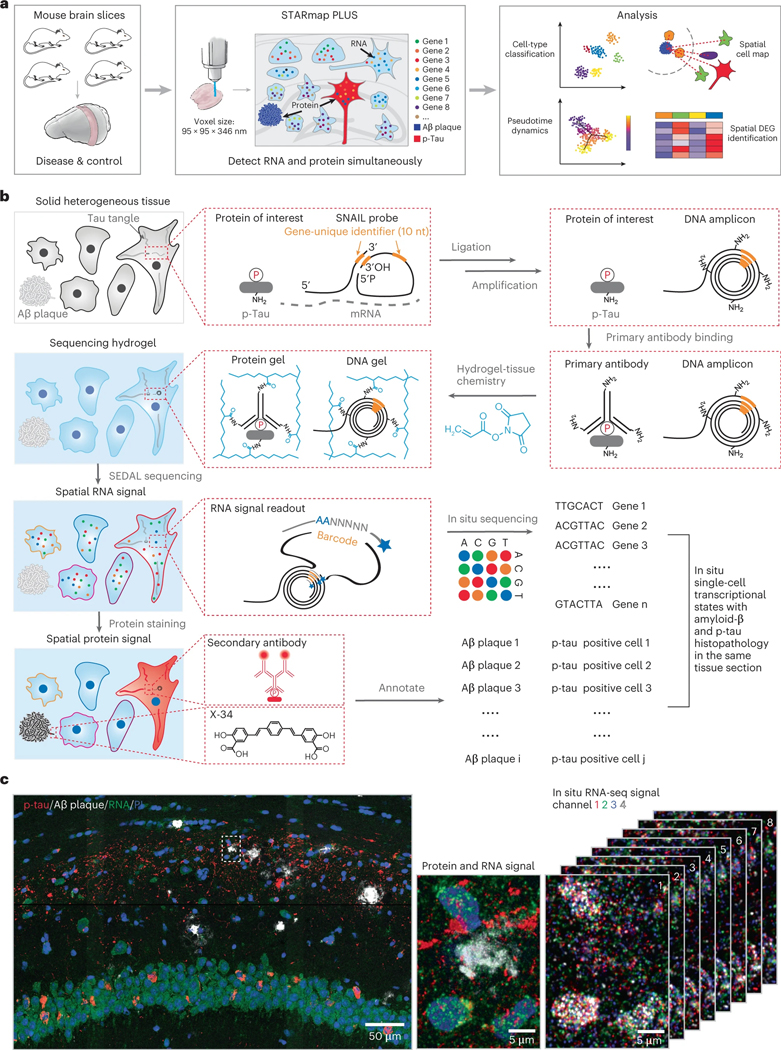
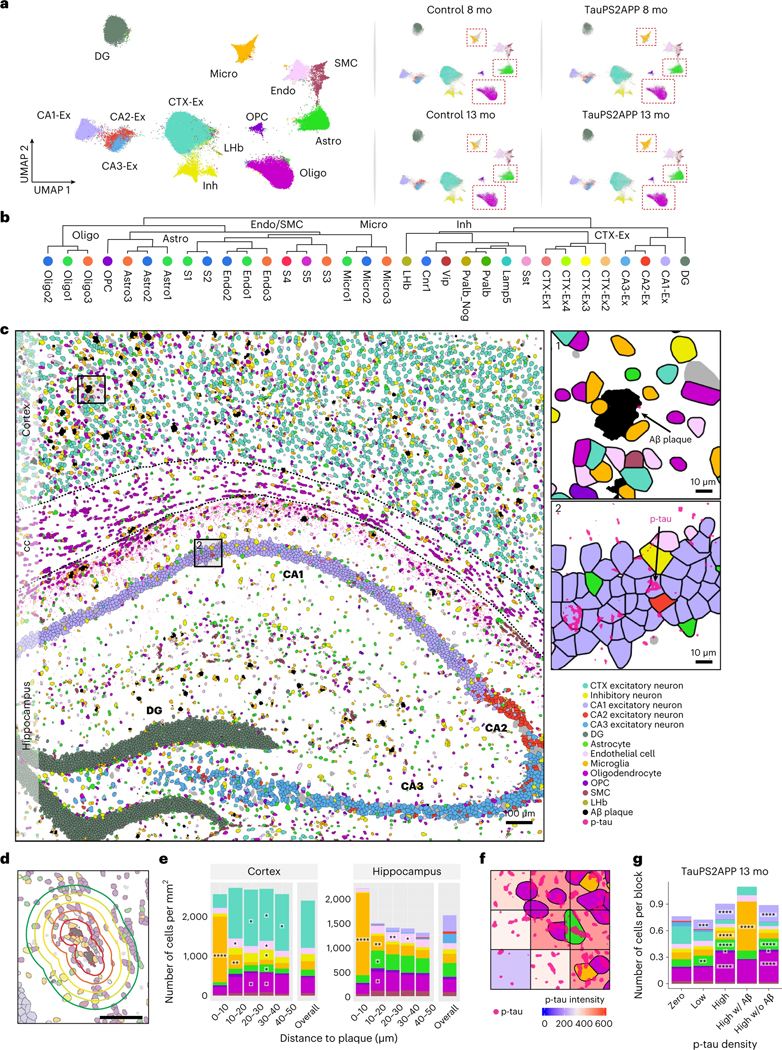
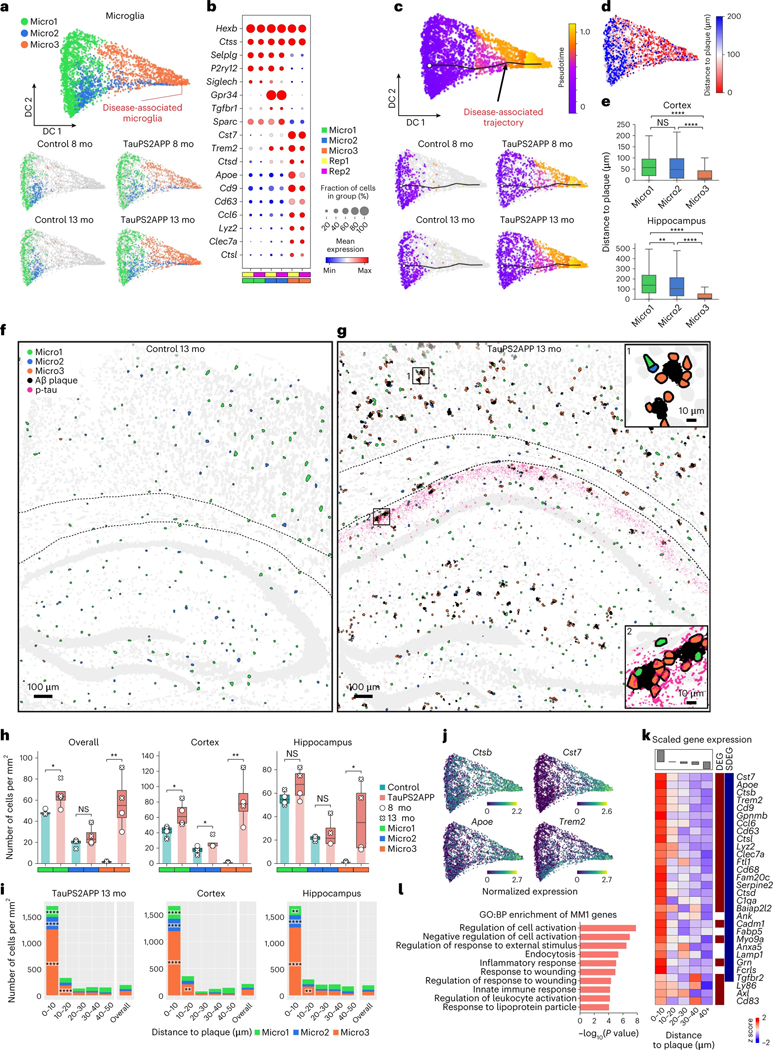
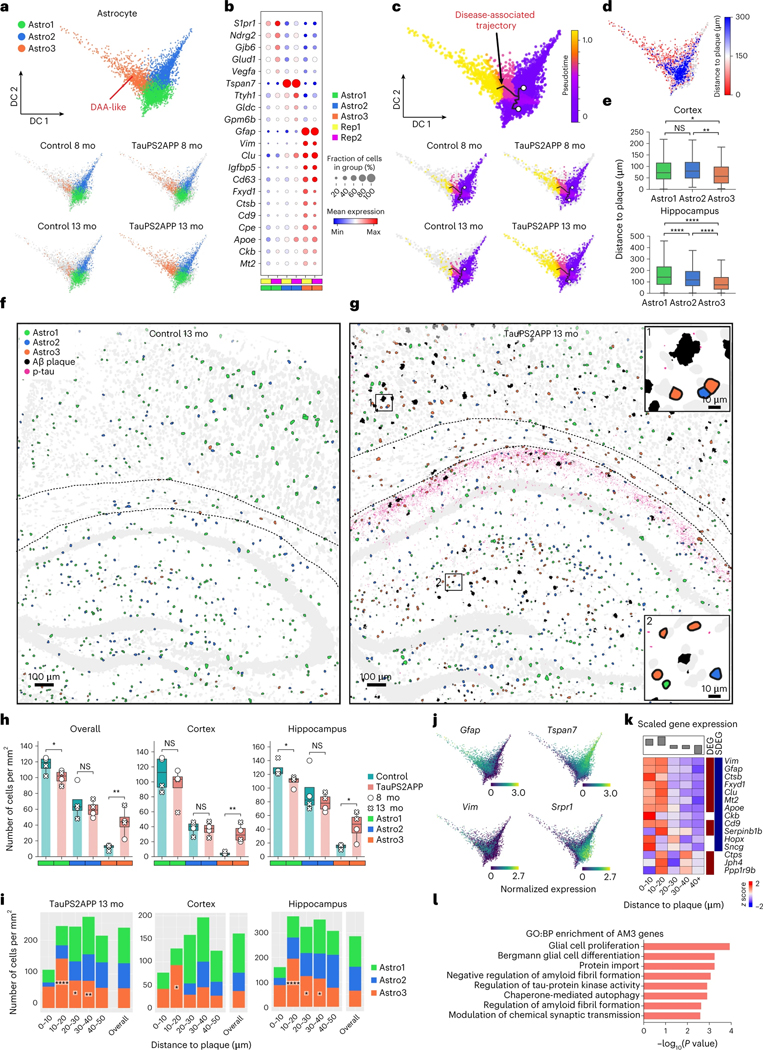
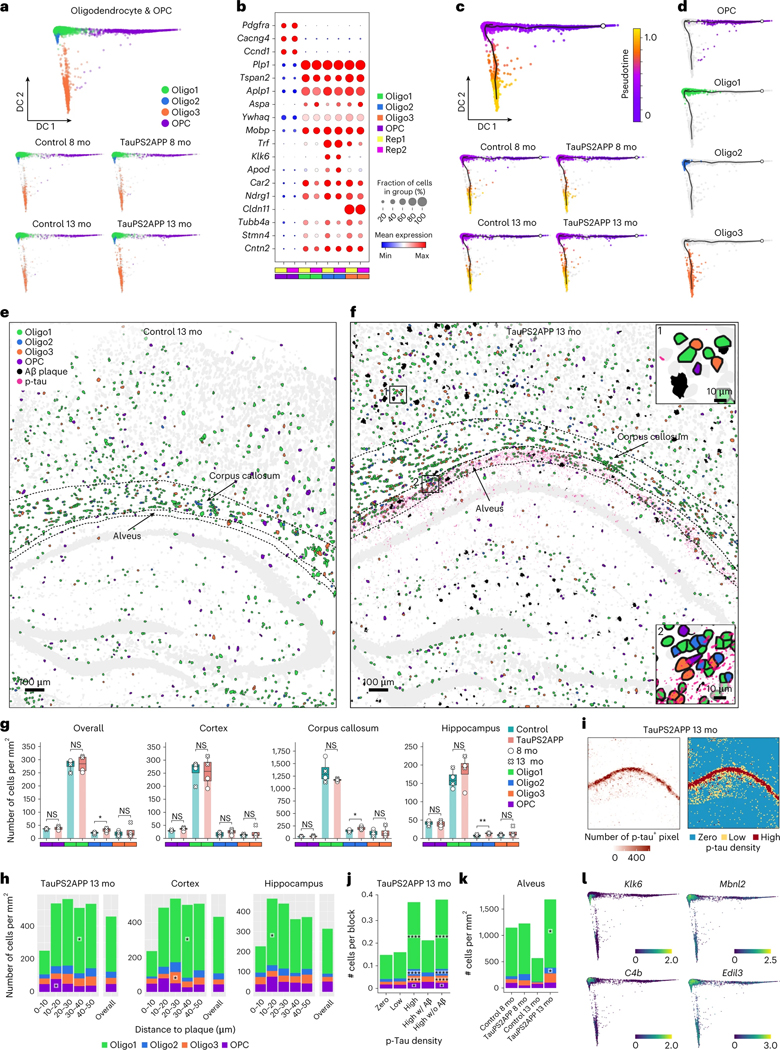
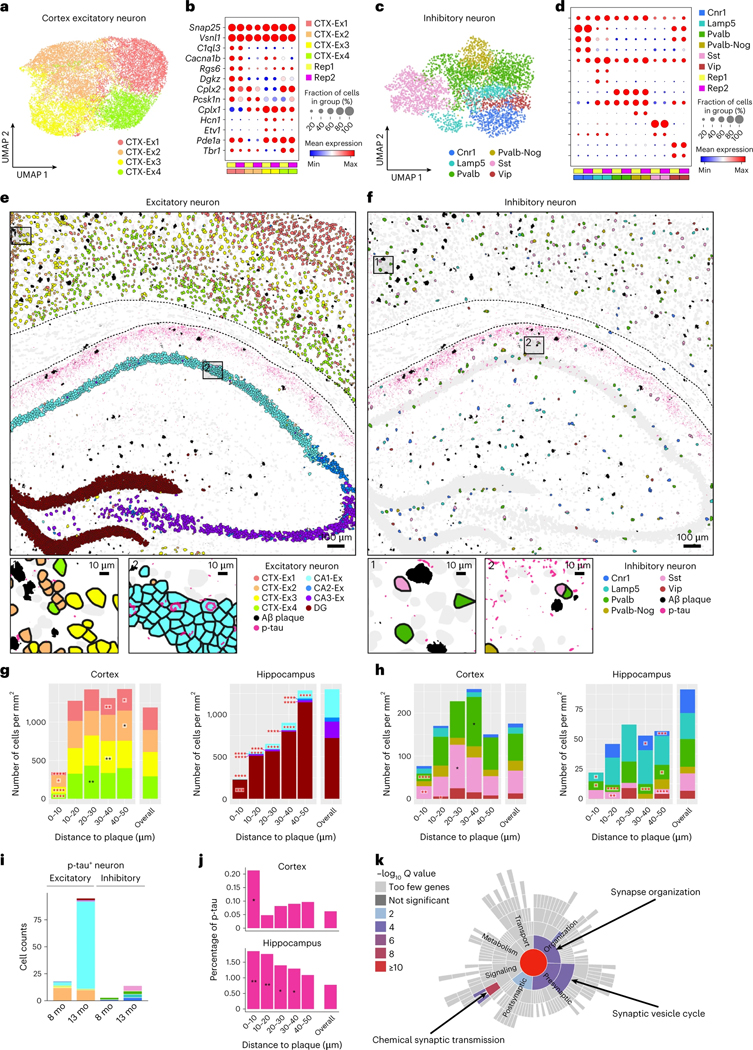
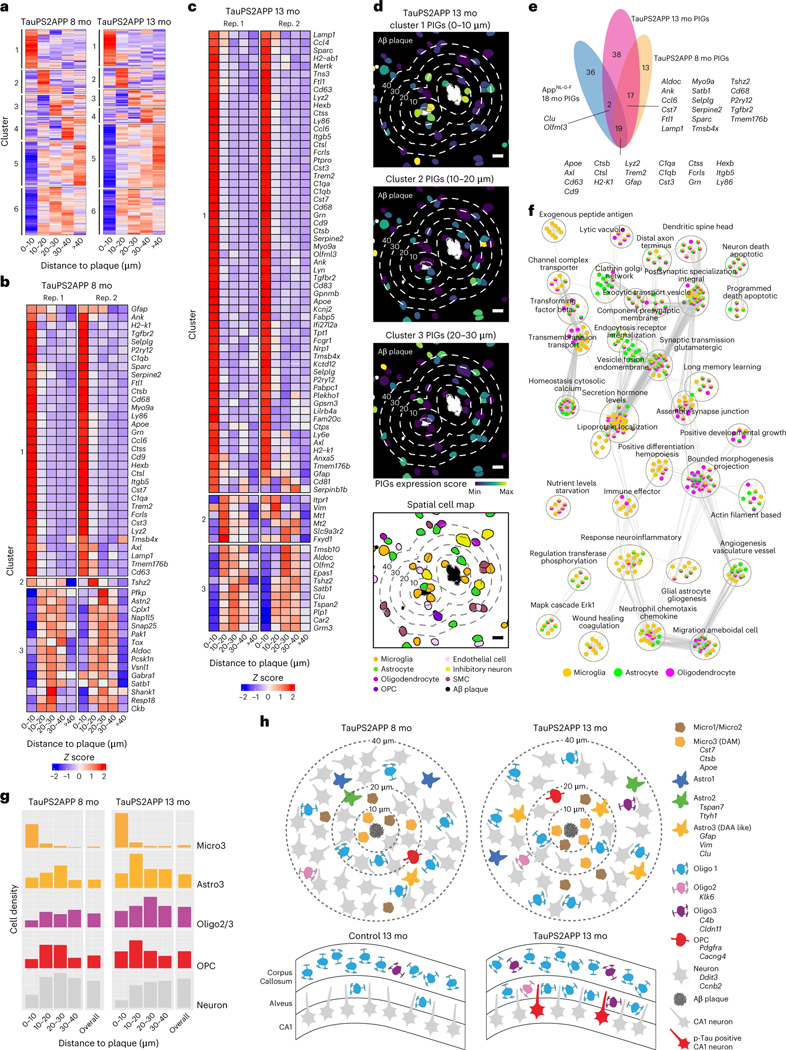
Complex diseases are characterized by spatiotemporal cellular and molecular changes that may be difficult to comprehensively capture. However, understanding the spatiotemporal dynamics underlying pathology can shed light on disease mechanisms and progression. Here we introduce STARmap PLUS, a method that combines high-resolution spatial transcriptomics with protein detection in the same tissue section. As proof of principle, we analyze brain tissues of a mouse model of Alzheimer's disease at 8 and 13 months of age. Our approach provides a comprehensive cellular map of disease progression. It reveals a core-shell structure where disease-associated microglia (DAM) closely contact amyloid-β plaques, whereas disease-associated astrocyte-like (DAA-like) cells and oligodendrocyte precursor cells (OPCs) are enriched in the outer shells surrounding the plaque-DAM complex. Hyperphosphorylated tau emerges mainly in excitatory neurons in the CA1 region and correlates with the local enrichment of oligodendrocyte subtypes. The STARmap PLUS method bridges single-cell gene expression profiles with tissue histopathology at subcellular resolution, providing a tool to pinpoint the molecular and cellular changes underlying pathology.


Conflict of interest statement

Competing interests

X.W., H.Z. and J.R. are inventors on pending patent applications related to STARmap PLUS. X.W. is a scientific cofounder of Stellaromics. M.S. is a scientific cofounder of Neumora and a former employee of Genentech. W.J.M., C. J. B. and S.-H.L. are present employees of Genentech. All the other authors declare no competing interests.

Figures

Extended Data Fig. 1 |
Extended Data Fig. 1 |. Development of the STARmap PLUS method.
a, Flow chart of STARmap PLUS procedure where p-tau primary antibody staining was performed after mRNA in situ hybridization and amplification. The imaging results showed strong signals from both cDNA amplicons and proteins (N = 2 independent experiments). b, Alternative procedure where the p-tau primary antibody staining was conducted before mRNA in situ hybridization and amplification. The imaging results showed a much weaker signal from cDNA amplicons, suggesting RNA degradation during antibody incubation and washing steps (N = 2 independent experiments). PI staining, propidium iodide staining of cell nuclei. c, Schematic diagram of the experimental design to test if the tissue retains the same structure after STARmap PLUS. d, The imaging result before STARmap PLUS (left), after STARmap PLUS (middle), and overlay (right) of p-tau and Aβ-plaque signals were recorded (N = 2 independent experiments). e, Summary of the detection efficiency of RCA-based spatial transcriptomics methods. The efficiency of FISSEQ and padlock based in situ sequencing was extracted from Lein et al., and the efficiency of BOLORAMIS was extracted from Liu et al. . f,g, The ACTB mRNA signal detected by STARmap PLUS (f) and BOLORAMIS37 (g) in Hela cells. h, Quantification of the number of DNA amplicons per cell identified by STARmap PLUS and BOLORAMIS. Error bars, standard deviation. Data are presented as mean ± s.e.m, n = 5 images per condition. Two-sided Student’s t-test, ****P = 1.39×10⁻⁶.
Extended Data Fig. 2 |
Extended Data Fig. 2 |. Data processing and quality control of the STARmap PLUS data analysis pipeline.
a, Examples showing the final imaging cycle detecting cell nuclei, cDNA amplicons, and protein signals in the 13-month control (left, N = 2 independent animals) and TauPS2APP (right, N = 2 independent animals) mouse brain samples. Blue, Propidium Iodide (PI) staining of cell nuclei. Green, fluorescent DNA probe staining of all cDNA amplicons. White, X-34 staining of Amyloid β plaque. Red, immunofluorescent staining of p-tau (AT8 primary antibody followed by fluorescent goat anti-mouse secondary antibody). b, The flowchart of the STARmap PLUS data analysis pipeline. c, Violin plot showing the accuracy (correct rate) of SEDAL sequencing for each FOV for all samples (96.87% ± 5.00%). d, Histograms showing the ln-transformed number of transcripts (left) and genes (right) per cell in the 2,766-genes dataset before quality control. Red vertical lines represent median values. e, Histogram showing the number of transcripts after logarithmic transformation in the 2,766-genes dataset. Red vertical lines represent the filtering thresholds estimated by median absolute deviation (MAD). f, Number of transcripts and genes across samples. Violin plots showing the distribution of the number of reads per cell (top) and genes per cell (bottom) detected in each sample after quality control (N = 72,165 cells). Box plots depict the median (center) and interquartile range (IQR, bounds of the box), with whiskers extending to either the maxima/minima or to the median ± 1.5× IQR, whichever is nearest. g, Number of transcripts and genes across major cell types. Violin plots showing the distribution of the number of reads per cell (top) and genes per cell (bottom) detected in each major cell type (N = 72,165 cells). Box plots as in (f).
Extended Data Fig. 3 |
Extended Data Fig. 3 |. Classification and spatial distribution of major cell types.
a, Dot plot showing the expression level of top five representative gene markers of each major cell type. b, Matrix plot showing the averaged expression level of canonical gene markers for each glial cell type of the 2,766-genes dataset. Values are normalized for each gene. c, Barplot showing the number of cells per cluster in Control and TauPS2APP mice. Data are represented as mean with 95% CI. Asterisks denote significant differences between Control and TauPS2APP (n = 4 samples per condition, two-sided *P < 0.05, t-test for two independent samples). d, Spatial atlas of top-level cell types in cortex and hippocampus regions of eight samples in the 2,766-gene dataset. Scale bars, 100 μm. e, Representative spatial distribution of cell-type compositions around Aβ plaque for TauPS2APP eight-month samples in both cortex and hippocampus. Stacked bar plot showing the density of each major cell type at different distance intervals to the Aβ plaque. The cell density of each major cell type in each area was included as the reference for comparison (overall). Asterisks denote significantly enriched cell types in each distance interval. One-sided one-sample t-Test, *P < 0.05, **P < 0.01, ***P < 0.001, ****P < 0.0001 vs. overall cell density. f, Cell-type composition around Aβ plaque at different distance intervals in both eight- and 13-month samples of the 2,766-gene dataset. Stacked bar plot showing the averaged density of major cell types in the cortex and hippocampus from different distance intervals around the Aβ plaque. The overall cell density of each cell type in each region was included as the reference for comparison (overall). Asterisks denote significantly enriched cell types in each distance interval. One-sided one-sample t-test, *P < 0.05, **P < 0.01, ***P < 0.001, ****P < 0.0001 vs. overall cell density.
Extended Data Fig. 4 |
Extended Data Fig. 4 |. Additional gene expression and spatial analysis of microglia.
a, UMAP showing three subclusters of 3,732 microglia cells across different samples. b, Diffusion maps showing the subpopulation identified by predicted labels generated by the CCA integration with the astrocyte population from Mathys et al. Cells labeled as Mic0 and Mic1 from Mathys et al. were plotted separately for comparison. c, Heatmap showing the proportions (color bar, scaled per column) of microglia cluster IDs from Mathys et al. (rows) mapped to STARmap PLUS microglia subpopulations (columns). Cells were excluded if their label prediction score were less than 0.5. d, Spatial map of microglia subtypes in control and TauPS2APP samples. Scale bars, 100 μm. e, Cell-type composition around Aβ plaque in different distance intervals for the TauPS2APP samples at eight months. Stacked bar plot showing the density of each microglia subpopulation in each distance interval around the Aβ plaque. Asterisks denote significantly enriched microglia subtypes in each distance interval. One-sided one-sample t-test, *P < 0.05, **P < 0.01, ***P < 0.001, ****P < 0.0001 vs. overall cell density. f, Volcano plots showing the differentially expressed genes (DEG) of microglia in TauPS2APP and control comparisons at eight- and 13-month time point (y-axis: -log adjusted p-value, x-axis: average log fold change). The two-sided Wilcoxon rank-sum test. Genes (p-value < 0.05, absolute value of lnFC > 0.1) are marked in red (up-regulated) or blue (down-regulated). g, Matrix plot showing the z-scores of SDEGs of microglia across multiple distance intervals from plaques. h, Gene ontology enrichment analysis (Fisher’s one-sided test) results of DEGs in microglia of the 13-month TauPS2APP samples. i, Barplots showing the DEG enrichment significance (the Chi squared test) of co-expression modules of microglia identified by scWGCNA. The gene module with the most significant DEG enrichment (MM1) is highlighted. j, Matrix plot showing the averaged z-score value of microglia gene modules across multiple distance intervals.
Extended Data Fig. 5 |
Extended Data Fig. 5 |. Identification of disease-associated astrocyte populations in TauPS2APP mouse model through comparative studies with other AD mouse models and human patient samples.
a, UMAP showing three subclusters of 6,789 astrocytes across samples. b, Schematic plot showing the basic idea of CCA integration and label transfer. In total, 72,165 cells from TauPS2APP and control mice were integrated with 80,660 cells from 48 human individuals with or without AD pathology in Mathys et al. c, UMAPs showing the predicted labels (top) and scores (bottom) of STARmap PLUS cells generated by the CCA integration with cells from Mathys et al. d, Heatmap showing the proportions (color bar, scaled per column) of cluster IDs from Mathys et al. (rows) mapped to STARmap PLUS cells (columns). Cells were excluded if their label prediction score were less than 0.5. e, Diffusion maps showing the subpopulation identified by the present study (top) and predicted labels generated by the CCA integration with the astrocyte population from Mathys et al. (bottom). f, Heatmap showing the proportions (color bar, scaled per column) of astrocyte cluster IDs from Mathys et al. (rows) mapped to STARmap PLUS astrocyte subpopulations (columns). Cells were excluded if their label prediction score were less than 0.5. g, Diffusion maps showing the subpopulation identified by the present study (top) and predicted labels generated by the CCA integration with the astrocyte population from Habib et al. (bottom). h, Heatmap showing the proportions (color bar, scaled per column) of astrocyte cluster IDs from Habib et al. (rows) mapped to STARmap PLUS astrocyte subpopulations (columns). Cells were excluded if their label prediction score were less than 0.5.
Extended Data Fig. 6 |
Extended Data Fig. 6 |. Additional gene expression and spatial analysis of astrocytes.
a, Spatial map of astrocyte subtypes in control and TauPS2APP samples. Scale bars, 100 μm. b, Cell-type composition around Aβ plaque in different distance intervals for the TauPS2APP samples at eight months. Stacked bar plot showing the density of each astrocyte subpopulation in each distance interval around the Aβ plaque. The overall cell density of each subpopulation in each region was included as the reference for comparison. Asterisks denote significantly enriched astrocyte subclusters in each distance interval. One-sided one-sample t-test, *P < 0.05, **P < 0.01 vs. overall cell density. c, Volcano plots showing the differentially expressed genes of astrocytes in AD and control comparison at eight and 13 months (y-axis: -log adjusted p-value, x-axis: average log fold change). The two-sided Wilcoxon rank-sum test. Genes (p-value < 0.05, absolute value of lnFC > 0.1) are marked in red (up-regulated) or blue (down-regulated). d, Gene ontology enrichment analysis (Fisher’s one-sided test) results of DEGs in astrocytes of the 13-month TauPS2APP samples. e, Matrix plot showing the z-scores of SDEGs of microglia across multiple distance intervals from plaques. f, Barplots showing the DEG enrichment significance (the Chi squared test) of co-expression modules of astrocyte identified by scWGCNA. The gene module with the most significant DEG enrichment (AM3) is highlighted. g, Matrix plot showing the averaged z-score value of astrocyte gene modules across multiple distance intervals.
Extended Data Fig. 7 |
Extended Data Fig. 7 |. Additional gene expression and spatial analysis of oligodendrocytes and OPC.
a, UMAP showing subclusters of 11,265 oligodendrocytes and 1,269 OPCs across samples. b, Diffusion map showing the normalized expression level of oligodendrocyte lineage marker genes in oligodendrocytes and OPCs. c, Cell-resolved spatial map for the oligodendrocyte and OPC population of control and TauPS2APP mice. Scale bars, 100 μm. d, Cell type composition around Aβ plaque in different distance intervals for the TauPS2APP samples at eight months. Stacked bar plot showing the density of each oligodendrocyte subpopulation and OPC in each distance interval around the Aβ plaque. Asterisks denote significantly enriched oligodendrocyte subclusters and OPC in each distance interval. One-sided one-sample t-test, *P < 0.05 vs. overall cell density. e, Cell compositions in grid regions with different Tau positive pixel percentage of the TauPS2APP samples at eight months: zero (0%), low (50%), high (100%). One-sided one-sample t-test, *P < 0.05, **P < 0.01, ****P < 0.0001 vs. zero p-tau bin. f, Volcano plots showing DEGs of oligodendrocyte in AD and control comparison at eight and 13 months (y-axis: -log adjusted p-value, x-axis: average log fold change). The two-sided Wilcoxon rank-sum test. Genes (p-value < 0.05, absolute value of lnFC > 0.1) are marked in red (up-regulated) or blue (down-regulated). g, Gene ontology enrichment analysis (Fisher’s one-sided test) results of DEGs in oligodendrocytes of the 13-month TauPS2APP samples. h, Matrix plot showing the z-scores of spatial DEGs of oligodendrocytes across multiple distance intervals from plaques. i, Barplots showing the DEG enrichment significance (the Chi squared test) of co-expression modules of astrocyte identified by scWGCNA. The gene module with the most significant DEG enrichment (AM3) is highlighted. j, Matrix plot showing the averaged z-score value of astrocyte gene modules across multiple distance intervals. k, Matrix plot showing the z-scores of DEGs or SDEGs in the disease-associated gene module of oligodendrocytes in each distance interval around the Aβ plaque in TauPS2APP 13-month sample. The total averaged scaled expression level in different distance intervals was visualized by the bars on top of the matrix plots. l, Gene ontology enrichment analysis (Fisher’s one-sided test) results of disease-associated gene module in oligodendrocytes.
Extended Data Fig. 8 |
Extended Data Fig. 8 |. Spatial maps for neuron populations of control and TauPS2APP mice.
a, Cell-resolved spatial map for the excitatory neuron of control and TauPS2APP mice. Scale bars, 100 μm. b, Cell-resolved spatial map for the inhibitory neuron population of control and TauPS2APP mice. Scale bars, 100 μm.
Extended Data Fig. 9 |
Extended Data Fig. 9 |. Additional gene expression and spatial analysis of neurons.
a,b, Boxplot showing the density (number of cells per mm2) of each excitatory neuron subcluster (a) and inhibitory neuron subcluster (b) in the cortex and hippocampus region in Control and TauPS2APP mice at two time points in eight independent samples. Box, 75% and 25% quantiles. Line, median. Dots or forks, individual samples. Student’s t-test, one-sided *P < 0.05. c,d, Neuron composition around the plaque. Stacked bar charts showing the density (number of cells per mm2) of each subcluster of excitatory (c) and inhibitory (d) neuron population from different brain regions at each different distance intervals (0–10, 10–20, 20–30, 30–40, 40–50 μm) to the Aβ plaque from the cortex and hippocampus region of TauPS2APP eight-month sample. The cell density of each subpopulation in each area was included as the reference for comparison (Overall). Asterisks denote significantly enriched neuron subclusters in each distance interval. One-sided one-sample t-test, *P < 0.05, **P < 0.01, ***P < 0.001, ****P < 0.0001 vs. overall cell density. e,f, Synaptic gene ontology term enrichment of DEGs (p-value < 0.05) identified in the TauPS2APP and Control comparison for all neuron population (e) and neurons in the dentate gyrus region (f) using SynGO. Color of the sunburst plot represents -log10 Q-value at 1% FDR. g, Gene ontology enrichment analysis (Fisher’s one-sided test) results of DEGs in dentate gyrus neurons of the 13-month TauPS2APP samples.
Extended Data Fig. 10 |
Extended Data Fig. 10 |. Validation of cell-type composition and spatial gene expression in TauPS2APP mice.
a, Gene expression heatmaps for representative markers aligned with each top-level cell type of 64-gene (validation) datasets. Expression for each gene is z-scored across all genes in each cell. b, UMAP plot visualizing a non-linear dimensionality reduction for the transcriptomic profiles of 36,625 cells from four samples of the validation dataset. Cells are colored as in (a). c, Spatial atlas of top-level cell types in cortex and hippocampus regions of four samples in the 64-gene dataset. Scale bars, 100 μm. d, Barplot showing the number of cells per top-level cluster in 2,766-genes and 64-genes datasets. Data are represented as mean with 95% CI. Student’s t-test, two-tailed *P < 0.05, **P < 0.01. e,f, UMAPs showing the Gfap gene expression (e) and normalized GFAP protein signal (f) in 64-genes validation dataset. g, Violin plot shows the normalized GFAP protein signal level in the astrocyte cell population (N = 3,423 cells) compared to others (N = 33,202 cells). Box plots depict the median (center) and interquartile range (IQR, bounds of the box), with whiskers extending to the maxima/minima or to the median ± 1.5× IQR. Two-sided t-test, ****P < 0.0001. h, Representative immunofluorescence images in the brain section of 64-gene validation samples (N = four independent animals). Astrocytes were marked by yellow arrows in the raw data. i, Cell-type composition around Aβ plaque at different distance intervals in both eight- and 13-month samples of the 64-gene validation dataset. Asterisks denote significantly enriched cell types in each distance interval. One-sided one-sample t-test, *P < 0.05, **P < 0.01, ***P < 0.001, ****P < 0.0001 vs. overall cell density. j, Barplot showing the cell density of astrocyte, microglia, oligodendrocyte and OPC in hippocampus alveus region in the 2,766- gene samples and validation samples. k, Matrix plot showing the row-wise scaled expression values of top significantly altered (rank by p-value) DEGs of glial cells and neuronal cells from TauPS2APP versus control samples. l,m, Matrix plot showing PIG that overlapped with 64-gene in each distance interval around the Aβ plaque in the eight-month (l) and TauPS2APP 13-month sample (m) of the 64-gene validation dataset. Colored by row-wise z-score.
Fig. 1 |
Fig. 1 |. Simultaneous mapping of cell types, single-cell transcriptional states and tissue histopathology by STARmap PLUS.
a, Overview of STARmap PLUS, an integrative in situ method, capable of simultaneously mapping thousands of RNA species and protein disease markers in the same intact 3D tissue at subcellular resolution. b, Schematics of STARmap PLUS. After the brain tissue is retrieved and fixed, the intracellular mRNAs are targeted by a pair of SNAIL (specific amplification of nucleic acids via intramolecular ligation) probes, which are then enzymatically ligated and amplified to generate amine-modified cDNA amplicons in situ. Meanwhile, protein markers are labeled with primary antibodies. Next, tissues with amine-modified cDNA amplicons, proteins and primary antibodies are modified by acrylic acid N-hydroxysuccinimide ester (AA-NHS) and copolymerized with acrylamide to generate a hydrogel-tissue hybrid that fixes the locations of biomolecules for in situ mapping. Each cDNA amplicon contains a gene-specific identifier sequence (orange) that can be readout through in situ sequencing with error reduction by dynamic annealing and ligation (SEDAL). Lastly, fluorescent protein stainings (secondary antibody and small-molecule dye X-34 stainings) were applied to visualize protein signals. c, Representative images showing the simultaneous mapping of cell nuclei, cDNA amplicons and protein signals in the brain slice from a 13-month-old TauPS2APP mouse. Left: The 3D projection of the raw confocal fluorescence image of the CA1 region of the hippocampus. Middle: A zoom-in view of the dashed box in the left panel, which shows the last cycle of tissue histopathology imaging that detects both protein and cDNA amplicon: red, immunofluorescent staining of p-tau; white, X-34 staining of Aβ plaque; green, fluorescent DNA probe staining of all cDNA amplicons; and blue, PI staining of cell nuclei. Right: eight cycles of in situ RNA sequencing of the view in the middle panel; each color represents a fluorescent channel in one round of in situ sequencing.
Fig. 2 |
Fig. 2 |. Top-level cell type classification and spatial analysis in the brain slices of TauPS2APP and control mice.
a, UMAP plots showing 13 major cell types identified in the transcriptional profiles of 72,165 cells collected from eight coronal brain sections of TauPS2APP and control mice at 8 and 13 months. b, Hierarchical taxonomy dendrogram showing two levels annotation of the 13 top-level clusters and 33 sublevel clusters (subclusters). Cell type annotation was assigned to each cluster according to its representative gene markers compared to the rest of the cells. c, Representative spatial cell type atlas with Aβ and tau pathologies in cortical and hippocampal regions of TauPS2APP 13-month sample (n = 2 independent animals). The imaging area was separated into the cortex, corpus callosum (cc) and hippocampus manually with expert annotation, and the boundaries were marked by black dash lines. Zoom-in sections in the cortical region and the hippocampal region with p-tau protein signal. d, A Schematic illustrating the spatial patterns analysis of cell type compositions around the Aβ plaque. Scale bar, 50 μm. e, Representative spatial distribution of cell type compositions around Aβ plaque for TauPS2APP 13-month samples. Stacked bar plot showing the density (cell count per mm2) of each major cell type at different distance intervals (0–10, 10–20, 20–30, 30–40 and 40–50 μm) to the Aβ plaque. The cell density of each major cell type in each area was included as the reference for comparison. Asterisks denote significantly enriched cell types in each distance interval. One-sided one-sample t-test, *P < 0.05, **P < 0.01, ****P < 0.0001 versus overall cell density. f, Schematics illustrating the method used for p-tau signal quantification. g, Cell type composition analysis based on the 20 × 20 μm grid in the TauPS2APP samples at 13 months ranked by p-tau density. Stacked bar plot showing the average number of cells per block for each major cell type. Asterisks denote significantly enriched cell types in each p-tau density bin compared to the zero p-tau bin. One-sided one-sample t-test, *P < 0.05, **P < 0.01, ***P < 0.001, ****P < 0.0001 versus zero p-tau bin.
Fig. 3 |
Fig. 3 |. Spatiotemporal gene expression analysis of microglia in TauPS2APP and control samples.
a, Diffusion map visualization of 3,732 microglia cells across different samples. b, Dot plot showing the expression level of representative gene markers among different microglia subclusters. c, Diffusion map with pseudotime trajectory visualization of microglia population across different samples generated by Monocle3 (ref. ). Colormap represents the pseudotime value and the root of the trajectory was marked by the white dot. d, Diffusion map plots showing the distance from each microglia cell to the closest plaque. e, Boxplot showing the distribution of the distance from each microglia to the closest plaque nearby among microglia subtype populations in the cortex (n = 1,248) and hippocampus regions (n = 1,206 cells). Box, 75% and 25% quantiles. Line, median. Whisker, the maxima/minima or to the median ± 1.5× IQR. Two-sided t-test, **P < 0.01, ****P < 0.0001. f, g, Spatial cell maps of microglia in the 13-month control (f) and TauPS2APP (g) samples. Insets show zoom-in regions (1, 2). Dashed black lines mark the boundaries between the cortex, cc and hippocampus. h, Boxplot showing the density of each microglia subcluster in all the eight sections (left), the cortex region (middle) and the hippocampus region (right) in control and TauPS2APP mice at two different time points. Box, 75% and 25% quantiles. Line, median. Dots, individual samples. One-sided t-test. *P < 0.05, **P < 0.01. i, Stacked bar charts showing the density of each microglia subcluster in each distance interval centered by the Aβ plaque at 13 months. Asterisks denote significantly enriched microglia subtypes in each distance interval. One-sided one-sample t-test, *P < 0.05, **P < 0.01, ****P < 0.0001 versus overall cell density. j, Diffusion map showing the expression of four representative DEG or SDEG genes of microglia. k, Matrix plot showing the z scores of DEGs or SDEGs in the disease-associated gene module of microglia in each distance around the Aβ plaque in TauPS2APP 13-month sample. The total averaged scaled expression level in different distance intervals was visualized by the bars on top of the matrix plots. l, Gene ontology enrichment analysis (Fisher’s one-sided test) results of disease-associated gene module in microglia.
Fig. 4 |
Fig. 4 |. Spatiotemporal gene expression analysis of astrocytes in TauPS2APP and control samples.
a, Diffusion map visualization of 6,789 astrocytes across samples. b, Dot plot showing the expression level of representative markers across different astrocyte subclusters. c, Diffusion map with pseudotime trajectory visualization of the astrocyte cell population across different samples generated by Monocle3. Colormap represents the pseudotime value and the root of the trajectory was marked by the white dot. d, Diffusion map showing the distance from each microglia cell to the closest plaque. e, Boxplot showing the distribution of the distance from each astrocyte to the closest plaque among astrocyte subtype populations in two different brain regions (n = 1,215 and 2,057 cells). Top: cortex; bottom, hippocampus. Box, 75% and 25% quantiles. Line, median. Whisker, the maxima/minima or to the median ± 1.5× IQR. Two-sided t-test, *P < 0.05, **P < 0.01, ****P < 0.0001. f, g, Spatial cell maps of astrocyte population in 13-month control (f) and TauPS2APP (g) samples. Insets show the zoom-in (1, 2). Dashed black lines mark the boundaries between the cortex, cc and hippocampus. h, Boxplot showing the density of each astrocyte subcluster in all eight sections (left), the cortex (middle) and hippocampus region (right) in control and TauPS2APP mice at two different time points. Box, 75% and 25% quantiles. Line, median. Dots, individual samples. One-sided t-test, *P < 0.05, **P < 0.01. i, Stacked bar charts showing the density of astrocyte subcluster in each distance interval around the Aβ plaque at 13 months. Asterisks denote significantly enriched astrocyte subtypes in each distance interval. One-sided one-sample t-test, *P < 0.05, **P < 0.01 versus overall cell density. j, Diffusion map showing the expression of four representative top DEGs of astrocyte. k, Matrix plot showing the z-scores of DEGs or SDEGs in the disease-associated gene module of astrocyte in each distance interval around the Aβ plaque in TauPS2APP 13-month sample. The total averaged scaled expression level in different distance intervals was visualized by the bars on top of the matrix plots. l, Gene ontology enrichment analysis (Fisher’s one-sided test) results of disease-associated gene module in astrocyte.
Fig. 5 |
Fig. 5 |. Spatiotemporal gene expression analysis of oligodendrocyte lineage cells in TauPS2APP and control samples.
a, Diffusion map visualization of 11,265 oligodendrocytes and 1,269 OPCs across samples. b, Dot plot showing the expression level of representative markers across different oligodendrocyte subclusters and OPC. c, Diffusion map with pseudotime trajectory visualization of oligodendrocyte and OPC population across different samples generated by Monocle3. Colormap represents the pseudotime value. The trajectory starting anchor was marked by the white dot and manually selected based on the OPC population. d, Diffusion map plots showing different types of oligodendrocytes identified in a along with trajectory identified in c. e,f, Spatial cell map of oligodendrocyte and OPC population in 13-month control (e) and TauPS2APP (f) samples. Insets show the zoom-in regions (1, 2). Dashed black lines mark the boundaries between the cortex, cc, hippocampus and alveus. g, Boxplot showing the density of each oligodendrocyte subcluster and OPC in all eight sections (left) and other separated brain regions (right) in control and TauPS2APP mice at two different time points. Box, 75% and 25% quantiles. Line, median. Dots, individual samples. One-sided t-test, *P < 0.05, **P < 0.01. h, Stacked bar charts showing the density of each oligodendrocyte subcluster and OPC in each distance interval around the Aβ plaque at 13 months. Asterisks denote significantly enriched oligodendrocyte subtypes and OPC in each distance interval. One-sided one-sample t-test, *P < 0.05 versus overall cell density. i, Heatmap showing p-tau quantification (left) and rank (right) of each grid in TauPS2APP sample at 13 months. j, Cell type composition analysis of oligodendrocyte lineages in relation to p-tau pathology. Asterisks denote significantly enriched oligodendrocyte subtypes and OPC in each p-tau density bin compared to the zero p-tau bin. One-sample t-test, *P < 0.05, ****P < 0.0001 versus zero p-tau bin. k, Cell density and subtype composition of oligodendrocyte and OPC in the hippocampal alveus region. Asterisks denote significantly enriched oligodendrocyte subtypes in the region of TauPS2APP samples compared to the paired control samples. Student’s t-test, one-sided *P < 0.05. l, Diffusion map showing the expression of four representative DEG or SDEG genes of oligodendrocytes.
Fig. 6 |
Fig. 6 |. Spatiotemporal gene expression analysis of neurons in TauPS2APP and control samples.
a, UMAP visualization showing four subclusters of cortex excitatory neuron (n = 18,303). b, The expression level of representative gene markers among different subclusters of cortex excitatory neuron cells. c, UMAP visualization showing six subclusters of inhibitory cell (n = 4,163). d, The expression level of representative gene markers among different subclusters of inhibitory neuron cells. e,f, Top: Spatial map of Aβ plaque and p-tau with excitatory (e) and inhibitory (f) neurons in the TauPS2APP 13-month samples. Bottom: high magnification views of areas indicated in the black boxes on the top panel. g, h, Stacked bar charts showing the density of each subcluster of excitatory (g) and inhibitory (h) neuron population from different brain regions at different distance intervals to the Aβ plaque of the 13-month TauPS2APP sample. Black asterisks denote significantly enriched neuron subclusters in each distance interval. Red asterisks denote significantly decreased neuron subclusters in each distance interval. One-sided one-sample t-test, *P < 0.05, **P < 0.01, ***P < 0.001, ****P < 0.0001 versus overall cell density. i, Stacked bar charts showing the composition of p-tau+ excitatory neurons and inhibitory neurons in TauPS2APP mice at two different time points defined by the ratio of tau+ pixels to the area of each cell (Methods). j, p-tau signal quantification around plaques. p-tau+ pixels (intensity > threshold; Methods) were quantified at a different distance to the Aβ plaque in the cortex and subcortical regions of the TauPS2APP 13-month samples. Asterisks denote regions with statistically significantly higher p-tau percentage compared to the overall p-tau percentage. One-sided one-sample t-test, *P < 0.05, **P < 0.01 versus overall p-tau percentage. k, Synaptic gene ontology (SynGO) term enrichment of DEGs (P < 0.05) identified from the p-tau+ CA1 neurons versus p-tau CA1 neurons in the 13-month TauPS2APP samples using SynGO. Color of the sunburst plot represents −log10 Q value at 1% FDR.
Fig. 7 |
Fig. 7 |. Integrative spatiotemporal analysis of disease-associated cell types and gene programs.
a, Matrix plot showing the gene clustering results in each distance interval around the Aβ plaque in TauPS2APP 8-month samples (left) and TauPS2APP 13-month samples (right). Colored by row-wise z score. b,c, Matrix plot showing the PIGs (enriched in 0–30 μm interval, adjusted P < 0.05) in each distance interval around the Aβ plaque in TauPS2APP 8-month sample (b) and TauPS2APP 13-month sample (c). Colored by row-wise z score. d, Representative images showing the spatial pattern of the gene set score for three spatial DEG clusters and corresponding cell type composition around plaque in the TauPS2APP mice at 13 months. Five concentric boundaries that are 10, 20, 30, 40 and 50 μm from each plaque were generated to quantify the cell type composition of each layer. Scale bar, 10 μm. e, Venn diagram highlighting the overlap of SDEGs in the TauPS2APP 8- and 13-month samples with SDEGs in TauPS2APP and previously reported PIGs in 18-month AppNL-G-F mice. f, An enrichment map showing the substantially enriched GO terms of cell type resolved SDEGs of microglia, astrocyte and oligodendrocyte in the TauPS2APP 13-month samples. Nodes represent the enriched GO terms; the size of each node corresponds to the number of genes in the GO terms (gProfiler term threshold: Fisher’s one-tailed test, P < 0.05; cytoscape node cut-off: FDR q < 0.1). Edges between nodes represent overlapping genes between two GO terms. Clusters with less than five nodes are filtered out. g, Histograms of Micro3, Astro3, Oligo2/Oligo3, OPC and neuronal cells spatial distribution around Aβ plaque in the TauPS2APP 8-month sample (left) and 13-month sample (right). h, Schematic diagram showing the spatial distribution of different cell types around Aβ plaque (top) and oligodendrocyte subtypes in hippocampal alveus (bottom) in the TauPS2APP mouse model. The number of cells in the schematic diagram represents the approximate ratio of cell number for each cell type.

References

    1. Masters CL et al. Alzheimer’s disease. Nat. Rev. Dis. Prim. 1, 15056 (2015). - PubMed
    1. Braak H. & Braak E. Neuropathological stageing of Alzheimer-related changes. Acta Neuropathol. 82, 239–259 (1991). - PubMed
    1. Busche MA & Hyman BT Synergy between amyloid-β and tau in Alzheimer’s disease. Nat. Neurosci. 23, 1183–1193 (2020). - PMC - PubMed
    1. Hardy J. & Selkoe DJ The amyloid hypothesis of Alzheimer’s disease: progress and problems on the road to therapeutics. Science 297, 353–356 (2002). - PubMed
    1. Beach TG, Walker R. & McGeer EG Patterns of gliosis in Alzheimer’s disease and aging cerebrum. Glia 2, 420–436 (1989). - PubMed

Publication types

Substances