. 2023 Feb 2;6(1):14.
doi: 10.1038/s41746-023-00748-4.

Multimodal deep learning of fundus abnormalities and traditional risk factors for cardiovascular risk prediction

Affiliations

Multimodal deep learning of fundus abnormalities and traditional risk factors for cardiovascular risk prediction

Yeong Chan Lee et al. NPJ Digit Med. .

Abstract

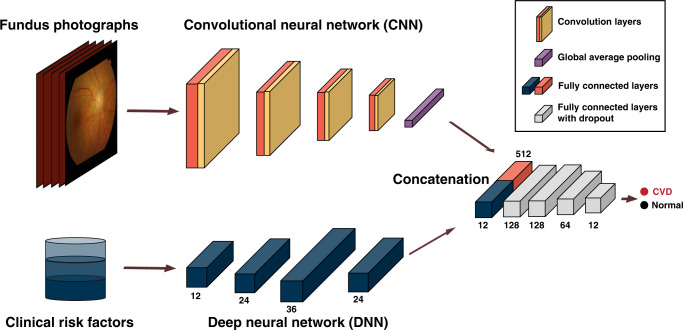
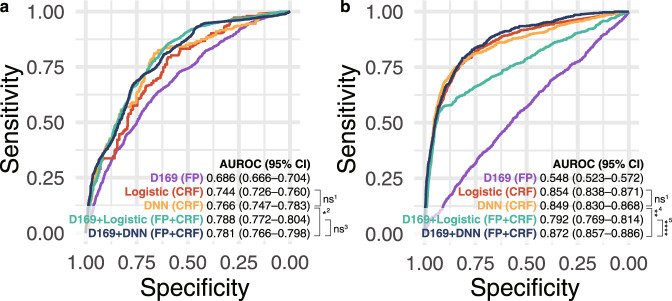
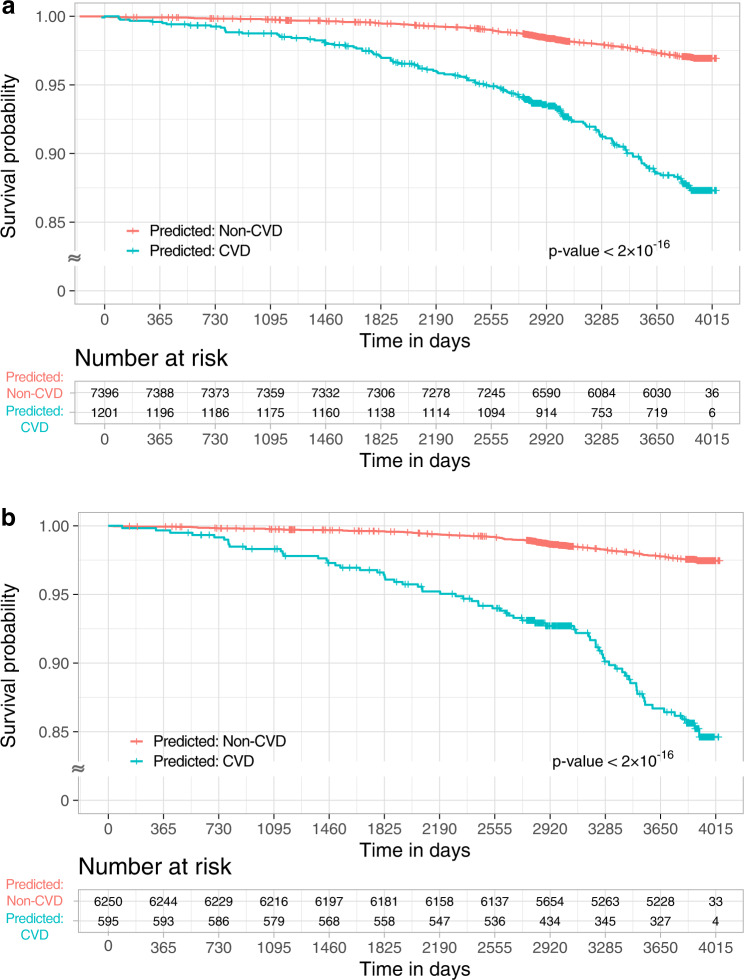
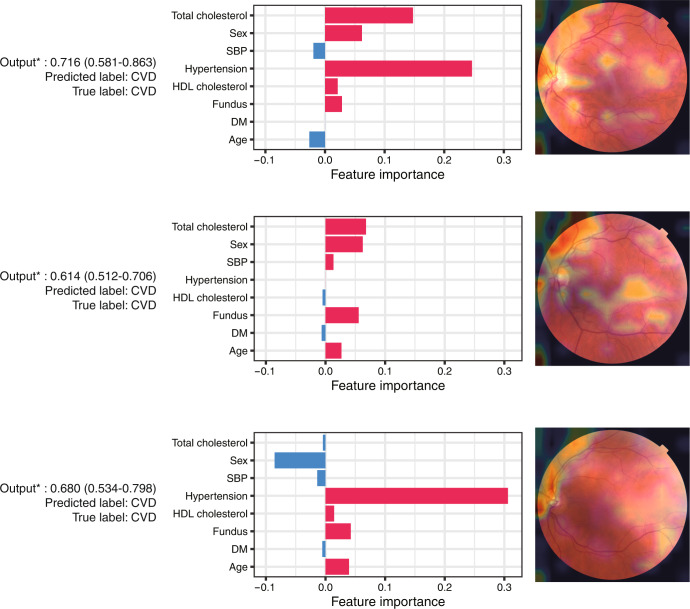
Cardiovascular disease (CVD), the leading cause of death globally, is associated with complicated underlying risk factors. We develop an artificial intelligence model to identify CVD using multimodal data, including clinical risk factors and fundus photographs from the Samsung Medical Center (SMC) for development and internal validation and from the UK Biobank for external validation. The multimodal model achieves an area under the receiver operating characteristic curve (AUROC) of 0.781 (95% confidence interval [CI] 0.766-0.798) in the SMC and 0.872 (95% CI 0.857-0.886) in the UK Biobank. We further observe a significant association between the incidence of CVD and the predicted risk from at-risk patients in the UK Biobank (hazard ratio [HR] 6.28, 95% CI 4.72-8.34). We visualize the importance of individual features in photography and traditional risk factors. The results highlight that non-invasive fundus photography can be a possible predictive marker for CVD.


Conflict of interest statement

Woong-Yang Park was employed by the commercial company GENINUS. The remaining authors declare no competing financial or non-financial interests.

Figures

Fig. 1
Fig. 1. Illustration of multimodal architecture which combines CNN with DNN to feed fundus photographs and clinical risk factors.
DenseNet-169 architecture with convolution layers (i.e., dense blocks) is used for CNN. The number of nodes is specified at each fully-connected layer. The last three layers have a dropout rate of 0.3. DNN deep neural network, CNN convolutional neural network.
Fig. 2
Fig. 2. Prediction performance of the models.
Receiver operating characteristic curves in the internal validation set (a) and external validation set (b). The performances of the models (Models 1–5) are described in Table 2. 1The differences in AUROCs between the logistic regression and the DNN are not significant (p-value = 0.079 in a and p-value = 0.531 in b). 2The difference in AUROCs between the DNN and the multimodal network is marginally significant (p-value = 0.047). 3The difference in AUROCs between the ensemble model (D169 + logistic regression) and the multimodal network is not significant (p-value = 0.541). 4The difference in AUROCs between the DNN and the multimodal network is significant (p-value = 0.004). 5The difference in AUROCs between the ensemble model (D169 + logistic regression) and the multimodal network is significant (p-value < 2 × 10−16). AUROC area under the receiver operating characteristic curve, CI confidence interval, D169 DenseNet-169, FP fundus photographs, Logistic logistic regression, CRF clinical risk factors, CRF, DNN deep neural network.
Fig. 3
Fig. 3. Risk gradient for CVD according to the risk group.
Odds ratios with 95% confidence interval (error bar) according to the risk groups in comparison to the lowest risk group in the internal validation set (a) and external validation set (b). D169 + DNN and DNN are identical in Model 5 and Model 3 in Table 2, respectively. CVD cardiovascular disease, D169 DenseNet-169, DNN deep neural network, FP fundus photographs, CRF clinical risk factors.
Fig. 4
Fig. 4. Receiver operating characteristic curves in the external validation set.
The performances of the models (Models 6–11) are described in Table 2. The models were trained with multimodal data in the SMC dataset. 1The difference in AUROCs between Models 8 and 9 is significant (p-value < 2 × 10−16). 2The difference in AUROCs between Models 10 and 11 is not significant (p-value = 0.578). AUROC Area under the receiver operating characteristics curve, PCE Pooled Cohort Equation, DNN deep neural network, CRF clinical risk factors, SMC Samsung Medical Center.
Fig. 5
Fig. 5. Association of predicted risk with incident CVD.
Kaplan–Meier graphs for incident CVD in the at-risk patients according to the predicted class from Model 10 (a) and Model 11 (b). CVD cardiovascular disease.
Fig. 6
Fig. 6. Examples of true positives in the external validation for interpretation.
The predicted scores (output) are described with the probability of the sample and 95% uncertainty interval (left). The SHAP values for contributions of variables are depicted in the middle. Positive feature importance (red) indicates that the variable may be a risk factor for predicting CVD, whereas a negative (blue) variable indicates a protective feature. Heatmap generation with fundus photographs using Grad-CAM (right). CVD cardiovascular disease, Grad-CAM gradient-weighted class activation mapping, SHAP Shapley additive explanation.

References

    1. Virani SS, et al. Heart disease and stroke statistics—2021 update: a report from the American Heart Association. Circulation. 2021;143:e254–e743. doi: 10.1161/CIR.0000000000000950. - DOI - PubMed
    1. Anderson KM, Odell PM, Wilson PW, Kannel WB. Cardiovascular disease risk profiles. Am. heart J. 1991;121:293–298. doi: 10.1016/0002-8703(91)90861-B. - DOI - PubMed
    1. D’agostino RB, et al. General cardiovascular risk profile for use in primary care. Circulation. 2008;117:743–753. doi: 10.1161/CIRCULATIONAHA.107.699579. - DOI - PubMed
    1. Goff DC, et al. 2013 ACC/AHA guideline on the assessment of cardiovascular risk: a report of the American College of Cardiology/American Heart Association Task Force on Practice Guidelines. J. Am. Coll. Cardiol. 2014;63:2935–2959. doi: 10.1016/j.jacc.2013.11.005. - DOI - PMC - PubMed
    1. Ridker PM, Buring JE, Rifai N, Cook NR. Development and validation of improved algorithms for the assessment of global cardiovascular risk in women: the Reynolds Risk Score. Jama. 2007;297:611–619. doi: 10.1001/jama.297.6.611. - DOI - PubMed