. 2023 Feb 2;21(1):37.
doi: 10.1186/s12951-023-01792-8.

Apoptotic tumor cell-derived microparticles loading Napabucasin inhibit CSCs and synergistic immune therapy

Affiliations

Apoptotic tumor cell-derived microparticles loading Napabucasin inhibit CSCs and synergistic immune therapy

Boping Jing et al. J Nanobiotechnology. .

Abstract

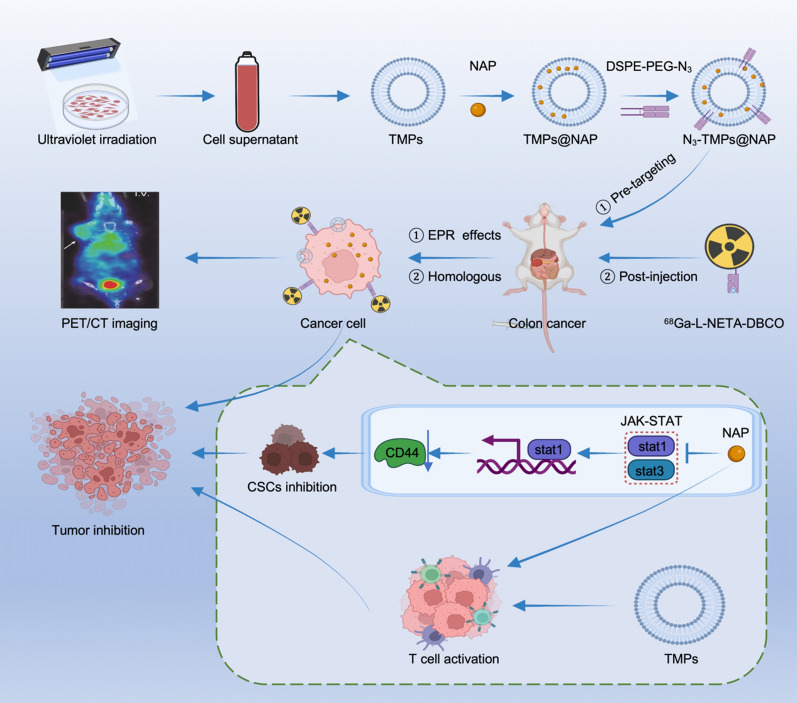
Background: Cancer stem cells (CSCs) are crucial for the growth, metastasis, drug resistance, recurrence, and spread of tumors. Napabucasin (NAP) could effectively inhibit CSC, but its mechanism has not been fully explained. Additionally, NAP also has the drawbacks of poor water solubility and low utilization. Therefore, this study not only elaborated the new mechanism of NAP inhibiting CSCs, but also built NAP-loaded nanoprobes using apoptotic tumor-derived microparticles (TMPs) as carriers to combine diagnose and treat of colon cancer and lessen the adverse effects of NAP.

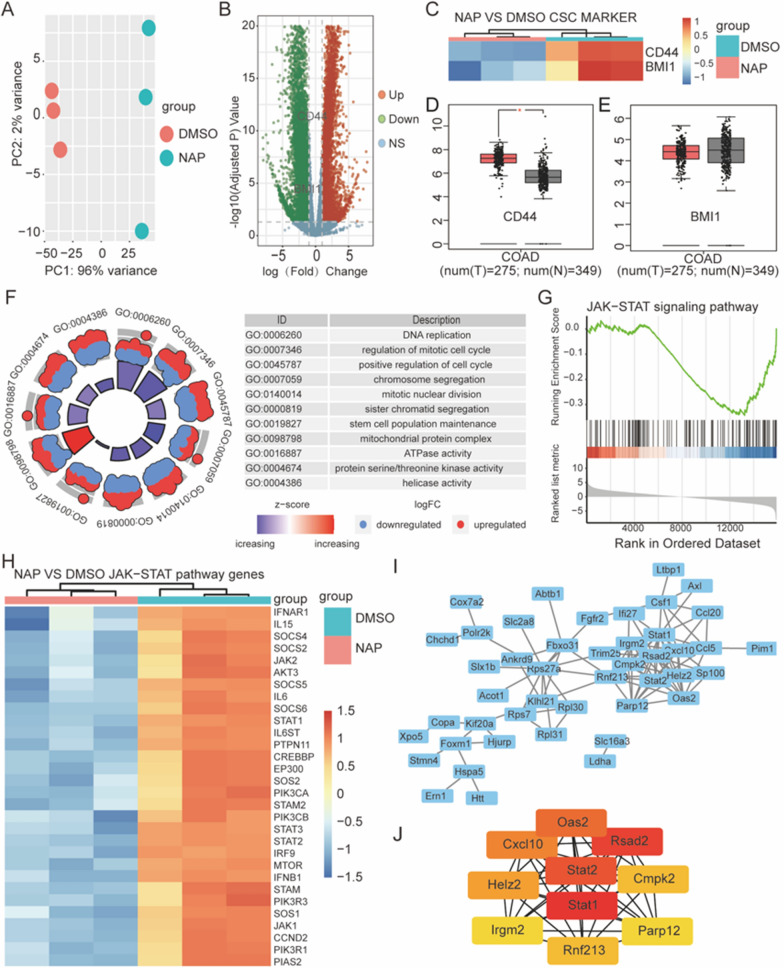
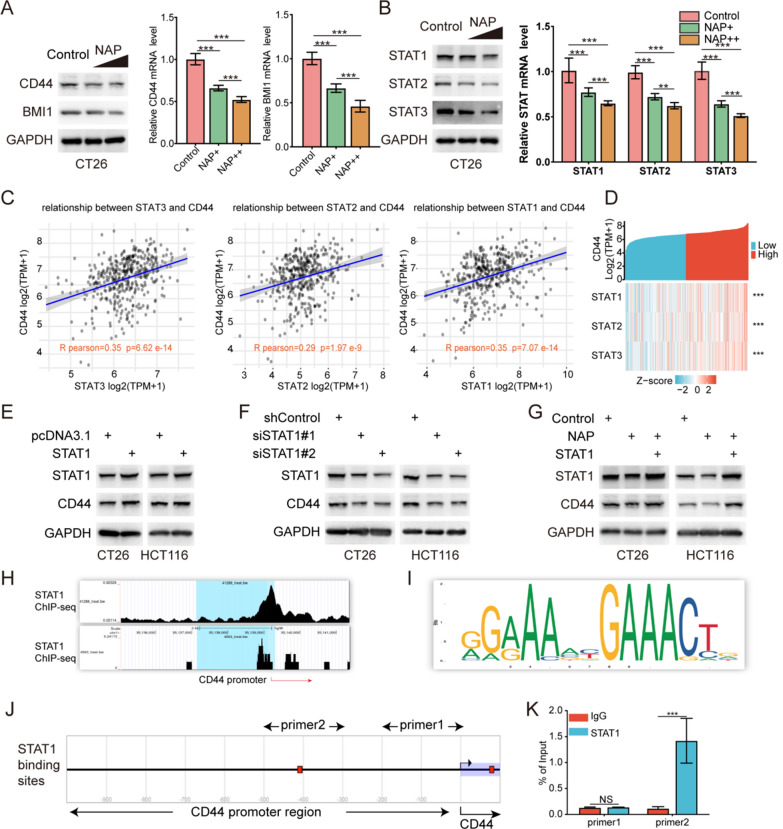
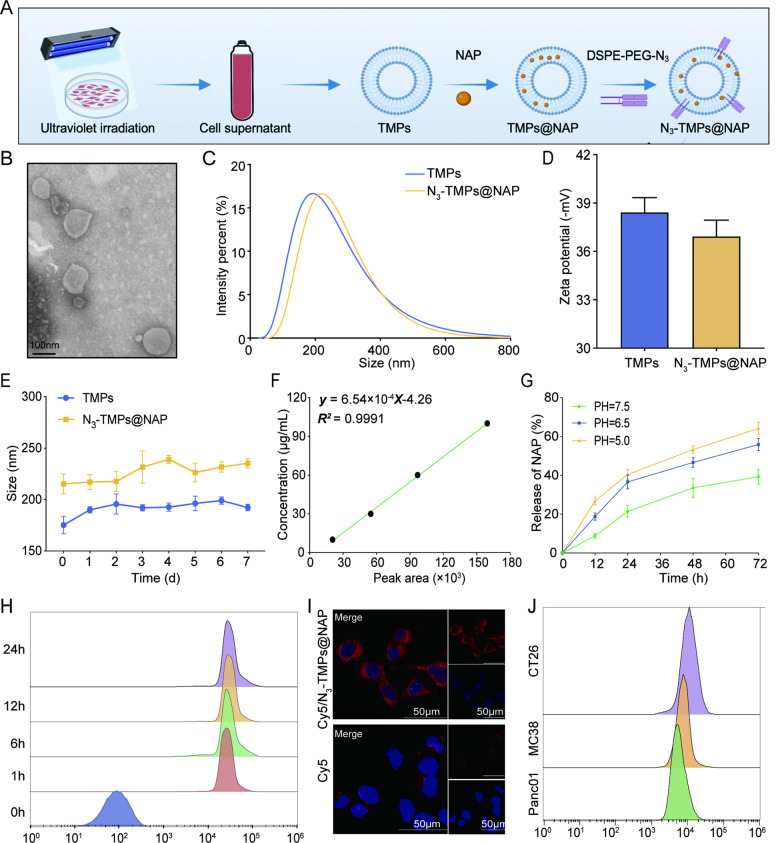
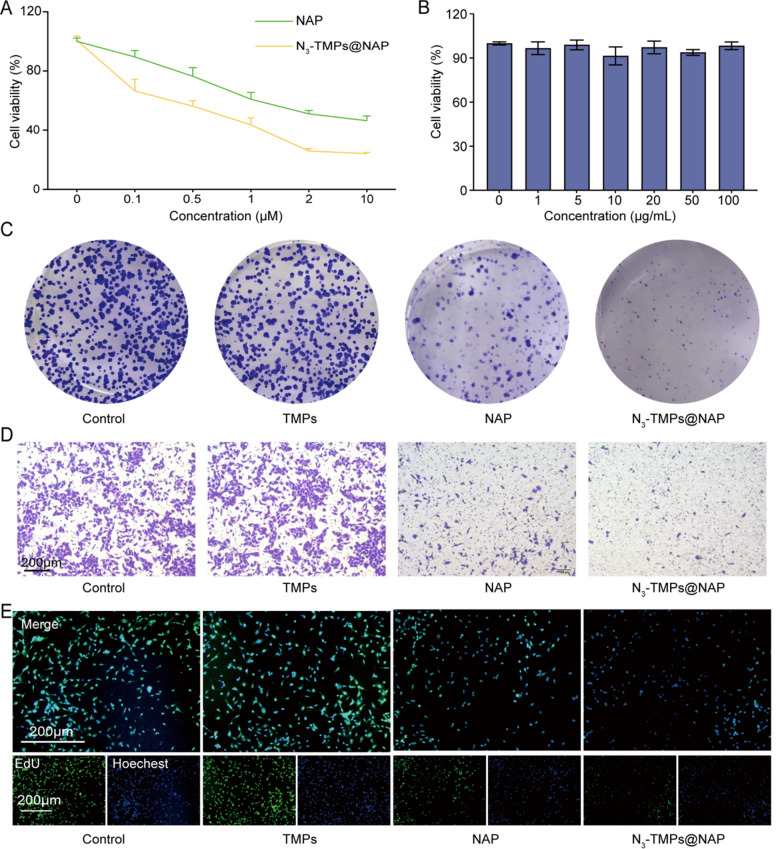
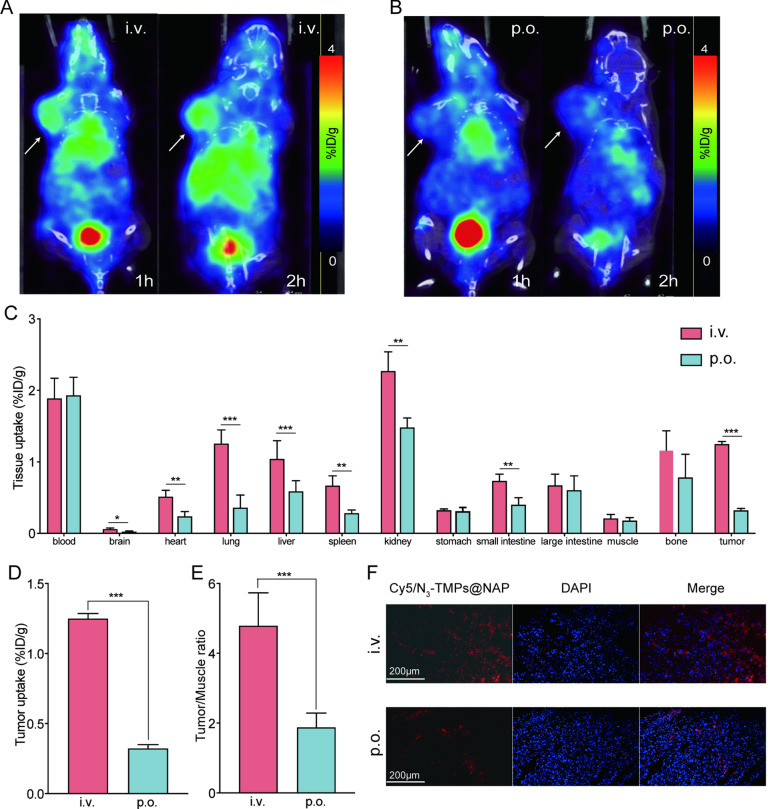
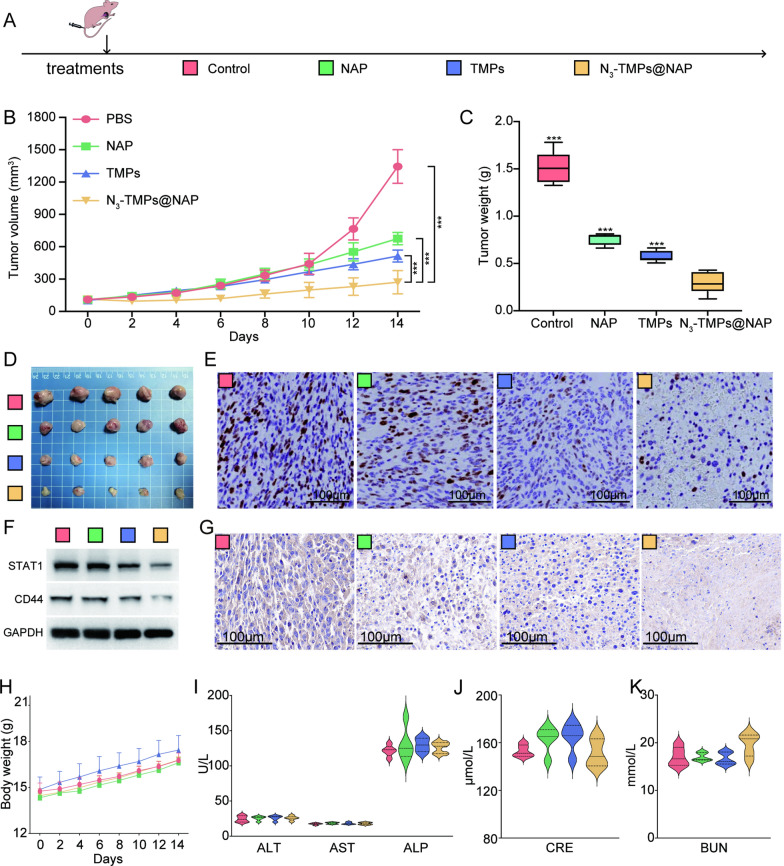
Results: The study discovered a new mechanism for NAP inhibiting tumors. NAP, in addition to inhibiting STAT3, may also inhibit STAT1, thereby inhibiting the expression of CD44, and the stemness of colon cancer. N3-TMPs@NAP was successfully synthesized, and it possessed a lipid bilayer with a particle size of 220.13 ± 4.52 nm, as well as strong tumor binding ability and anti-tumor effect in vitro. In static PET/CT imaging studies, the tumor was clearly visible and showed higher uptake after N3-TMPs@NAP injection than after oral administration. The average tumor volume and weight of the N3-TMPs@NAP group on day 14 of the treatment studies were computed to be 270.55 ± 107.59 mm3 and 0.30 ± 0.12 g, respectively. These values were significantly lower than those of the other groups. Additionally, N3-TMPs@NAP might prevent colon cancer from spreading to the liver. Furthermore, due to TMPs' stimulation of innate immunity, N3-TMPs@NAP might stimulate anti-tumor.

Conclusions: As a combined diagnostic and therapeutic nanoprobe, N3-TMPs@NAP could successfully conduct PET/CT imaging, suppress CSCs, and synergistically stimulate anticancer immune responses. Additionally, this nanoprobe might someday be employed in clinical situations because TMPs for it can be produced from human tissue and NAP has FDA approval.

Keywords: Cancer stem cells; JAK-STAT pathway; Napabucasin; PET/CT imaging; Tumor-derived microparticles.


Conflict of interest statement

The authors declare that there are no competing interest regarding the publication of this paper.

Figures

Scheme 1
Scheme 1
Schematic representation of synthesis, application, and analysis of TMPs-based nanoprobe
Fig. 1
Fig. 1
Bioinformatics analysis of the antitumor effect of NAP. A The analysis of the quality control of RNA sequencing. B The change in the number of genes after NAP treatment. C After the NAP treatment, the tumor stem cell markers, CD44, and BMI1 were significantly down-regulated. D The expression of CD44 in colon cancer patient tissues. E The expression of BMI1 in colon cancer patient tissues. F Changes of many biological processes after NAP treatment. G GSEA algorithm was used to analyze the changes in the JAK-STAT pathway after NAP treatment. H Significant changes in the expression levels of genes involved in the JAK-STAT pathway. I PPI network of 100 genes with the most significant changes. J The top 10 hub genes
Fig. 2
Fig. 2
NAP inhibited colon cancer by reducing STAT1 expression. A Western blot and RT-qPCR analysis of CD44 and BMI1 in NAP-treated CT26 cells. B Western Blot and RT-qPCR analyses of STAT1, STAT2, and STAT3 in the NAP-treated CT26 cells. C The correlations of STAT1, STAT2, and STAT3 with CD44 in human colon cancer tissues. D The heatmap of STAT1, STAT2, and STAT3 with CD44 in human colon cancer tissues. E Overexpression of STAT1 increased the protein levels of CD44. F Knockdown of STAT1 decreased the protein levels of CD44. G The overexpression of STAT1 reversed the effects of NAP on CD44 inhibition. H A STAT1 binding peak in the promoter region of CD44. I A consensus binding motif for STAT1. J The presence of STAT1 binding sites. K STAT1 bound to the promoter region of CD44
Fig. 3
Fig. 3
Characterizations of N3-TMPs@NAP. A Schematic representation of N3-TMPs@NAP synthesis. B TEM images of N3-TMPs@NAP. Scale bars = 100 μm. C The average hydrodynamic diameters of TMPs and N3-TMPs@NAP. D Zeta potentials of TMPs and N3-TMPs@NAP. E The hydrodynamic diameters of TMPs and N3-TMPs@NAP in PBS over 7 days. F The standard curve of NAP. G In vitro release of NAP from N3-TMPs@NAP at different PH. H Flow cytometric analysis of CT26 cells treated with Cy5/N3-TMPs@NAP or free cy5. I Fluorescence images of CT26 cells treated with Cy5/N3-TMPs@NAP. J Flow cytometric analysis of CT26 cells, MC38 cells and Panc01 cells treated with Cy5/N3-TMPs@NAP
Fig. 4
Fig. 4
In vitro antitumor effect and in vivo toxicity. A In vitro cell viabilities of CT26 cells incubated with NAP and N3-TMPs@NAP. B In vitro cell viabilities of CT26 cells incubated with TMPs. C In vitro anti-tumor effect detected by colony formation assay. D In vitro anti-tumor effect detected by transwell invasion assay. E In vitro anti-tumor effect detected by EdU assay. Scale bars = 200 μm. Data are represented as mean ± SD (n = 3)
Fig. 5
Fig. 5
In vivo PET/CT imaging and biodistribution of CT26 tumor-bearing mice. A PET/CT images of CT26 tumor-bearing mice after tail vein injection of N3-TMPs@NAP (i.v.) for 20 h, and intravenous injection of 68 Ga-L-NETA-DBCO for 1 h, 2 h. B PET/CT images of CT26 tumor-bearing mice after oral administration of N3-TMPs@NAP (p.o.) for 20 h, and intravenous injection of 68 Ga-L-NETA-DBCO for 1 h, 2 h. C Tissues uptakes of CT26 tumor-bearing mice at 2 h after the injection of 68 Ga-L-NETA-DBCO. DE Tumor uptake and tumor to muscle uptake ratio at 2 h after the injection of.68 Ga-L-NETA-DBCO. F Fluorescence images of tumor tissues after i.v. or p.o. of Cy5/N3-TMPs@NAP. Scale bars = 200 μm. Data are represented as mean ± SD (n = 3; *P < 0.05; **P < 0.01; ***P < 0.001)
Fig. 6
Fig. 6
In vivo antitumor effect and in vivo toxicity. A The therapeutic schedule. B Tumor growth curves in each group at given time points. C Average tumor weights in each group in the end. D Representative images of CT26 tumor tissues in the end. E Immunohistochemical staining of Ki67 in tumor tissues. F Western blot analysis of CD44 and STAT1 in CT26 tumor-bearing mice after treatment. G Immunohistochemical staining of CD44 in CT26 tumor tissues. H Body weight change curves. IK Liver function markers (ALT, AST, and ALP) and kidney function markers (BUN and CRE) after different treatments
Fig. 7
Fig. 7
In vivo evaluation of anti-metastatic liver tumor effect. A The therapeutic schedule. BE PET/CT imaging and representative mice in the end. F Representative liver and spleen tissues in the end. G The average weight of liver tissues in the end. H The average weight of spleen tissues in the end. I Representative H&E staining images of liver tissues from the euthanized mice. J The tumor area fraction of liver tissues
Fig. 8
Fig. 8
In vivo validation of the mechanism of NAP inhibiting colon cancer. A The KEGG enrichment analysis indicated that the immune-related pathway was regulated after TMPs treatment. B GSEA algorithm was used to analyze the changes in the cytosolic DNA-sensing pathway after TMPs treatment. C p-TBK1(Ser172) and p-IRF3(Ser386), markers of activation of innate immune pathway cytosolic DNA-sensing, were detected after TMPs treatment. DF RT-qPCR detected downstream target genes of the DNA-sensing pathway. GH Representative flow analysis of CD3+CD4+ T cells and CD3+CD8+ T cells in tumor tissues. IJ Representative fluorescent images of CD3+CD4+ T cells and CD3+CD8+ T cells in tumor tissues. (n = 6, scale bars:100 μm)

References

    1. Erratum: Global cancer statistics GLOBOCAN estimates of incidence and mortality worldwide for 36 cancers in 185 countries. CA Cancer J Clin. 2018;2020(70):313. - PubMed
    1. Siegel RL, Miller KD, Goding Sauer A, Fedewa SA, Butterly LF, Anderson JC, Cercek A, Smith RA, Jemal A. Colorectal cancer statistics, 2020. CA Cancer J Clin. 2020;70:145–164. doi: 10.3322/caac.21601. - DOI - PubMed
    1. Fumagalli A, Oost KC, Kester L, Morgner J, Bornes L, Bruens L, Spaargaren L, Azkanaz M, Schelfhorst T, Beerling E, et al. Plasticity of Lgr5-negative cancer cells drives metastasis in colorectal cancer. Cell Stem Cell. 2020;26(569–578):e567. - PMC - PubMed
    1. Zeuner A, Todaro M, Stassi G, De Maria R. Colorectal cancer stem cells: from the crypt to the clinic. Cell Stem Cell. 2014;15:692–705. doi: 10.1016/j.stem.2014.11.012. - DOI - PubMed
    1. Chandrakesan P, Yao J, Qu D, May R, Weygant N, Ge Y, Ali N, Sureban SM, Gude M, Vega K, et al. Dclk1, a tumor stem cell marker, regulates pro-survival signaling and self-renewal of intestinal tumor cells. Mol Cancer. 2017;16:30. doi: 10.1186/s12943-017-0594-y. - DOI - PMC - PubMed