

Leveraging process mining for modeling progression trajectories in amyotrophic lateral sclerosis
- PMID: 36732801
- PMCID: PMC9896660
- DOI: 10.1186/s12911-023-02113-7
Leveraging process mining for modeling progression trajectories in amyotrophic lateral sclerosis
Abstract
Background: Amyotrophic Lateral Sclerosis (ALS) is a neurodegenerative disease whose spreading and progression mechanisms are still unclear. The ability to predict ALS prognosis would improve the patients' quality of life and support clinicians in planning treatments. In this paper, we investigate ALS evolution trajectories using Process Mining (PM) techniques enriched to both easily mine processes and automatically reveal how the pathways differentiate according to patients' characteristics.
Methods: We consider data collected in two distinct data sources, namely the Pooled Resource Open-Access ALS Clinical Trials (PRO-ACT) dataset and a real-world clinical register (ALS-BS) including data of patients followed up in two tertiary clinical centers of Brescia (Italy). With a focus on the functional abilities progressively impaired as the disease progresses, we use two Process Discovery methods, namely the Directly-Follows Graph and the CareFlow Miner, to mine the population disease trajectories on the PRO-ACT dataset. We characterize the impairment trajectories in terms of patterns, timing, and probabilities, and investigate the effect of some patients' characteristics at onset on the followed paths. Finally, we perform a comparative study of the impairment trajectories mined in PRO-ACT versus ALS-BS.
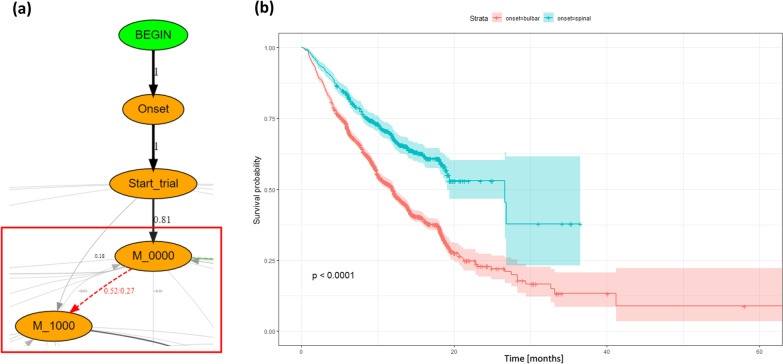
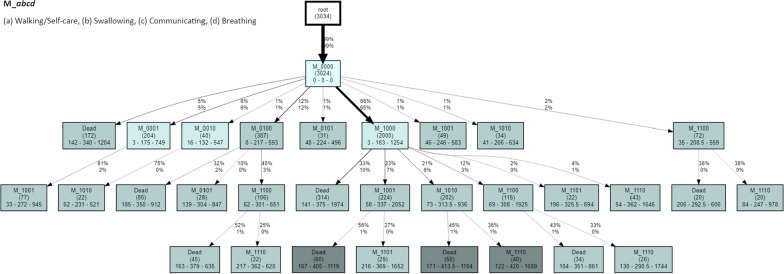
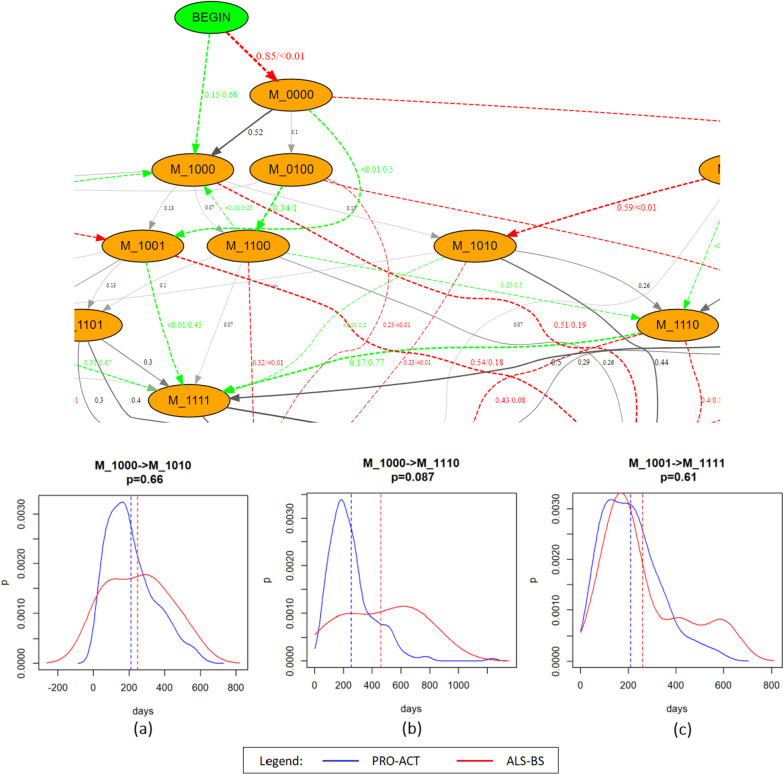
Results: We delineate the progression pathways on PRO-ACT, identifying the predominant disabilities at different stages of the disease: for instance, 85% of patients enter the trials without disabilities, and 48% of them experience the impairment of Walking/Self-care abilities first. We then test how a spinal onset increases the risk of experiencing the loss of Walking/Self-care ability as first impairment (52% vs. 27% of patients develop it as the first impairment in the spinal vs. the bulbar cohorts, respectively), as well as how an older age at onset corresponds to a more rapid progression to death. When compared, the PRO-ACT and the ALS-BS patient populations present some similarities in terms of natural progression of the disease, as well as some differences in terms of observed trajectories plausibly due to the trial scheduling and recruitment criteria.
Conclusions: We exploited PM to provide an overview of the evolution scenarios of an ALS trial population and to preliminary compare it to the progression observed in a clinical cohort. Future work will focus on further improving the understanding of the disease progression mechanisms, by including additional real-world subjects as well as by extending the set of events considered in the impairment trajectories.
Keywords: Amyotrophic lateral sclerosis; Patient stratification; Process discovery; Process mining; Prognosis; Progression trajectories.
© 2023. The Author(s).
Conflict of interest statement
The authors declare that they have no competing interests.
Figures


References
-
- Beghi E, Chiò A, Couratier P, Esteban J, Hardiman O, Logroscino G, Millul A, Mitchell D, Preux P-M, Pupillo E. The epidemiology and treatment of ALS: focus on the heterogeneity of the disease and critical appraisal of therapeutic trials. Amyotroph Lateral Scler. 2011;12(1):1–10. doi: 10.3109/17482968.2010.502940. - DOI - PMC - PubMed
-
- Goyal NA, Berry JD, Windebank A, Staff NP, Maragakis NJ, van den Berg LH, Genge A, Miller R, Baloh RH, Kern R, Gothelf Y, Lebovits C, Cudkowicz M. Addressing heterogeneity in amyotrophic lateral sclerosis CLINICAL TRIALS. Muscle Nerve. 2020;62(2):156–166. doi: 10.1002/mus.26801. - DOI - PMC - PubMed
Publication types
MeSH terms
Grants and funding
LinkOut - more resources
Full Text Sources
Medical
Miscellaneous
