

Alpha-kinase1 promotes tubular injury and interstitial inflammation in diabetic nephropathy by canonical pyroptosis pathway
- PMID: 36732854
- PMCID: PMC9893546
- DOI: 10.1186/s40659-023-00416-7
Alpha-kinase1 promotes tubular injury and interstitial inflammation in diabetic nephropathy by canonical pyroptosis pathway
Abstract
Background: Alpha-kinase 1 (ALPK1) is a master regulator in inflammation and has been proved to promote renal fibrosis by promoting the production of IL-1β in diabetic nephropathy (DN) mice. Pyroptosis is involved in high glucose (HG)-induced tubular cells injury, characterized by activation of Gasdermin D (GSDMD) and the release of IL-1β and IL-18, resulting in inflammatory injury in DN. It is reasonable to assume that ALPK1 is involved in pyroptosis-related tubular injury in DN. However, the mechanism remains poorly defined.
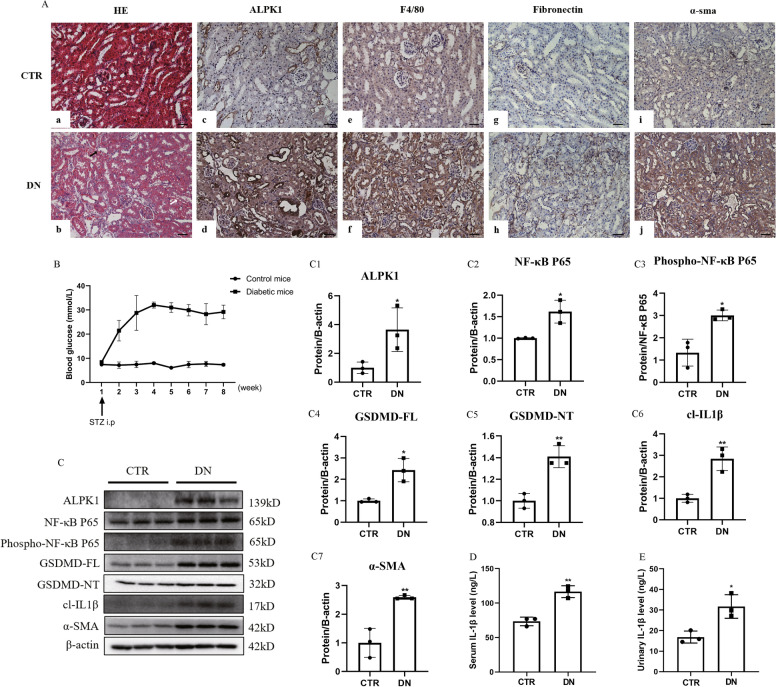
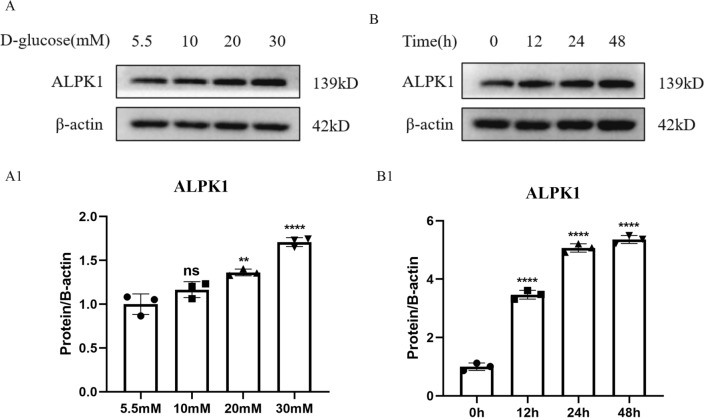
Methods: Immunohistochemistry (IHC) staining was performed to detect the expression of pyroptosis- and fibrosis-related proteins in renal sections of DN patients and DN mice. DN models were induced through injection of streptozotocin combined with a high-fat diet. Protein levels of ALPK1, NF-κB, Caspase-1, GSDMD, IL-1β, IL-18 and α-SMA were detected by Western blot. HK-2 cells treated with high-glucose (HG) served as an in vitro model. ALPK1 small interfering RNA (siRNA) was transfected into HK-2 cells to down-regulate ALPK1. The pyroptosis rates were determined by flow cytometry. The concentrations of IL-1β and IL-18 were evaluated by ELISA kits. Immunofluorescence staining was used to observe translocation of NF-κB and GSDMD.
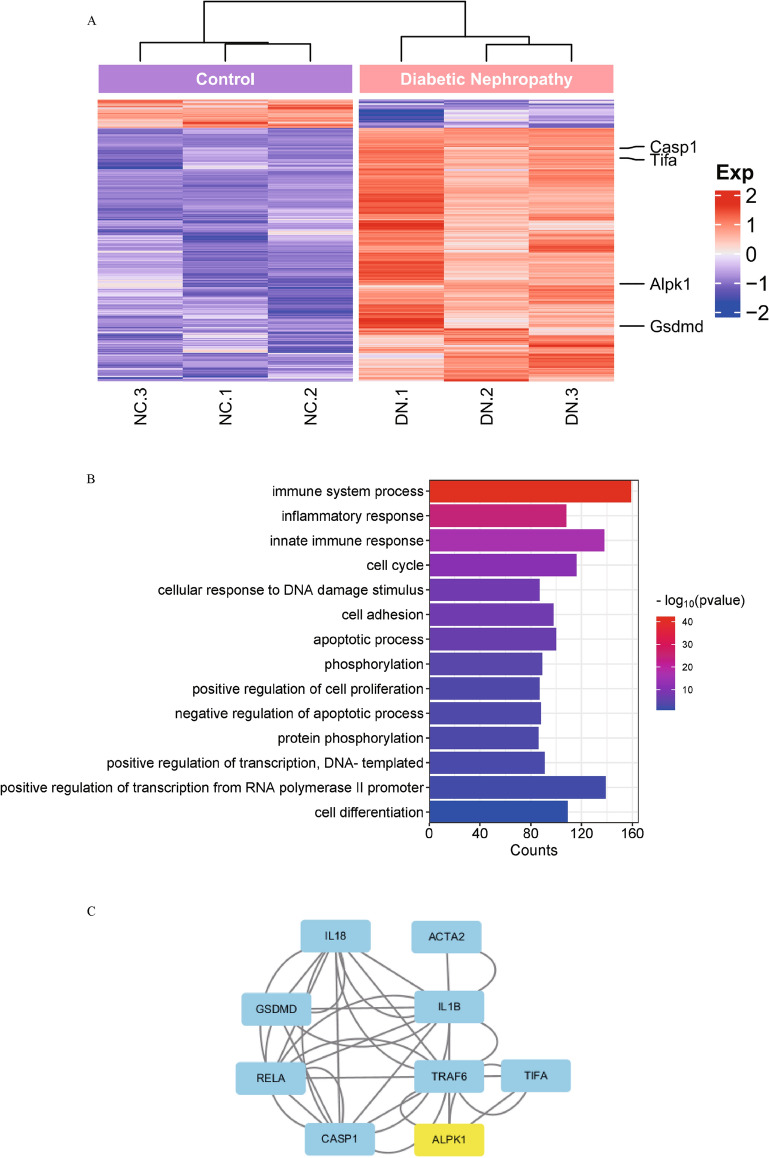
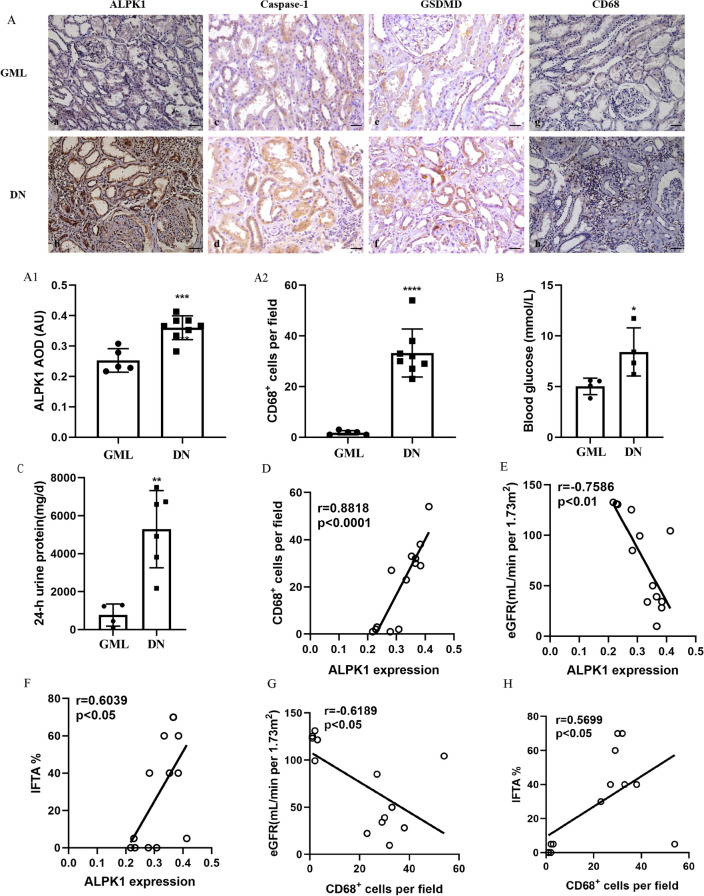
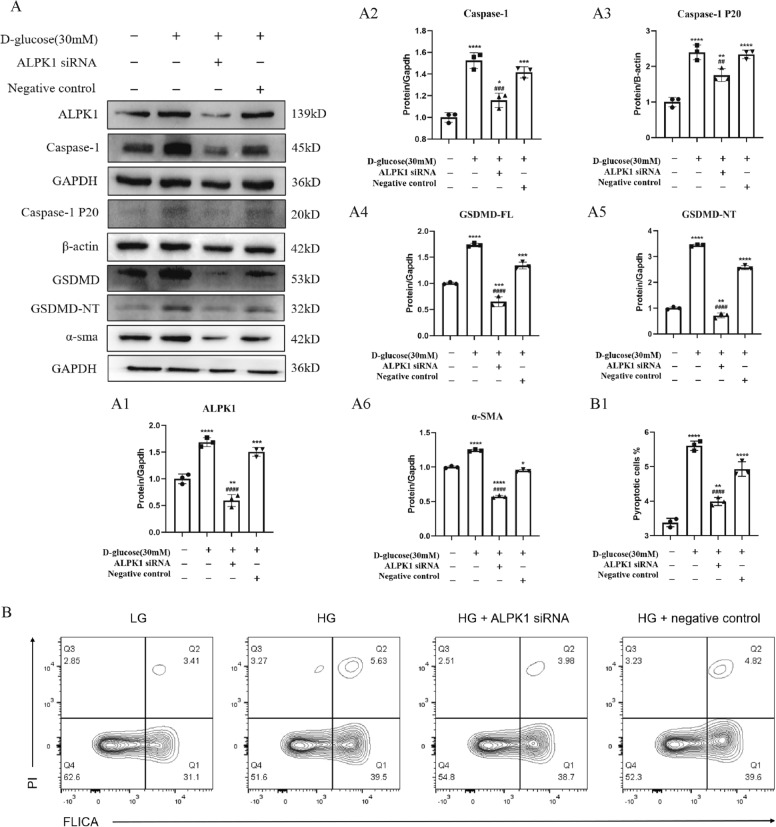
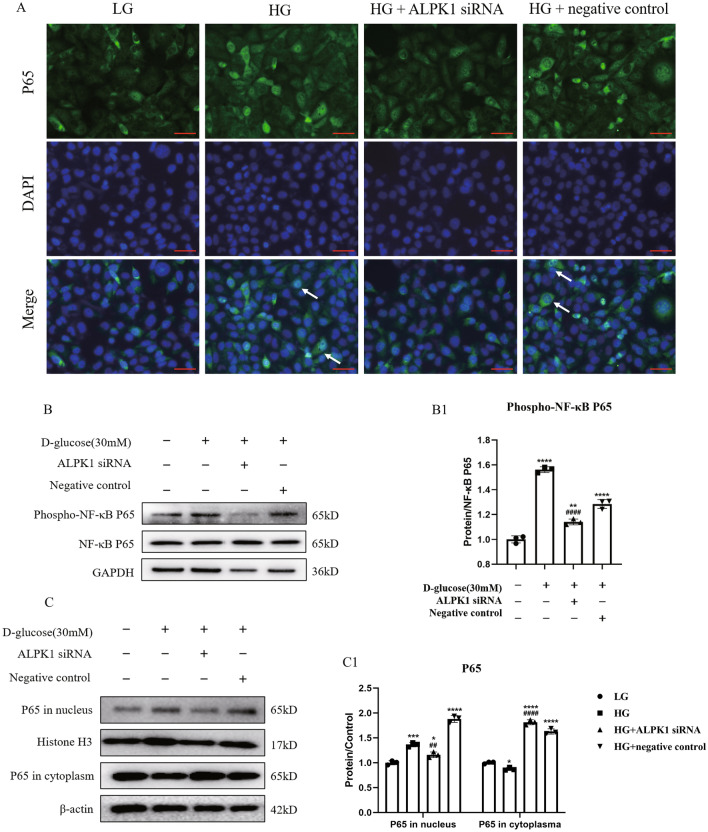
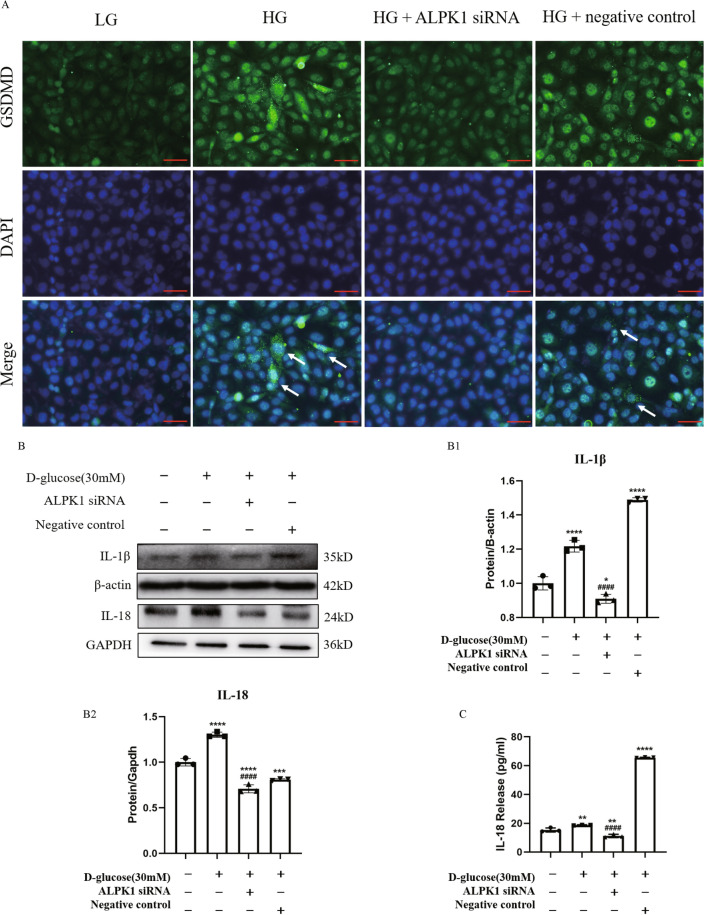
Results: The heat map of differentially expressed genes showed that ALPK1, Caspase-1 and GSDMD were upregulated in the DN group. The expression levels of ALPK1, Caspase-1, GSDMD and CD68 were increased in renal biopsy tissues of DN patients by IHC. ALPK1expression and CD68+ macrophages were positively correlated with tubular injury in DN patients. Western blot analysis showed increased expressions of ALPK1, phospho-NF-κB P65, GSDMD-NT, and IL-1β in renal tissues of DN mice and HK-2 cells, accompanied with increased renal fibrosis-related proteins (FN, α-SMA) and macrophages infiltration in interstitial areas. Inhibition of ALPK1 attenuated HG-induced upregulation expressions of NF-κB, pyroptosis-related proteins Caspase-1, GSDMD-NT, IL-1β, IL-18, α-SMA, and pyroptosis level in HK-2 cells. Also, the intensity and nuclear translocation of NF-κB and membranous translocation of GSDMD were ameliorated in HG-treated HK-2 cells after treatment with ALPK1 siRNA.
Conclusions: Our data suggest that ALPK1/NF-κB pathway initiated canonical caspase-1-GSDMD pyroptosis pathway, resulting in tubular injury and interstitial inflammation of DN.
Keywords: Alpha‐kinase 1; Diabetic nephropathy; Pyroptosis; Tubular injury.
© 2023. The Author(s).
Conflict of interest statement
No potential conflict of interest relevant to this article was reported.
Figures
Similar articles
-
Gasdermin D is involved in switching from apoptosis to pyroptosis in TLR4-mediated renal tubular epithelial cells injury in diabetic kidney disease.Arch Biochem Biophys. 2022 Sep 30;727:109347. doi: 10.1016/j.abb.2022.109347. Epub 2022 Jul 7. Arch Biochem Biophys. 2022. PMID: 35809639
-
Inhibition of the glycogen synthase kinase 3β-hypoxia-inducible factor 1α pathway alleviates NLRP3-mediated pyroptosis induced by high glucose in renal tubular epithelial cells.Exp Physiol. 2022 Dec;107(12):1493-1506. doi: 10.1113/EP090685. Epub 2022 Sep 26. Exp Physiol. 2022. PMID: 36056793
-
Caspase-11/4 and gasdermin D-mediated pyroptosis contributes to podocyte injury in mouse diabetic nephropathy.Acta Pharmacol Sin. 2021 Jun;42(6):954-963. doi: 10.1038/s41401-020-00525-z. Epub 2020 Sep 23. Acta Pharmacol Sin. 2021. PMID: 32968210 Free PMC article.
-
GSDMD-mediated pyroptosis: a critical mechanism of diabetic nephropathy.Expert Rev Mol Med. 2021 Dec 27;23:e23. doi: 10.1017/erm.2021.27. Expert Rev Mol Med. 2021. PMID: 34955116 Free PMC article. Review.
-
Pyroptosis in diabetic nephropathy.Clin Chim Acta. 2021 Dec;523:131-143. doi: 10.1016/j.cca.2021.09.003. Epub 2021 Sep 13. Clin Chim Acta. 2021. PMID: 34529985 Review.
Cited by
-
Cellular crosstalk of mesangial cells and tubular epithelial cells in diabetic kidney disease.Cell Commun Signal. 2023 Oct 16;21(1):288. doi: 10.1186/s12964-023-01323-w. Cell Commun Signal. 2023. PMID: 37845726 Free PMC article. Review.
-
Comprehensive analysis of pyroptosis-related gene signatures in renal fibrosis.Clin Exp Nephrol. 2025 Jul 3. doi: 10.1007/s10157-025-02726-4. Online ahead of print. Clin Exp Nephrol. 2025. PMID: 40608262
-
Identification of pyroptosis-related genes and potential drugs in diabetic nephropathy.J Transl Med. 2023 Jul 21;21(1):490. doi: 10.1186/s12967-023-04350-w. J Transl Med. 2023. PMID: 37480090 Free PMC article.
-
A new type of Caspase-1 upon recognizing bacteria inhibits GSDME-dependent histone modification and NF-κB signaling.Commun Biol. 2025 May 29;8(1):827. doi: 10.1038/s42003-025-08290-7. Commun Biol. 2025. PMID: 40442231 Free PMC article.
-
The importance of ALPK1 kinase functionality as a potential biomarker for inflammatory diseases.Mol Biol Rep. 2025 Jun 10;52(1):575. doi: 10.1007/s11033-025-10528-w. Mol Biol Rep. 2025. PMID: 40493324 Review.
References
MeSH terms
Substances
LinkOut - more resources
Full Text Sources
Medical
Research Materials
Miscellaneous
