. 2023 Jan 17:13:1029092.
doi: 10.3389/fimmu.2022.1029092. eCollection 2022.

Cross-talk between cuproptosis and ferroptosis regulators defines the tumor microenvironment for the prediction of prognosis and therapies in lung adenocarcinoma

Affiliations

Cross-talk between cuproptosis and ferroptosis regulators defines the tumor microenvironment for the prediction of prognosis and therapies in lung adenocarcinoma

Yefeng Shen et al. Front Immunol. .

Abstract

Cuproptosis, a newly identified form of programmed cell death, plays vital roles in tumorigenesis. However, the interconnectivity of cuproptosis and ferroptosis is poorly understood. In our study, we explored genomic alterations in 1162 lung adenocarcinoma (LUAD) samples from The Cancer Genome Atlas (TCGA) and the Gene Expression Omnibus (GEO) cohort to comprehensively evaluate the cuproptosis regulators. We systematically performed a pancancer genomic analysis by depicting the molecular correlations between the cuproptosis and ferroptosis regulators in 33 cancer types, indicating cross-talk between cuproptosis and ferroptosis regulators at the multiomic level. We successfully identified three distinct clusters based on cuproptosis and ferroptosis regulators, termed CuFeclusters, as well as the three distinct cuproptosis/ferroptosis gene subsets. The tumor microenvironment cell-infiltrating characteristics of three CuFeclusters were highly consistent with the three immune phenotypes of tumors. Furthermore, a CuFescore was constructed and validated to predict the cuproptosis/ferroptosis pathways in individuals and the response to chemotherapeutic drugs and immunotherapy. The CuFescore was significantly associated with the expression of miRNA and the regulation of post-transcription. Thus, our research established an applied scoring scheme, based on the regulators of cuproptosis/ferroptosis to identify LUAD patients who are candidates for immunotherapy and to predict patient sensitivity to chemotherapeutic drugs.

Keywords: CuFescore; chemotherapy; cuproptosis; ferroptosis; immunotherapy; prognosis; tumor microenvironment.


Conflict of interest statement

The authors declare that the research was conducted in the absence of any commercial or financial relationships that could be construed as a potential conflict of interest.

Figures
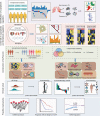
Figure 1
Figure 1
Workflow of our study.
Figure 2
Figure 2
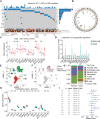
Landscape of genetic and expression variation of cuproptosis regulators in LUAD. (A) Mutation frequency of cuproptosis regulators in 561 LUAD patients from the TCGA cohort. Each column represents individual patients. The upper bar graph showed tumor mutational burden. The number on the right indicates the mutation frequency in the regulators. The right bar graph revealed the proportion of each variant type. The graph below determined clinical features of patients in the cohort. (B) Location of CNV alteration of cuproptosis regulators on 23 chromosomes. (C) Bulk sequencing showed the expression of cuproptosis regulators between adjacent non-tumor and LUAD samples in TCGA-LUAD cohort (n = 585). (D) Expression of cuproptosis regulators in NSCLC (A549) and normal lung epithelial cell line (BEAS-2B) by RT-PCR. (E) UMAP indicated the cell composition in the microenvironment of LUAD according to cell types. (F) Cell distribution originated from tumor and normal lung samples. (G) Bar plot determined the overall cell composition of normal and tumor samples. (H) ScRNA-seq analysis revealed the expression of cuproptosis regulators between adjacent non-tumor and LUAD samples in GSE131907 cohort (n = 22). (I) Forest plot showed the prognosis of cuproptosis regulators for LUAD patients in TCGA (n = 585). UMAP, uniform manifold approximation and projection. * p < 0.05, ** p < 0.01, *** p < 0.001, ns, not significant.
Figure 3
Figure 3
Cross-talk identified among cuproptosis and ferroptosis regulators in cancers. (A) Mutation frequency of cuproptosis and ferroptosis regulators in 33 cancer types. Green bar, mutation of cuproptosis regulators; Orange bar, mutation of ferroptosis regulators. (B) Co-occurrence of genetic alterations in the cuproptosis and ferroptosis regulators. Cuproptosis regulators are presented in green and ferroptosis regulators are in orange. (C) Protein-protein interactions among cuproptosis and ferroptosis regulators based on the GeneMANIA database. (D) Module membership-based hub cuproptosis and ferroptosis regulators across 33 cancer types. The lower panel shows the number of hub cuproptosis and ferroptosis regulators in each cancer type. (E) Correlations between the number of hub cuproptosis regulators and the number of hub ferroptosis regulators. The Pearson correlation coefficients (R) were analyzed for the correlation. (F) Levels of cuproptosis regulators after knockdown of ferroptosis regulators in A549 cells by RT-PCR. COAD, colon adenocarcinoma; DLBC, diffuse large B cell lymphoma; ESCA, esophageal carcinoma; GBM, glioblastoma; HNSC, head and neck squamous cell cancer; KICH, kidney chromophobe; KIRC, kidney renal clear carcinoma; KIRP, kidney renal papillary carcinoma; LAML, acute myeloid leukemia; LGG, low grade gliomas; LIHC, liver hepatocellular carcinoma; LUAD, lung adenocarcinoma; LUSC, lung squamous cell carcinoma; MESO, mesothelioma; OV, ovarian cancer; PAAD, pancreatic adenocarcinoma; PCPG, pheochromocytoma and paraganglioma; PRAD, prostate adenocarcinoma; READ, rectum adenocarcinoma; SARC, sarcoma; SKCM, skin cutaneous melanoma; STAD, stomach adenocarcinoma; TGCT, tenosynovial giant cell tumor; THCA, thyroid carcinoma; THYM, thymoma; UCEC, uterine corpus endometrial carcinoma; UCS, uterine carcinosarcoma; ACC, adenoid cystic carcinoma; BLCA, bladder carcinoma; BRCA, breast cancer; CESC, cervical squamous cell carcinoma and endocervical adenocarcinoma; CHOL; cholangiocarcinoma; UVM, uveal melanoma. * p < 0.05, ** p < 0.01, ns, not significant.
Figure 4
Figure 4
Tumor microenvironment cell infiltration characteristics and transcriptome traits in distinct CuFeclusters. (A) Principal component (PC) analysis revealed remarkable difference between three CuFeclusters from 6 cohorts (n = 1147). (B) Kaplan-Meier curves of survival for three patterns of three CuFeclusters based on LUAD patients from six cohorts (TCGA-LUAD, GSE30219, GSE31210, GSE3141, GSE37745, and GSE81089). (C, D) GSVA enrichment analysis shown the activation states of biological pathways in distinct CuFeclusters. The heatmap was used to visualize these biological processes, and yellow represented activated pathways and blue represented inhibited pathways. (C) CuFecluster A vs (B, D) CuFecluster B vs (C, E) Characteristics of immune infiltrating cells in different CuFeclusters. (F) Characteristics of immune responses in different CuFeclusters. GSVA, gene set variation analysis. ** p < 0.01, *** p < 0.001, ns, not significant.
Figure 5
Figure 5
Construction of the CuFescore and the prognostic values of the CuFescore. (A) Overlapped cuproptosis/ferroptosis-related genes shown in Venn diagram. (B) Kaplan-Meier curves of survival in 6 cohorts with three distinct geneclusters. (C) Alluvial diagram showing the changes in CuFeclusters, geneclusters and CuFescores. CuFescore in distinct (D) CuFeclusters and (E) geneclusters. (F) Proportion of survival and death in the high and low CuFescore groups. (G) Comparison of the CuFescore in alive versus dead patients. (H) Kaplan-Meier curves of survival in the high and low CuFescore groups. (I) Functional annotation for DEGs between the low and high low CuFescore groups using GO enrichment analysis. The color depth of the barplots represented the number of genes enriched. (J) Difference in CuFescore among distinct clinical subgroups in LUAD cohort. (K) Time-dependent AUC value in TCGA-LUAD, GSE30219, GSE31210 and GSE37745. AUC, area under curve. * p < 0.05, ** p < 0.01, *** p < 0.001.
Figure 6
Figure 6
Correlation between the CuFescore and immune checkpoints. (A) Comparison of TMB in the high and low CuFescore group. (B) Correlation between CuFescore and TMB. (C) Kaplan-Meier curves of survival in the high and low TMB groups. (D) Survival analyses for patients stratified by both CuFescore and TMB using Kaplan-Meier curves. (E) Difference in the relative abundance of immune cell infiltration in tumor microenvironment between the high and low CuFescore groups. Difference > 0 indicates that the immune cells were enriched in the low CuFescore group, and the column color represents the statistical significance of the difference. (F) Expression of cell types in the five cohorts. Analyses for the expression of (G) HLA family genes and (H) immune checkpoints in the CuFescore groups. (I) Correlation analysis for CuFescore and the expression of HLA family genes and immune checkpoints. TMB, tumor mutational burden; TPM, transcript per million. * p < 0.05, ** p < 0.01, *** p < 0.001, ns, not significant.
Figure 7
Figure 7
Association between the CuFescore and tumor mutation status. Visual summary showing common genetic alterations in the (A) low and (B) high CuFescore groups. (C) Forest plot of gene mutations in the patients. Interaction effect of genes mutating differentially in patients in the (D) low and (E) high CuFescore groups. p < 0.1, * p < 0.05, *** p < 0.001.
Figure 8
Figure 8
Role of the CuFescore in the chemotherapy and immunotherapy. (A) Sensitivity of 138 drugs. Efficacy of (B) axitinib; (C) erlotinib; (D) docetaxel and (E) gemcitabine. (F) Kaplan-Meier curves of survival in the patients receiving anti-PD-L1 therapy in GSE91061. (G) Proportion of patients with response to PD-1 blockade immunotherapy in the high and low CuFescore groups. (H) Distribution of CuFescore in distinct anti-PD1 clinical response groups. (I) Kaplan-Meier curves of survival i8n the patients receiving adoptive T cell therapy in GSE10797. (J) Proportion of patients with response to adoptive T cell therapy in the high and low CuFescore groups. (K) Correlation of CuFescore with clinical response to adoptive T cell therapy. IC 50, half maximal inhibitory concentration; FDR, false discovery rate; MEscore, module eigengene score; CR, complete response; PD, progressive disease; PR, partial response; SD, stable disease.
Figure 9
Figure 9
Associated between the CuFescore and the post-transcriptional characteristics. (A) Differences in miRNA-targeted signaling pathways in the TCGA-LUAD cohort between the high and low CuFescore groups. (B) Differences in the distal poly (A) site usage index (PDUI) of each gene between the high and low CuFescore groups. Red, PDUI lengthening; blue, PDUI shortening; Grey, no significant change in PDUI. (C) Kaplan-Meier curves indicated overall survival between PDUI lengthening (red) and PDUI shortening (blue) of TM9SF3 and ATP2A2. (D) Bar graphs showed the difference in the distal poly (A) site usage index (PDUI), and the forest plots showed univariate Cox regression analyses for PDUI differential genes between the high and low CuFescore groups. APA, alternative polyadenylation. HR, hazard ratio. CI, confidence interval. ** p < 0.01, *** p < 0.001.

References

    1. Siegel RL, Miller KD, Fuchs HE, Jemal A. Cancer statistics, 2021. CA Cancer J Clin (2021) 71(1):7–33. doi: 10.3322/caac.21654 - DOI - PubMed
    1. Walder D, O'Brien M. Looking back and to the future: Are we improving 'cure' in non-small cell lung cancer? Eur J Cancer (2017) 75:192–4. doi: 10.1016/j.ejca.2017.01.006 - DOI - PubMed
    1. Lei G, Zhuang L, Gan B. Targeting ferroptosis as a vulnerability in cancer. Nat Rev Cancer. (2022) 22(7):381–96. doi: 10.1038/s41568-022-00459-0 - DOI - PMC - PubMed
    1. Tsvetkov P, Coy S, Petrova B, Dreishpoon M, Verma A, Abdusamad M, et al. . Copper induces cell death by targeting lipoylated TCA cycle proteins. Science. (2022) 375(6586):1254–61. doi: 10.1126/science.abf0529 - DOI - PMC - PubMed
    1. Gao W, Huang Z, Duan J, Nice EC, Lin J, Huang C. Elesclomol induces copper-dependent ferroptosis in colorectal cancer cells via degradation of ATP7A. Mol Oncol (2021) 15(12):3527–44. doi: 10.1002/1878-0261.13079 - DOI - PMC - PubMed

Publication types