. 2023 Jan 31;5(1):lqad011.
doi: 10.1093/nargab/lqad011. eCollection 2023 Mar.

Application of microfluidic chip electrophoresis for high-throughput nucleic acid fluorescence fragment analysis assays

Affiliations

Application of microfluidic chip electrophoresis for high-throughput nucleic acid fluorescence fragment analysis assays

Yali Sun et al. NAR Genom Bioinform. .

Abstract

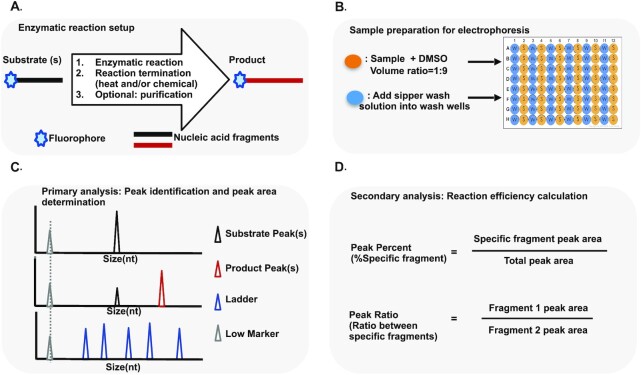
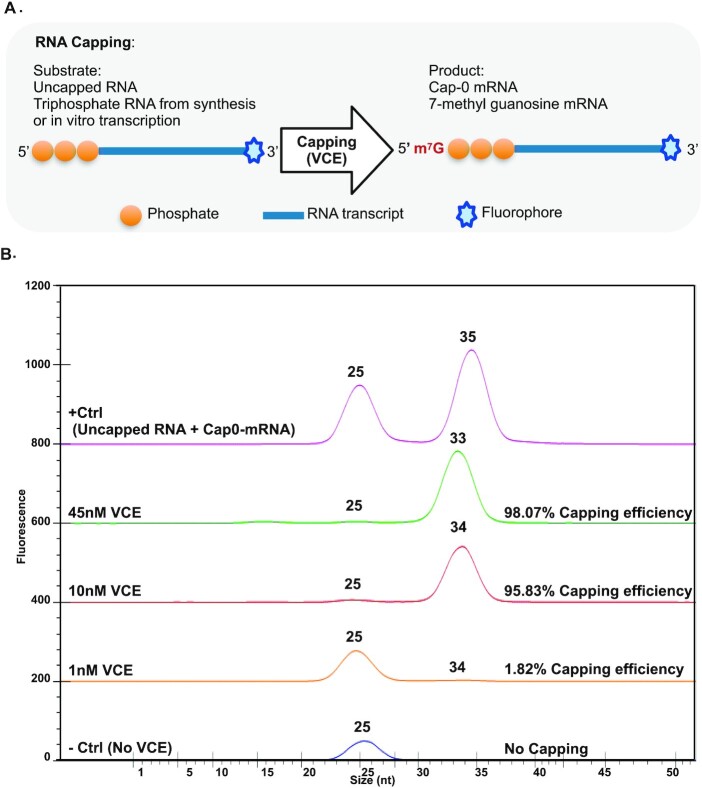
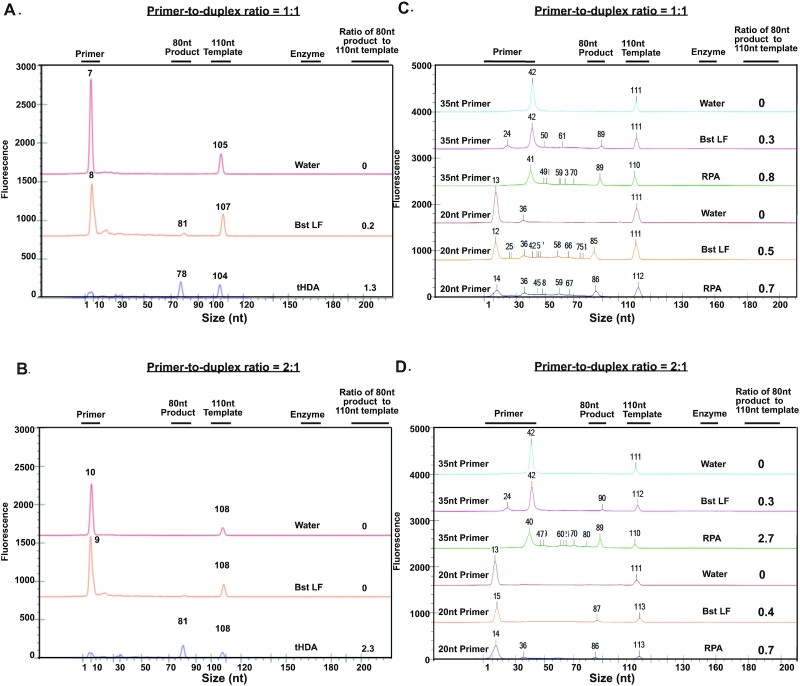
Nucleic acid fragment analysis via separation and detection are routine operations in molecular biology. However, analysis of small single-stranded nucleic acid fragments (<100nt) is challenging and mainly limited to labor-intensive polyacrylamide gel electrophoresis or high-cost capillary electrophoresis methods. Here we report an alternative method, a microfluidic chip electrophoresis system that provides a size resolution of 5nt and a detection time of one minute per sample of fluorescence-labeled DNA/RNA fragments. The feasibility of this system was evaluated by quantifying CRISPR-Cas9 cleavage efficiency and the detection resolution was evaluated by analyzing ssDNA/RNA adenylation and phosphorylation. We employed this system to study the RNA capping efficiency and double-stranded DNA unwinding efficiency in isothermal amplification as two examples for assay design and evaluation. The microfluidic chip electrophoresis system provides a rapid, sensitive, and high-throughput fluorescence fragment analysis (FFA), and can be applied for enzyme characterization, reaction optimization, and product quality control in various molecular biology processes.


Figures

Figure 1.
Figure 1.
Microfluidic chip electrophoresis workflow. Microfluidic chip electrophoresis workflow is illustrated schematically in panels A, B, C and D. (A) Enzymatic reaction setup: fluorescence labeled substrates (labeled at 5′ end or 3′ end or internal) are processed through enzymatic reaction based on assay design and followed by reaction termination (heat and/or chemical treatment) and purification (optional). (B) Sample preparation for electrophoresis: samples are mixed with DMSO at a 1:9 volume ratio and added into sample wells of a 96-well plate. Sipper wash solution is added into wash wells of 96 well plate. Then the 96-well sample plate is loaded onto LabChip® GX Touch™ Nucleic Acid Analyzer for electrophoresis. (C) Primary analysis: sample peaks are automatically aligned to lower marker and fluorescently labeled single-stranded DNA (ssDNA) ladder for size calling by GX Touch™ Reviewer software. Peaks (fragments) of interest including substrate, product control, or products with intermediates are identified. GX Touch™ Reviewer software determines the peak height, peak size and peak area and these data can be exported into a .csv file for additional analysis. (D) Secondary analysis: reaction efficiency can be calculated through percentage of specific fragment or ratio between specific fragments.
Figure 2.
Figure 2.
RNA capping. (A) RNA capping reaction study design using Vaccinia virus Capping Enzyme (VCE). (B) RNA capping efficiency study result. + Ctrl (positive control): a 1:1 ratio mixture of uncapped RNA and Cap0-mRNA. –Ctrl (negative control): uncapped RNA without VCE enzyme mix. Capping efficiency (peak percentage) is automatically calculated by the GX Touch™ software, dividing the peak area of capped RNA by the sum of peak areas of uncapped and capped RNA.
Figure 3.
Figure 3.
dsDNA duplex unwinding efficiency study with tHDA and RPA. (A)(B). dsDNA duplex unwinding efficiency study with tHDA. 20nt primer is used at each primer-to-duplex ratio setting. (A) primer-to-duplex ratio is 1:1. (B) primer-to-duplex ratio is 2:1. (C)(D). dsDNA duplex unwinding efficiency study with RPA. 20nt and 35nt primers are used at each primer-to-duplex ratio setting. (C) primer-to-duplex ratio is 1:1. (D) primer-to-duplex ratio is 2:1. Enzymes used in each reaction are labeled on the graph. Water is used as the negative control. Bst LF is used as the no helicase/recombinase control or polymerase only control. dsDNA unwinding efficiency is calculated using the peak area ratio of the 80nt extended product to 110nt duplex template.

Similar articles

Cited by

References

    1. Jain R., Shuman S. Characterization of a thermostable archaeal polynucleotide kinase homologous to human Clp1. RNA. 2009; 15:923–931. - PMC - PubMed
    1. Zhelkovsky A.M., McReynolds L.A. Simple and efficient synthesis of 5′ pre-adenylated DNA using thermostable RNA ligase. Nucleic Acids Res. 2011; 39:e117–e117. - PMC - PubMed
    1. Chan S.-H., Whipple J.M., Dai N., Kelley T.M., Withers K., Tzertzinis G., Corrêa I.R., Robb G.B. RNase H-based analysis of synthetic mRNA 5′ cap incorporation. RNA. 2022; 28:1144–1155. - PMC - PubMed
    1. Wong K.H., Campbell K.L. Factors that affect use of intercalating dyes such as PicoGreen, SYBR Green I, Syto-13 and Syto-82 in DNA assays. Biol. Reprod. 2011; 85:725–725.
    1. Barril P., Nates S. Introduction to agarose and polyacrylamide gel electrophoresis matrices with respect to their detection sensitivities. Gel Electrophoresis - Principles and Basics. 2012; InTech.