. 2022 Oct 17;13(11):5860-5878.
doi: 10.1364/BOE.462594. eCollection 2022 Nov 1.

Ultrahigh-speed multimodal adaptive optics system for microscopic structural and functional imaging of the human retina

Affiliations

Ultrahigh-speed multimodal adaptive optics system for microscopic structural and functional imaging of the human retina

Zhuolin Liu et al. Biomed Opt Express. .

Abstract

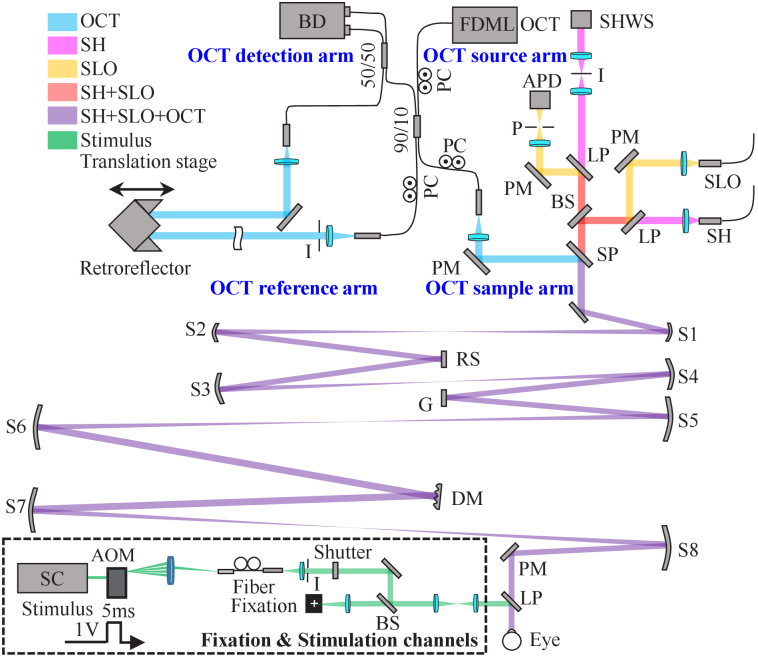
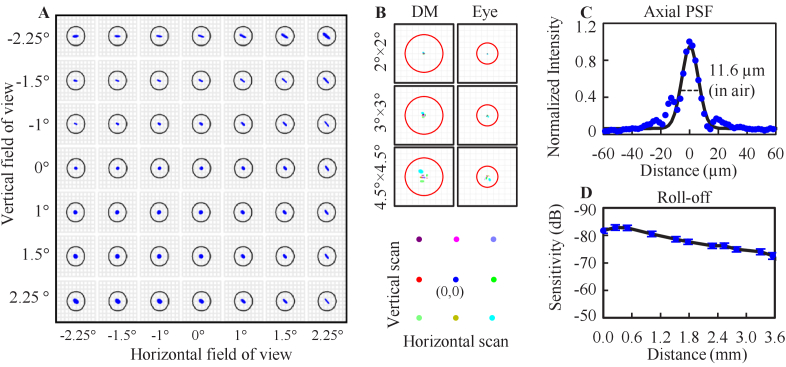
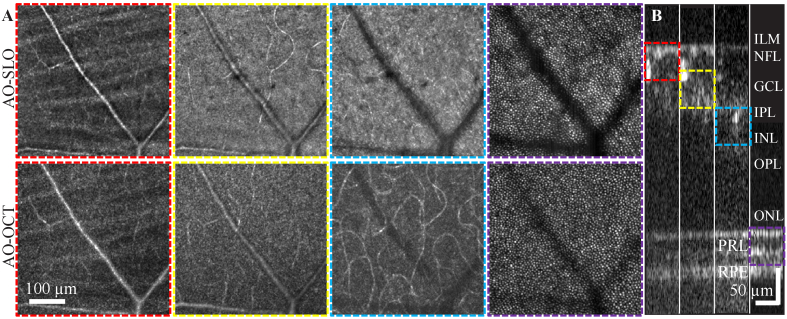
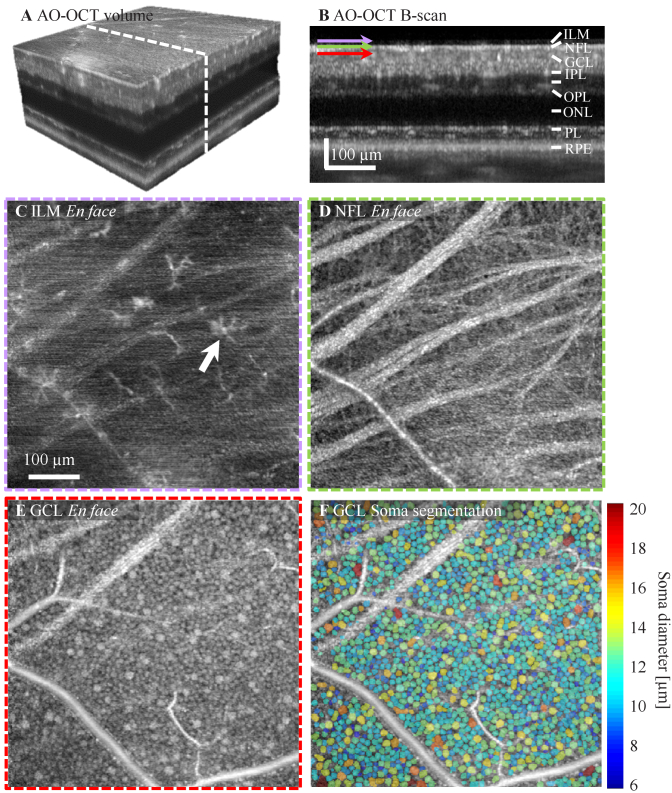
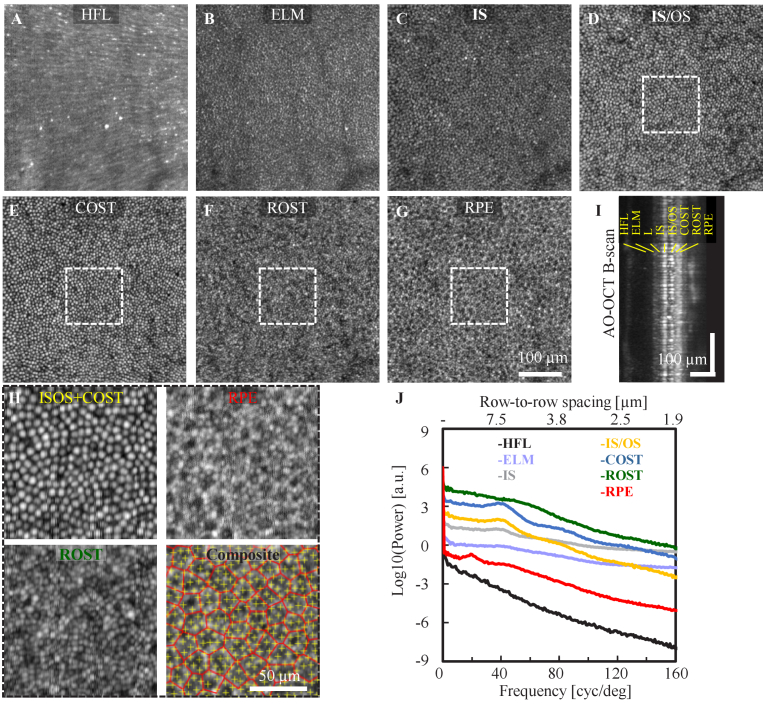
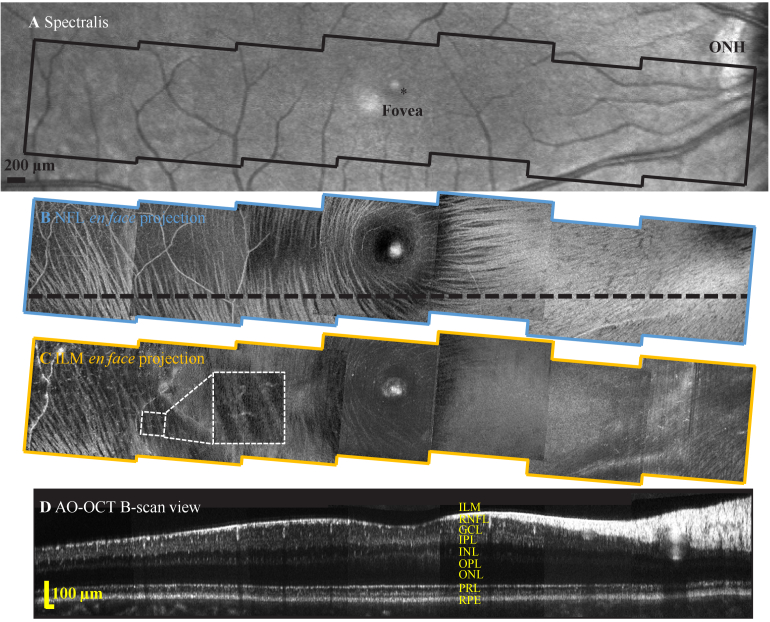
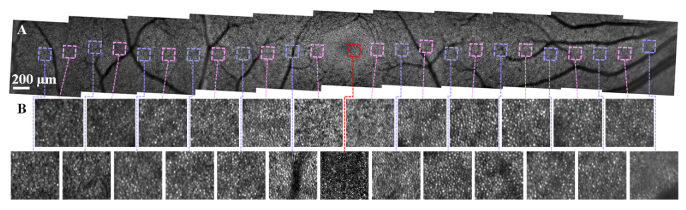
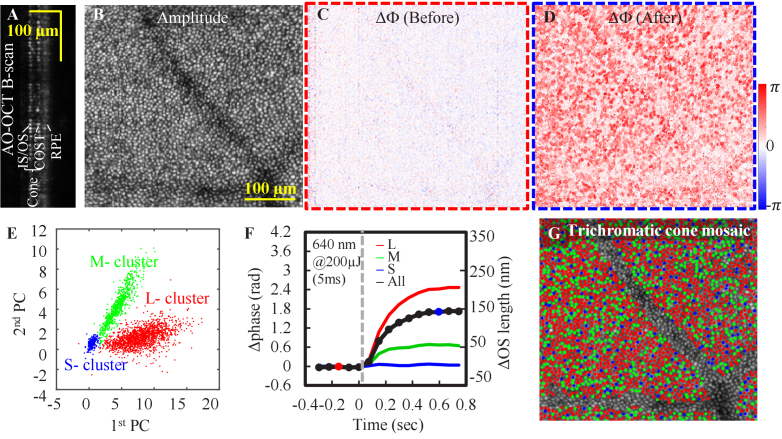
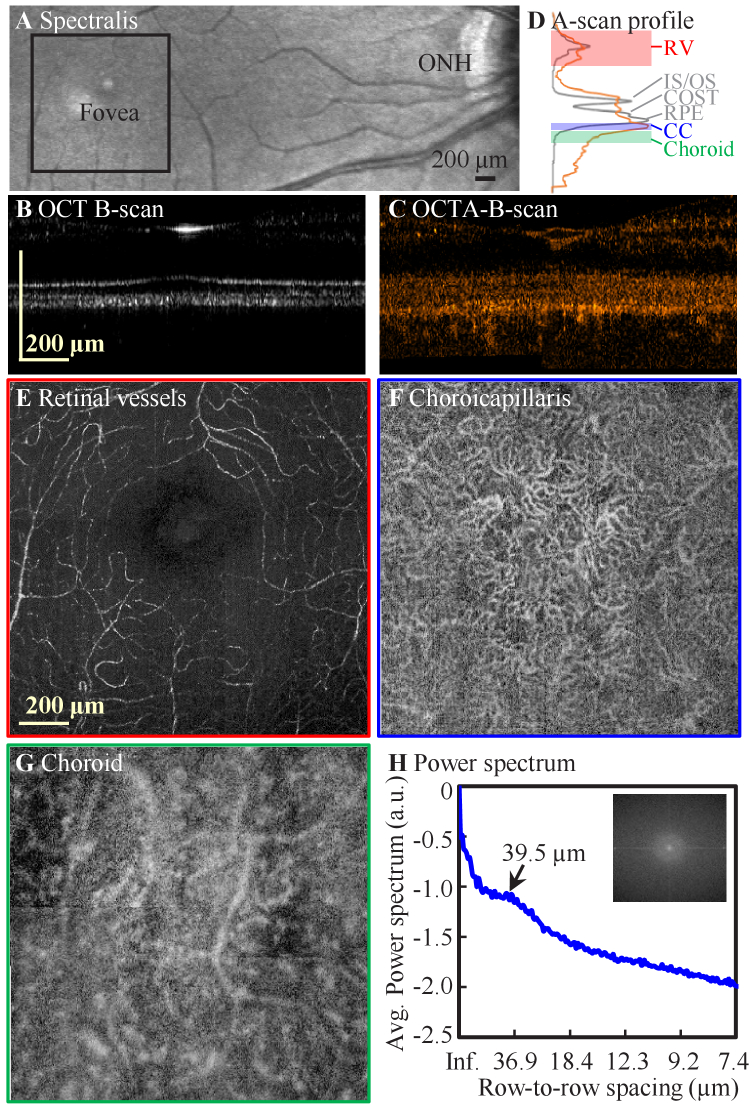
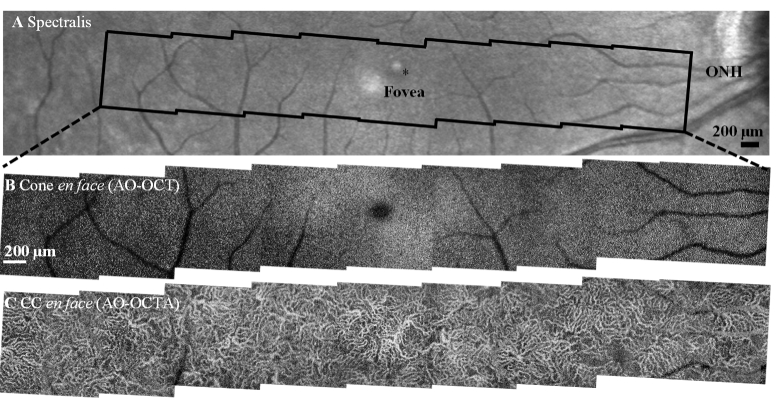
We describe the design and performance of a multimodal and multifunctional adaptive optics (AO) system that combines scanning laser ophthalmoscopy (SLO) and optical coherence tomography (OCT) for simultaneous retinal imaging at 13.4 Hz. The high-speed AO-OCT channel uses a 3.4 MHz Fourier-domain mode-locked (FDML) swept source. The system achieves exquisite resolution and sensitivity for pan-macular and transretinal visualization of retinal cells and structures while providing a functional assessment of the cone photoreceptors. The ultra-high speed also enables wide-field scans for clinical usability and angiography for vascular visualization. The FDA FDML-AO system is a powerful platform for studying various retinal and neurological diseases for vision science research, retina physiology investigation, and biomarker development.


Conflict of interest statement

The mention of commercial products, their sources, or their use in connection with material reported herein is not to be construed as either an actual or implied endorsement of such products by the U.S. Department of Health and Human Services.

Figures

Fig. 1.
Fig. 1.
Schematic layout of the FDA FDML AO system for multimodal and multifunctional retinal imaging flattened for clarity. The swept source OCT uses a typical Mach–Zehnder interferometer design which consists of the source, sample, reference, and detection arms. The OCT reference arm consists of a group of plano mirrors and a retroreflector to match the double-pass optical path length (OPL) of the sample arm. Key: AOM: acousto-optic modulator; APD: avalanche photodiode; BD: balanced detector; BS: beam splitter; DM: deformable mirror; G: galvanometer; I: iris; LP: long-pass dichroic filter; P: pinhole; PC: polarization controller; PM: plano mirror; RS: resonant scanner; S: spherical mirror; SHWS: Shack-Hartmann wavefront sensor; SP: short-pass dichroic filter; SC: supercontinuum.
Fig. 2.
Fig. 2.
Performance of the FDA FDML AO system. A. Ray trace predicted image quality as a function of scan angle with a model eye. Solid black circles denote diffraction-limited blur size. B. Ray trace predicted beam displacement at two pupil conjugate planes. Red circles denote projected SH lenslet size. C. OCT axial resolution (see Data File 1 [56]). D. OCT sensitivity roll-off (see Data File 2 [57]).
Fig. 3.
Fig. 3.
Co-registered averaged 1.5° FOV simultaneous AO-SLO (A top) and AO-OCT (A bottom) retinal images from S1 with the system focus set approximately at four depths (ILM-GCL; GCL-IPL; IPL-OPL and PRL) which are determined by the local intensity of the AO-OCT B scans and AO-SLO real-time visualizations. The AO-SLO data were collected with a one Airy disk diameter (ADD) pinhole. The AO-OCT en face images were created by the amplitude projection of a AO-OCT 50 µm slab through the system depth of focus (DOF) [8]. Each image was averaged across 15 datasets and was produced from videos in Visualization 1. B shows the average of 15 AO-OCT B-scans along the slow scan direction, the image are stitched from four sub-images that were acquired with system focus at the four primary depths from the same retinal location. The color-coded dash boxes represent the ranges for generating the corresponding AO-OCT en face images in A.
Fig. 4.
Fig. 4.
Structural images of inner retinal cells collected at 10° temporal to the fovea from subject S1 with an average of 285 AO-OCT volumes. A. Isometric view of registered and averaged AO-OCT volume with white dashed line denoting cross-section of retina shown in B. Images shown in C-E were extracted at depths of the ILM, NFL, and GCL, respectively. C. Retinal macrophages (both cell body and processes) shown at the surface of the ILM. D. Bundles and individual ganglion cell axons disperse across the NFL. E. A mosaic of GCL somas of varying size tile the layer. F. GCL soma 3D segmentation. The false color map shows the segmented GCL somas that are color coded with cell diameter.
Fig. 5.
Fig. 5.
Structural images of outer retinal cells collected at 3° temporal to the fovea from subject S2 with an average of 190 AO-OCT volumes. En face views of outer retinal cells at different depths show different spatial content. A. The HFL shows radial striation pattern of Henle fiber bundles, B. ELM intensity show negative correlation with underlying cone photoreceptors in (C-E), C. Photoreceptor IS, D. Photoreceptor IS/OS junction. E. COST, F. ROST layer exhibits a hyper reflective mosaic with higher spatial content, presumably from individual rods, G. RPE, H. Magnified views at the cone (IS/OS + COST), rod, and RPE layers (white boxes in D-G) along with the composite view that shows the marked cell locations (yellow cross: cone and red Voronoi: RPE). I. An average AO-OCT B-scan of outer retina with labeled axial depths, and J. Power spectral analysis at the corresponding axial depths (see Data File 3 [60]). For visualization purposes, spectra are normalized to the same DC level and displaced vertically by retinal layers. Images are showed in logarithmic scale.
Fig. 6.
Fig. 6.
Representative wide-field inner retina images from subject S1 collected with the FDA FDML AO system. A. Spectralis macular scan. En face projection views over a -14° to 14° eccentricity range from seven 4.5°×4.5° FOV AO-OCT scans of B. NFBs at NFL and C. macrophages just above the ILM. Inset shows magnified view of one representative macrophage cell at 8° eccentricity. D. AO-OCT B-scan view corresponds to the black dashed line in B.
Fig. 7.
Fig. 7.
Representative wide-field retinal cone images from subject S1 collected with the AO-SLO channel of the FDA FDML AO system. A. Montage of eleven AO-SLO scans with a 3°×3° FOV across a -14° to 14° eccentricity range. B. Enlarged views of the cone mosaics at the corresponding nasal and temporal locations labeled at square boxes in A. Each sub-region is a 150 µm×150 µm field. The sub-region at the fovea was acquired with a 0.75°×0.75° FOV scan (Fig. S2 in Supplement 1) with increased digital sampling.
Fig. 8.
Fig. 8.
Cone structural and functional characterization in subject S1 at 3° nasal retina. A. B-scan and B. en face views show reflectance of individual cones. Cone ΔOPL between IS/OS and COST in response to 640-nm stimulus at time points 3 in C. and 13 in D. E. Plot of first two principal components (PC) used to classify cone types. F. Shows the averaged cone response at all time sequence (see Data File 5 [65]). Averaged cone response in C. and D. are shown as the red and blue filled circles. The classified averaged response for L-, M-, and S- cones are denoted as red, green and blue curves. G. Map of the trichromatic cone mosaic.
Fig. 9.
Fig. 9.
Representative AO-OCTA images collected at the fovea from subject S1 with four 3°×3° FOV scans. A. Spectralis SLO scan. B-scan cross sectional views of B. AO-OCT and C. AO-OCTA and their corresponding A-scan profiles in D for OCT (gray) and OCTA (orange). AO-OCTA en face projections at the depth of E. retinal vessels (RV) (red), F. choriocapillaris (blue), and G. choroid (green). The depths of the integrated projections are defined by the color-shaded regions in D. H. Power spectral analysis of F. shows a peak at the cross-correlation fundamental frequency (see Data File 6 [70]).
Fig. 10.
Fig. 10.
Representative wide-field images of outer retinal features from subject S1 collected with the FDA FDML AO system. A. Spectralis macular scan. En face projection views over -11° to 11° eccentricity range from nine 3°×3° FOV scans. B. AO-OCT intensity projection (IS/OS to COST) shows better delineation of the cone photoreceptor mosaic compared to AO-SLO montage from the same region (Fig. 7) due to the exclusion of signals from neighboring rod photoreceptors and underlying RPE cells. C. Corresponding AO-OCTA scans of the choriocapillaris.

References

    1. Burns S. A., Elsner A. E., Sapoznik K. A., Warner R. L., Gast T. J., “Adaptive optics imaging of the human retina,” Prog. Retinal Eye Res. 68, 1–30 (2019).10.1016/j.preteyeres.2018.08.002 - DOI - PMC - PubMed
    1. Liang J., Williams D. R., Miller D. T., “Supernormal vision and high-resolution retinal imaging through adaptive optics,” J. Opt. Soc. Am. A 14(11), 2884–2892 (1997).10.1364/JOSAA.14.002884 - DOI - PubMed
    1. Roorda A., Romero-Borja F., Donnelly Iii W., Queener H., Hebert T., Campbell M., “Adaptive optics scanning laser ophthalmoscopy,” Opt. Express 10(9), 405 (2002).10.1364/OE.10.000405 - DOI - PubMed
    1. Zhang Y., Rha J., Jonnal R., Miller D., “Adaptive optics parallel spectral domain optical coherence tomography for imaging the living retina,” Opt. Express 13(12), 4792 (2005).10.1364/OPEX.13.004792 - DOI - PubMed
    1. Miller D. T., Kurokawa K., “Cellular scale imaging of transparent retinal structures and processes using adaptive optics optical coherence tomography,” Annu. Rev. Vis. Sci. 6(1), 115–148 (2020).10.1146/annurev-vision-030320-041255 - DOI - PMC - PubMed

LinkOut - more resources