. 2023 Jan 17:16:1107025.
doi: 10.3389/fnmol.2023.1107025. eCollection 2023.

Kinetics of cone specific G-protein signaling in avian photoreceptor cells

Affiliations

Kinetics of cone specific G-protein signaling in avian photoreceptor cells

Chad Yee et al. Front Mol Neurosci. .

Abstract

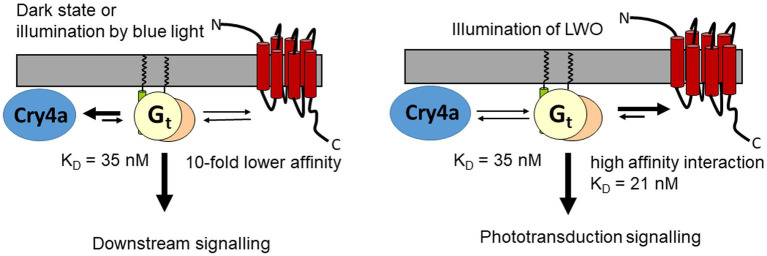
Cone photoreceptor cells of night-migratory songbirds seem to process the primary steps of two different senses, vision and magnetoreception. The molecular basis of phototransduction is a prototypical G protein-coupled receptor pathway starting with the photoexcitation of rhodopsin or cone opsin thereby activating a heterotrimeric G protein named transducin. This interaction is well understood in vertebrate rod cells, but parameter describing protein-protein interactions of cone specific proteins are rare and not available for migratory birds. European robin is a model organism for studying the orientation of birds in the earth magnetic field. Recent findings showed a link between the putative magnetoreceptor cryptochrome 4a and the cone specific G-protein of European robin. In the present work, we investigated the interaction of European robin cone specific G protein and cytoplasmic regions of long wavelength opsin. We identified the second loop in opsin connecting transmembrane regions three and four as a critical binding interface. Surface plasmon resonance studies using a synthetic peptide representing the second cytoplasmic loop and purified G protein α-subunit showed a high affinity interaction with a K D value of 21 nM. Truncation of the G protein α-subunit at the C-terminus by six amino acids slightly decreased the affinity. Our results suggest that binding of the G protein to cryptochrome can compete with the interaction of G protein and non-photoexcited long wavelength opsin. Thus, the parallel presence of two different sensory pathways in bird cone photoreceptors is reasonable under dark-adapted conditions or during illumination with short wavelengths.

Keywords: G protein; cone opsin; cone outer segment; photoreceptor; protein–protein interaction.


Conflict of interest statement

The authors declare that the research was conducted in the absence of any commercial or financial relationships that could be construed as a potential conflict of interest.

Figures

Figure 1
Figure 1
Topography of long wavelength opsin from European robin. Peptides used in the present study are on the intracellular (cytoplasmic) side of the membrane protein indicated by the colored loops (blue, LWO1; yellow, LWO2; green, LWO3; red, LWO4). Extracellular loops are in grey. The seven transmembrane regions (TM1–TM7) are connected via the loops and are presented in purple.
Figure 2
Figure 2
Identification of Gtα/Giα interacting cytoplasmic loops by SPR. Purified Gtα/Giα was immobilized on a CM5 sensor chip via amine coupling. Peptides were dissolved in SPR running buffer and flushed over the surface at a concentration of 100 nM. (A) Comparison of sensorgrams recorded with LWO2 and the control peptide LWO2-sc. The sensorgram of the LWO2 experiment (upper trace) starts at 200 s, because the recording had a longer buffer run before injection than the experiment with LWO2-sc (lower trace) and we cut the prerun containing no information. The black bars indicate the injection of the peptides, white bars show flowing of running buffer. When the injection of the peptide stops, the flow of running buffer triggers the dissociation of the LWO2-Gtα/Giα complex. (B) Sensorgrams displaying the injection of peptides LWO1, LWO3, LWO4, and LWO3-sc. Black and white bars as in (A).
Figure 3
Figure 3
Surface plasmon resonance (SPR) recordings of LWO2 interacting with immobilized Gtα/Giα. Black bar indicates the injection of different peptide concentrations resulting in the association phase, the open bar indicates buffer flow and the dissociation phase, when the injection of the peptide stops. Larger RU values resulted from the injection of higher LWO2 concentrations. Sensorgrams (black lines) obtained after flushing of 5 nM (1), 15 nM (2), 30 nM (3), 50 nM (4), 75 nM (5), and 100 nM (6) LWO2 over immobilized Gtα/Giα lead to the formation of a LWO2-Gtα/Giα complex. Global curve fitting (Langmuir 1:1 binding model, red lines) resulted in an association rate constant ka = 5.36 × 104 M−1 s−1 and a dissociation rate constant kd = 8.12 × 10−4 s−1, KD = 15.1 nM. The set of sensorgrams is representative of 12 different sets (see main text for mean KD).
Figure 4
Figure 4
Fluorescence study with dansylated peptides dansyl-LWO2 and dansyl-LWO2-sc. Peptides and Gtα/Giα were present at equal concentration of 16.7 μM. Excitation was at 280 nm, the emission was recorded from 430 to 550 nm. Left panel: FRET measurements of dansyl-LWO2 in the absence and presence of Gtα/Giα (indicated as Gt); right panel: FRET measurements of dansyl-LWO2-sc in the absence and presence of Gtα/Giα. No emission was observed with label-free peptides in the absence and presence of Gtα/Giα.
Figure 5
Figure 5
Surface plasmon resonance recordings of LWO2 interacting with truncated variants of Gtα/Giα. Gtα/Giα with a C-terminus truncated by three or six amino acids (Gt-3AA and Gt-6AA, respectively) was immobilized on a CM5 sensor chip. Peptide LWO2 was injected and flushed over the surface at a concentration of 120 nM (Gt-3AA) or 100 nM (Gt-6AA). Global curve fitting (Langmuir 1:1 binding model, red lines) resulted for Gt-3AA in an association rate constant ka = 1.08 × 105 M−1 s−1 and a dissociation rate constant kd = 9.37 × 10−4 s−1, KD = 8.7 nM. For Gt-6AA we obtained an association rate constant ka = 1.86 × 104 M−1 s−1 and a dissociation rate constant kd = 9.3 × 10−4 s−1, KD = 50 nM. The sensorgrams are representative of three different sets for each Gtα/Giα variant.
Figure 6
Figure 6
Hypothetical interaction scheme showing two scenarios, interaction of Gt with Cry4a, when LWO is not illuminated, and Gt interacting with LWO under illumination of LWO. The KD value of 35 nM is taken from Görtemaker et al. (2022), KD = 21 refers to the present work.

References

    1. Alves I. D., Salgado G. F., Salamon Z., Brown M. F., Tollin G., Hruby V. J. (2005). Phosphatidylethanolamine enhances rhodopsin photoactivation and transducin binding in a solid supported lipid bilayer as determined using plasmon-waveguide resonance spectroscopy. Biophys. J. 88, 198–210. doi: 10.1529/biophysj.104.046722, PMID: - DOI - PMC - PubMed
    1. Andersson K., Hämäläinen M., Malmqvist M. (1999). Identification and optimization of regeneration conditions for affinity-based biosensor assays. A multivariate cocktail approach. Anal. Chem. 71, 2475–2481. doi: 10.1021/ac981271j, PMID: - DOI - PubMed
    1. Beelen C. J., Asteriti S., Cangiano L., Koch K. W., Dell'Orco D. (2021). A hybrid stochastic/deterministic model of single photon response and light adaptation in mouse rods. Comput. Struct. Biotechnol. J. 19, 3720–3734. doi: 10.1016/j.csbj.2021.06.033, PMID: - DOI - PMC - PubMed
    1. Behnen P., Scholten A., Rätscho N., Koch K. W. (2009). The cone-specific calcium sensor guanylate cyclase activating protein 4 from the zebrafish retina. J. Biol. Inorg. Chem. 14, 89–99. doi: 10.1007/s00775-008-0426-z, PMID: - DOI - PubMed
    1. Bolte P., Einwich A., Seth P. K., Chetverikova R., Heyers D., Wojahn I., et al. (2021). Cryptochrome 1a localisation in light-and dark-adapted retinae of several migratory and non-migratory bird species: no signs of light-dependent activation. Ethol. Ecol. Evol. 33, 248–272. doi: 10.1080/03949370.2020.1870571 - DOI

LinkOut - more resources