

A local-saturation-and-delay MRI method for evaluation of red blood cells aggregation in vivo for tumor-bearing or drug-used rats
- PMID: 36733963
- PMCID: PMC9887193
- DOI: 10.3389/fbioe.2023.1111840
A local-saturation-and-delay MRI method for evaluation of red blood cells aggregation in vivo for tumor-bearing or drug-used rats
Abstract
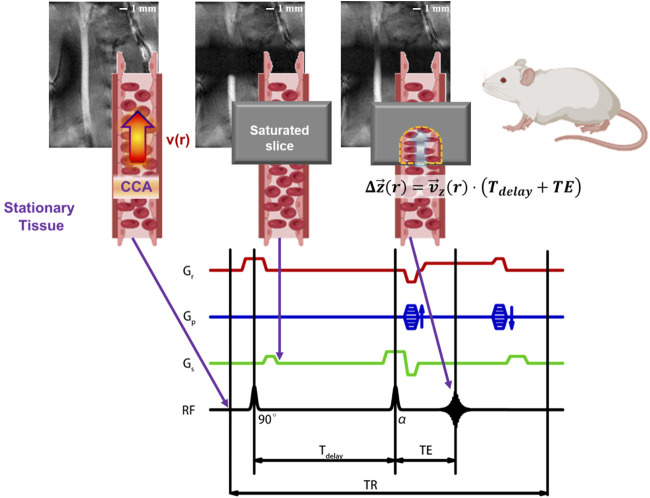
Hyperviscosity syndrome (HVS) is a combination of clinical signs and symptoms related to increased blood viscosity. HVS can increase the thrombotic risk by causing a major disturbance to the blood flow, which is usually found in the advanced stages of the tumor. Moreover, some of the drugs used in chemotherapy, such as 5-fluorouracil and erythropoietin, are also capable of causing HVS through their respective pathways. Clinically, the viscosity of a patient's blood sample is measured by a rotary rheometer to estimate the risk of hyperviscosity syndrome. However, the measurement of blood viscosity in vitro is easily affected by storage time, storage environment, and anticoagulants. In addition, the fluid conditions in the rheometer are quite different from those in natural blood vessels, making this method inappropriate for evaluating blood viscosity and its effects in vivo under physiological condition. Herein, we presented a novel magnetic resonance imaging method called local-saturation-and-delay imaging (LSDI). The radial distributions of flow velocity measured by LSDI are consistent with the Ultrasonic (US) method (Spearman correlation coefficient r = 0.990). But the result of LSDI is more stable than US (p < 0.0001). With the LSDI method, we can directly measure the radial distribution of diastolic flow velocity, and further use these data to calculate the whole blood relative viscosity (WBRV) and erythrocyte aggregation trend. It was a strong correlation between the results measured by LSDI and rotary rheometer in the group of rats given erythropoietin. Furthermore, experimental results in glioma rats indicate that LSDI is equivalent to a rheometer as a method for predicting the risk of hyperviscosity syndrome. Therefore, LSDI, as a non-invasive method, can effectively follow the changes in WBRV in rats and avoid the effect of blood sampling during the experiment on the results. In conclusion, LSDI is expected to become a novel method for real-time in vivo recognition of the cancer progression and the influence of drugs on blood viscosity and RBC aggregation.
Keywords: hyperviscosity syndrome; local-saturation-and-delay imaging; magnetic resonance imaging; sprague-dawley rats; whole blood relative viscosity.
Copyright © 2023 Shan, Shi, Liu, Yuan, Li, Chen and Zhou.
Conflict of interest statement
The authors declare that the research was conducted in the absence of any commercial or financial relationships that could be construed as a potential conflict of interest.
Figures


References
-
- Cherry E. M., Eaton J. K. (2013). Shear thinning effects on blood flow in straight and curved tubes. Phys. Fluids. 25, 073104. 10.1063/1.4816369 - DOI
-
- Fahraeus R., Lindqvist T. (1931). The viscosity of the blood in narrow capillary tubes. Am. J. Physiol. 96, 562–568. 10.1152/ajplegacy.1931.96.3.562 - DOI
LinkOut - more resources
Full Text Sources
Other Literature Sources