. 2023 Feb 16;14(6):1427-1435.
doi: 10.1021/acs.jpclett.2c03729. Epub 2023 Feb 3.

Familial Alzheimer's Disease-Related Mutations Differentially Alter Stability of Amyloid-Beta Aggregates

Affiliations

Familial Alzheimer's Disease-Related Mutations Differentially Alter Stability of Amyloid-Beta Aggregates

Nasrollah Rezaei-Ghaleh et al. J Phys Chem Lett. .

Abstract

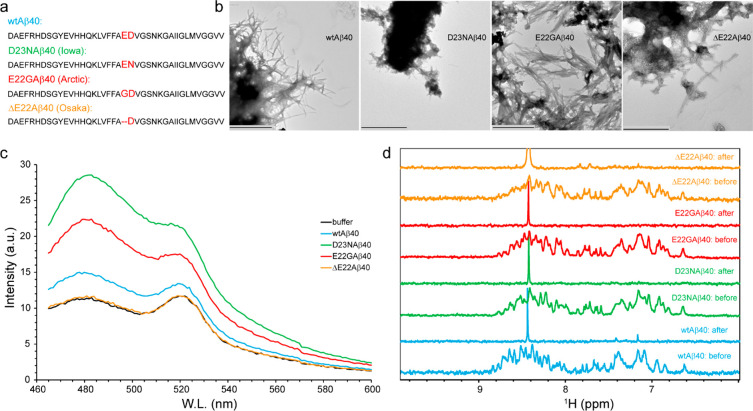
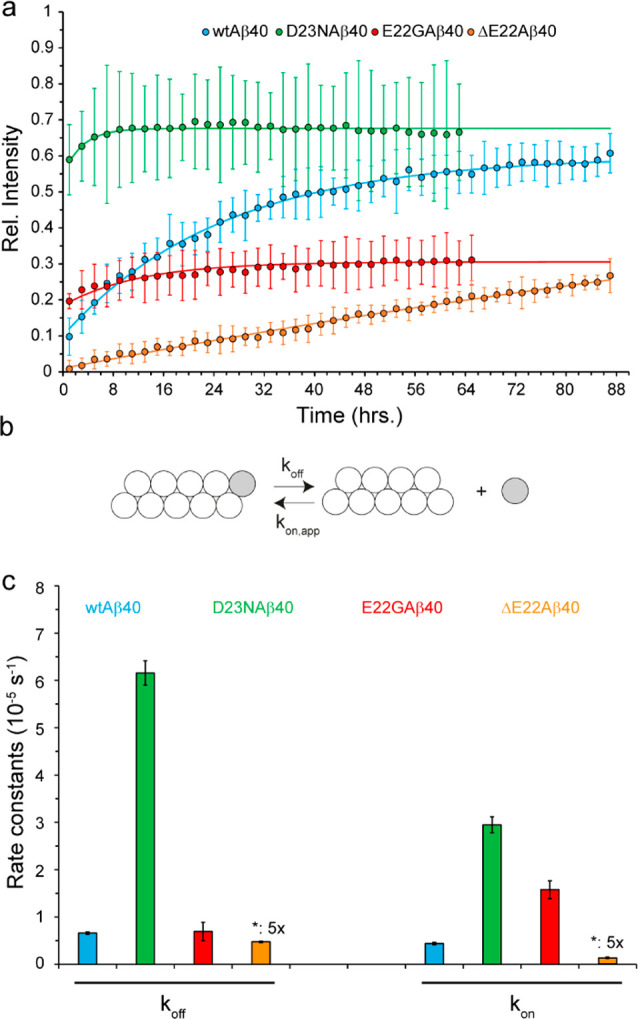
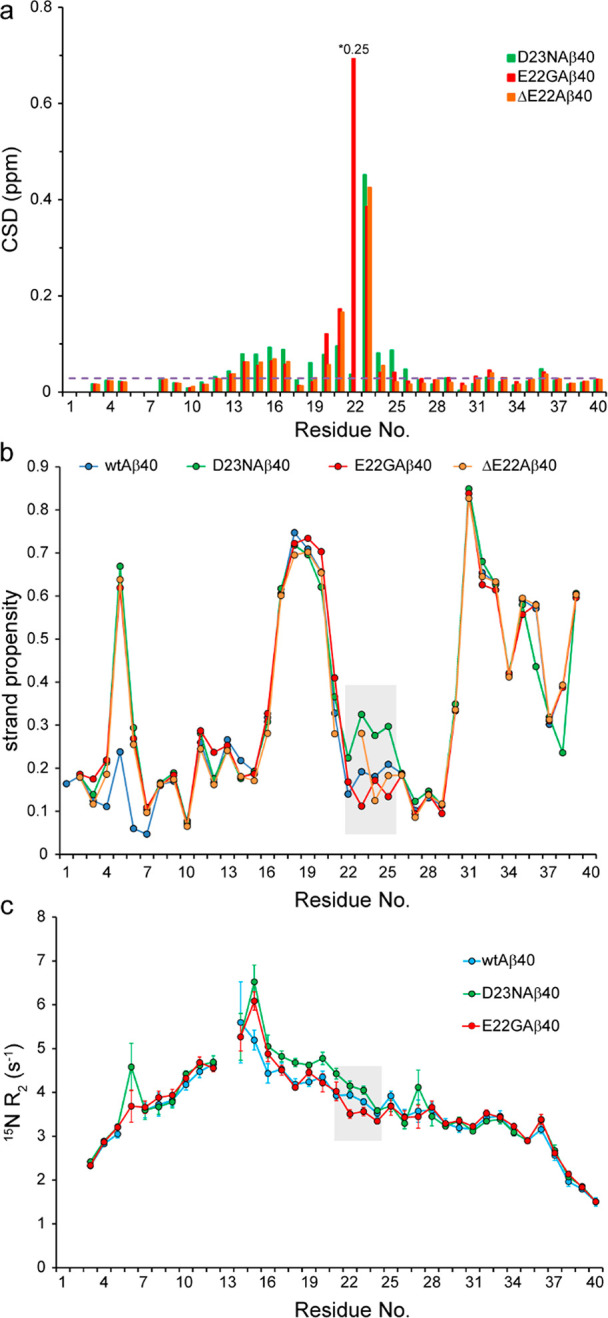
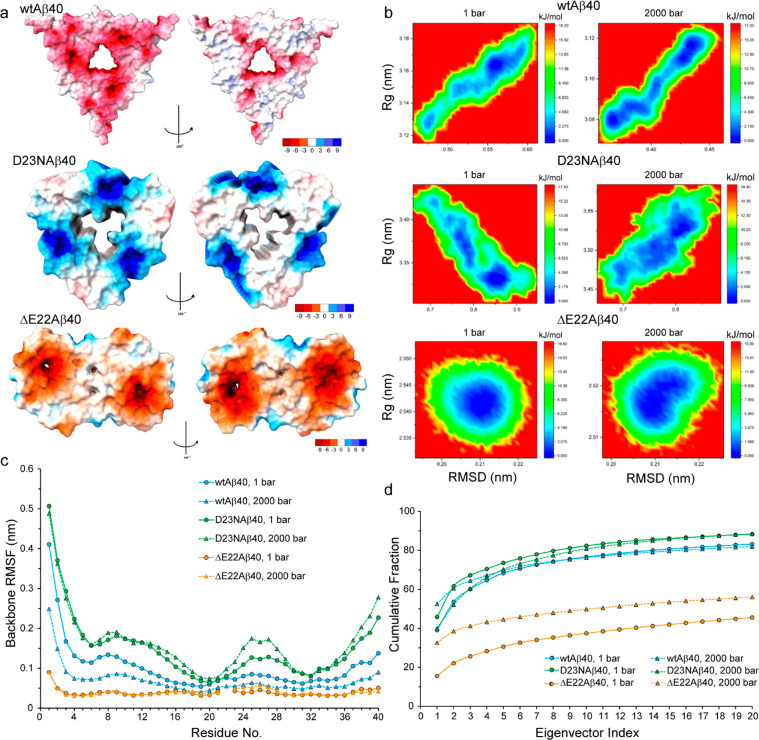
Amyloid-beta (Aβ) deposition as senile plaques is a pathological hallmark of Alzheimer's disease (AD). AD is characterized by a large level of heterogeneity in amyloid pathology, whose molecular origin is poorly understood. Here, we employ NMR spectroscopy and MD simulation at ambient and high pressures and investigate how AD-related mutations in Aβ peptide influence the stability of Aβ aggregates. The pressure-induced monomer dissociation from Aβ aggregates monitored by NMR demonstrated that the Iowa (D23N), Arctic (E22G), and Osaka (ΔE22) mutations altered the pressure stability of Aβ40 aggregates in distinct manners. While the NMR data of monomeric Aβ40 showed only small localized effects of mutations, the MD simulation of mutated Aβ fibrils revealed their distinct susceptibility to elevated pressure. Our data propose a structural basis for the distinct stability of various Aβ fibrils and highlights "stability" as a molecular property potentially contributing to the large heterogeneity of amyloid pathology in AD.


Conflict of interest statement

The authors declare no competing financial interest.

Figures

Figure 1
Figure 1
Fibrillar or nonfibrillar aggregation of Aβ40 variants. (a) Amino acid sequence of wild-type-, D23N- (Iowa), E22G- (Arctic), and ΔE22-Aβ40 (Osaka) variants, with the site of mutation highlighted. (b,c) Transmission electron microscopy (TEM) images and Thioflavin T (ThT) fluorescence emission spectra of Aβ40 samples measured after 48 h of incubation in the aggregation condition (37 °C, gentle agitation). The wild-type-, D23N-, and E22G-Aβ40 formed ThT fluorescence-enhancing fibrils, while the ΔE22-Aβ40 variant showed fibrillar aggregation without ThT fluorescence enhancement. In (b), the scale bars represent 1000 nm for the wild-type and E22G and 600 nm for the D23N- and ΔE22-Aβ40. (d) 1D 1H NMR spectra of Aβ40 variants measured before and after incubation in the aggregation condition. The nearly complete loss of Aβ40 signals indicate conversion of Aβ40 monomers to slowly tumbling assemblies in all the studied Aβ40 variants.
Figure 2
Figure 2
Stability of Aβ40 aggregates against high pressure. (a) Pressure-induced monomer release from Aβ40 aggregates, as followed by real-time NMR experiments at 2000 bar, 278 K, through average (±SD) peak intensities. (b) A simple kinetic model of Aβ40 disaggregation, involving only two states (aggregate state, monomer state) and two rates (dissociation, koff, and back-association, kon). (c) Rate constants obtained from the analysis of monomer release kinetic data shown in (a), according to the simple model shown in (b). The D23N-Aβ40 variant showed much larger koff and kon rates than the wild-type variant, while the ΔE22-Aβ40 variants showed smaller koff and kon rates. See the text for further details and interpretations. For the sake of visibility, the rate constants of ΔE22-Aβ40 are multiplied by a scaling factor of 5. The error bars represent fitting errors.
Figure 3
Figure 3
Effect of FAD mutations on the structure and dynamics of Aβ40 variants. (a) Combined 15N and 1H chemical shift deviation (CSD) of D23N-, E22G-, and ΔE22-Aβ40 peptides with respect to the wild-type-Aβ40, showing significant chemical shift differences around the respective mutation sites and to a lower extent around residues H14-L17. The dashed line represents the noise level in chemical shift values. For the sake of visibility, the CSD value of residue 22 in the E22G-Aβ40 peptide has been scaled down by a factor of 4. (b) The strand propensity of wild-type-, D23N-, E22G-, and ΔE22-Aβ40, calculated on the basis of their backbone (CO, Cα, N, HN, Hα) plus Cβ chemical shifts. The shaded area shows how the respective mutations alter the strand propensity around the site of mutation (see also Supplementary Figure S3). (c) Residue-specific 15N transverse relaxation (R2) rates of Aβ40 variants measured at 278 K. Note the larger R2 of D23N-Aβ40 and smaller R2 of E22G-Aβ40 around the mutation site (shaded area), indicating respectively their relative rigidity and flexibility when compared with the wild-type-Aβ40. The relative rigidity of the D23N-Aβ40 variant extends further proximally to Q15-K16.
Figure 4
Figure 4
MD simulation of wild-type-, D23N-, and ΔE22-Aβ40 fibrils at ambient and high pressure levels. (a) The surface electric potential of wild-type-, D23N-, and ΔE22-Aβ40 fibrils, showing predominantly negative potential for the wild-type and ΔE22 but positive potential for D23N-Aβ40 fibrils. (b) Free energy landscape of different Aβ40 fibrils, plotted as the radius of gyration (Rg) versus root-mean-square of deviation (RMSD) of backbone atoms positions, evaluated at two pressure levels of 1 and 2000 bar. (c) The root-mean-square of fluctuations (RMSF) of backbone atoms for different Aβ40 fibrils, evaluated at two pressure levels of 1 and 2000 bar. (d) Cumulative contribution of the 20 largest modes of motion, as obtained from the principal component analysis of backbone motions in the MD trajectories of different Aβ40 fibrils at two pressure levels of 1 and 2000 bar.

Similar articles

Cited by

References

    1. World Health Organization. Dementia; https://www.who.int/en/news-room/fact-sheets/detail/dementia (accessed Jan. 21, 2023).
    1. DeTure M. A.; Dickson D. W. The neuropathological diagnosis of Alzheimer’s disease. Mol. Neurodegener. 2019, 14, 32.10.1186/s13024-019-0333-5. - DOI - PMC - PubMed
    1. Weggen S.; Beher D. Molecular consequences of amyloid precursor protein and presenilin mutations causing autosomal-dominant Alzheimer’s disease. Alzheimers Res. Ther. 2012, 4, 9.10.1186/alzrt107. - DOI - PMC - PubMed
    1. Ryman D. C.; Acosta-Baena N.; Aisen P. S.; Bird T.; Danek A.; Fox N. C.; Goate A.; Frommelt P.; Ghetti B.; Langbaum J. B.; Lopera F.; Martins R.; Masters C. L.; Mayeux R. P.; McDade E.; Moreno S.; Reiman E. M.; Ringman J. M.; Salloway S.; Schofield P. R.; Sperling R.; Tariot P. N.; Xiong C.; Morris J. C.; Bateman R. J.; Symptom onset in autosomal dominant Alzheimer disease: a systematic review and meta-analysis. Neurology 2014, 83, 253–260. 10.1212/WNL.0000000000000596. - DOI - PMC - PubMed
    1. Bertram L.; Tanzi R. E. Thirty years of Alzheimer’s disease genetics: the implications of systematic meta-analyses. Nat. Rev. Neurosci. 2008, 9, 768–778. 10.1038/nrn2494. - DOI - PubMed