. 2023 May 4;13(5):1210-1229.
doi: 10.1158/2159-8290.CD-22-1131.

Targeted MDM2 Degradation Reveals a New Vulnerability for p53-Inactivated Triple-Negative Breast Cancer

Affiliations

Targeted MDM2 Degradation Reveals a New Vulnerability for p53-Inactivated Triple-Negative Breast Cancer

Clare M Adams et al. Cancer Discov. .

Erratum in

Abstract

Triple-negative breast cancers (TNBC) frequently inactivate p53, increasing their aggressiveness and therapy resistance. We identified an unexpected protein vulnerability in p53-inactivated TNBC and designed a new PROteolysis TArgeting Chimera (PROTAC) to target it. Our PROTAC selectively targets MDM2 for proteasome-mediated degradation with high-affinity binding and VHL recruitment. MDM2 loss in p53 mutant/deleted TNBC cells in two-dimensional/three-dimensional culture and TNBC patient explants, including relapsed tumors, causes apoptosis while sparing normal cells. Our MDM2-PROTAC is stable in vivo, and treatment of TNBC xenograft-bearing mice demonstrates tumor on-target efficacy with no toxicity to normal cells, significantly extending survival. Transcriptomic analyses revealed upregulation of p53 family target genes. Investigations showed activation and a required role for TAp73 to mediate MDM2-PROTAC-induced apoptosis. Our data, challenging the current MDM2/p53 paradigm, show MDM2 is required for p53-inactivated TNBC cell survival, and PROTAC-targeted MDM2 degradation is an innovative potential therapeutic strategy for TNBC and superior to existing MDM2 inhibitors.

Significance: p53-inactivated TNBC is an aggressive, therapy-resistant, and lethal breast cancer subtype. We designed a new compound targeting an unexpected vulnerability we identified in TNBC. Our MDM2-targeted degrader kills p53-inactivated TNBC cells, highlighting the requirement for MDM2 in TNBC cell survival and as a new therapeutic target for this disease. See related commentary by Peuget and Selivanova, p. 1043. This article is highlighted in the In This Issue feature, p. 1027.


Conflict of interest statement

Conflict of Interest: JMS owns equity and consults for Alliance Discovery, Inc., Context Therapeutics, and Syndeavor Therapeutics, Inc. JMS and CME have patents pending on MDM2 PROTAC compounds. The other authors declare no competing interests.

Figures

Figure 1.
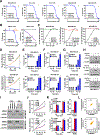
Figure 1.. Our MDM2-PROTAC (YX-02–030) binds MDM2 with high affinity, recruits VHL, and targets MDM2 for proteosome degradation.
A, Chemical structure of MDM2-PROTAC (synthesis in Supplementary Fig. S1A). B and C, MDM2:p53 and MDM2:VHL-HIF1α peptide binding inhibition determined by homogeneous time-resolved fluorescence (HTRF, triplicate, mean ± SEM, B) and surface plasmon resonance (SPR, triplicate, mean ± SD, C; see also Supplementary Fig. 1B) binding assays by the indicated compounds. Graphical data is representative of 3 separate experiments. D, AlphaScreen of ternary complex using GST-MDM2 and HIS-VHL; mean ± SD. E and F, Western blot analysis for the proteins indicated following a dose-titration (E, 16hr) and time course (F, 6μM) with the PROTAC or vehicle control (DMSO, -) in MDA-MB-231 (p53-mutant) and MDA-MB-436 (p53-delete) cells. G-K, Western blot analysis for the proteins indicated following treatment with the MDM2-PROTAC and/or the neddylation activating enzyme inhibitor MLN4924 (G), the proteasome inhibitor MG132 (H), RG7112 (I), VHL-Amine (J), the VHL small molecule inhibitor VH298 (K), or DMSO vehicle control (–).
Figure 2.
Figure 2.. MDM2-PROTAC is more effective than MDM2 inhibitors at activating p53 and killing p53 wild-type breast cancer cells.
MCF7 breast cancer cells (wild-type p53) were treated with the compounds indicated at 3μM, unless otherwise stated, or DMSO vehicle control. A, Western blotting for the indicated proteins and B, dose-titration curves (quadruplicate, MTT survival assay, 48hr) were performed. C-E, Apoptosis analyses, included Caspase-3 activity assay (C, triplicate), Western blotting for cPARP (D), and apoptotic subG1 DNA analysis (E, triplicate). F and G, expression of p53 target genes were evaluated by qRT-PCR (F, triplicate) and Western blotting (G). Acetyl choline receptor (AchR), served as a negative control for F. Cells were treated for 24hr for A, D, F and G. H, Mammosphere formation of MCF7 cells with the compounds indicated or DMSO control (-, triplicate, 72hr). I and J, MCF7 mammospheres were established and following treatment with the compounds indicated or DMSO control (–) survival/ATP production (I, quadruplicate, 72hr) and Caspase-3/7 activity (J, quadruplicate, 72hr) was determined. Representative images are shown (scale bar 300μm). Mean ± SD (B, C, E, H-J); mean ± SEM (F). For C, *P<0.0015, comparing each compound to DMSO vehicle control and **P<0.00021, comparing PROTAC to control compounds. For E, *P<0.0001, comparing each compound to DMSO vehicle control and **P<0.0001, comparing PROTAC to control compounds. For F, *P<0.0001, comparing each compound to DMSO vehicle control and **P<0.0001, comparing PROTAC to control compounds, except for PUMA (PROTAC vs RG7112, P=0.3714). For H, *P<0.00021, comparing each compound to DMSO vehicle control and **P<0.0016 and ***P<0.0001, comparing 3μM and 4μM PROTAC, respectively, to control compounds. For I, *P<0.0001, comparing each compound to DMSO vehicle control and **P<0.0001 and ***P<0.0001, comparing 3μM and 4μM PROTAC, respectively, to control compounds. For J, *P<0.0001, comparing each compound to DMSO vehicle control and **P<0.0001 and ***P<0.0001, comparing 3μM and 4μM PROTAC, respectively, to control compounds. 2-way ANOVA (C, E, F) and 1-way ANOVA (H-J).
Figure 3.
Figure 3.. MDM2-PROTAC induces apoptosis of p53 mutant and deleted TNBC cells.
A, Dose-titration curves (quadruplicate, MTT or MTS survival assay, 48hr) of TNBC cell lines with p53 mutation (MDA-MB-231, HCC-1143, HCC-1395) or p53 deletion (MDA-MB-436, MDA-MB-453) treated with the compounds indicated or DMSO vehicle control. B, Dose-titration curves (quadruplicate, MTT survival assay, 48hr) of Mdm2+/+p53−/− and Mdm2−/−p53−/− mouse sarcoma cells treated with the indicated compounds; ABT-263 is a positive control. C, Inhibition of MDM2-PROTAC-induced death measured by competition assays with the indicated compounds in MDA-MB-231 cells (quadruplicate, MTT assay, 48hr). D, TNBC cells treated with their IC50 (5μM for both) of MDM2-PROTAC, 5μM of control compounds, or DMSO vehicle control and MTT assays (quadruplicate) at 24hr intervals. E-G, MDA-MB-231 and MDA-MB-436 cells treated with MDM2-PROTAC (4μM) or DMSO vehicle control and apoptosis measured by Annexin-V positivity (E, triplicate), Caspase-3 activity (F, triplicate), and apoptotic subG1 DNA content (G, triplicate). H, Western blot analysis for the proteins indicated following treatment with MDM2-PROTAC and/or the compounds indicated, or DMSO vehicle control (–). β-ACTIN blots are the same as in Fig. 1H, 1J, and 1K. I-K, TNBC cells expressing three independent MDM2 shRNA or non-targeting control shRNA (shNT) and Western blots performed for the proteins indicated (I), MTT growth assays (quadruplicate, 24hr intervals, J), and apoptosis (K) measured by Annexin-V positivity (triplicate, left) and apoptotic subG1 DNA content (triplicate, right). Mean ± SD (A-G, J, K). For D-G, *P<0.0001, comparing PROTAC to control compounds and DMSO vehicle control. For J and K, *P<0.00051, comparing MDM2 shRNA to non-targeting control shRNA. 2-way ANOVA (D, J, K (left)), 1-way ANOVA (K (right)), and unpaired 2-tailed t-test (E-G). L, Spearman’s correlation of differential gene expression of RNA-seq data (triplicates) from MDA-MB-231 and MDA-MB-436 cells treated with MDM2-PROTAC versus expressing MDM2 shRNA, each first compared to their respective DMSO vehicle control or non-targeting shRNA control. Correlation coefficients (ρ) and P-values indicated.
Figure 4.
Figure 4.. Apoptosis induction of p53-inactivated TNBC cells in 2D and 3D cultures by the MDM2-PROTAC.
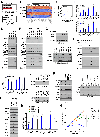
A and B, Colony formation assays (A, triplicate, 12 days) and mammosphere formation (B, triplicate, 72hr) of MDA-MB-231 and MDA-MB-436 cells in the presence of the indicated compounds or DMSO control (–); representative pictures shown (A). C-E, Formed mammospheres of MDA-MB-231 and MDA-MB-436 cells were treated with the compounds indicated or DMSO control (–), and area (C, n=10 mammospheres, relative to pre-treatment area, 72hr), real-time imaging (IncuCyte) and quantification of Caspase-3/7 activity (D, n=4–5 wells/compound), and survival/ATP assays (E, quadruplicate, 72hr) were performed; representative images shown; scale bar 300μm. Mean ± SEM (A-C and E). For A, *P<0.0001 and **P<0.0001, comparing 1μM and 2μM PROTAC, respectively, to control compounds and DMSO vehicle control. For B, *P<0.0046, **P<0.0001, and ***P<0.0001, comparing 0.5μM, 1μM, and 2μM PROTAC, respectively, to control compounds and DMSO vehicle control. For C, *P<0.0001 and **P<0.0001, comparing 2μM and 4μM/6μM PROTAC, respectively, to control compounds and DMSO vehicle control. For E, *P<0.0001 and **P<0.0001, comparing 3μM and 4μM PROTAC, respectively, to control compounds and DMSO vehicle control. 1-way ANOVA (A-C and E).
Figure 5.
Figure 5.. MDM2-PROTAC kills p53-inactivated TNBC cells in vivo.
A, Liver microsomal stability evaluated for the MDM2-PROTAC and control compounds. Midazolam served as an unstable control. B, Pharmacokinetic analysis of MDM2-PROTAC in plasma in mice (n=3/timepoint, single 10mg/kg intraperitoneal injection of MDM2-PROTAC). C-I, MDA-MB-231 and MDA-MB-436 cells were injected (subcutaneous) into one flank of nude mice and allowed to form palpable tumors (approximately 80mm3). Mice (randomized into tumor-size matched groups) were treated (intraperitoneal injection) with MDM2-PROTAC, RG7112D, or vehicle control at 50mg/kg once daily for 14 days (treatment start, green arrow and stop, red arrow). Kaplan-Meier survival analysis (C) and tumor volume (D; individual, left and averaged, right) were evaluated overtime. E-I, After 72hr of treatment, tumors (n=3/group) were harvested and protein expression evaluated by Western blotting (E; -, vehicle control), Annexin-V positivity (F), Caspase-3 activity (G), apoptotic subG1 DNA content (H), and viability by Trypan Blue dye exclusion (I). Mean ± SD (B, D (right), F-I). Log-rank tests for C, and longitudinal tumor growth analysis using 2-way ANOVA with Bonferroni correction for D; P-values indicated. *P<0.0021 for F, *P<0.0001 for G, *P<0.0147 for H, and *P<0.0014 for I were determined using unpaired two-tailed t-tests, comparing PROTAC to vehicle control. .
Figure 6.
Figure 6.. TP53 mutant TNBC patient-derived explants undergo apoptosis following treatment with the MDM2-PROTAC.
A, TP53 sequenced in five fresh TNBC patient samples and used in explant and 3D mammosphere cultures. B and C, TNBC patient-derived explants were treated with the compounds indicated and Western blotting (B) and immunohistochemistry (IHC) of FFPE sections for cleaved Caspase-3 (C, n=3 paired patient samples) were performed. Representative images of H&E and cleaved Caspase-3 (CC3) IHC shown, including normal breast epithelium treated with MDM2-PROTAC; scale bar 300μm. D and E, Mammosphere cultures were established from TNBC patient samples, treated with the indicated compounds, and live-cell detection of Caspase-3/7 activity (D, quadruplicate) and mammosphere survival/ATP production (E, quadruplicate, 96hr) were measured. Normal breast epithelium from a patient that formed loose aggregates was also treated with MDM2-PROTAC. For comparison, values for TNBC-4 and the normal breast mammospheres are relative to DMSO vehicle control (E, right graph). Representative images shown (RG, RG7112 and RG-D, RG7112D); scale bar 300μm. Mean ± SD (C-E). For C, *P=0.0477 (unpaired two-tailed t-test), comparing PROTAC to DMSO. For D and E, *P<0.0001 (2-way and 1-way ANOVA, respectively), comparing PROTAC to control compounds and DMSO vehicle control.
Figure 7.
Figure 7.. TAp73 is activated by the MDM2-PROTAC and mediates apoptosis of p53-inactivated TNBC cells.
A-C, RNA-seq (triplicates) was performed on MDA-MB-231 cells treated with the MDM2-PROTAC (6μM, 16hr) or DMSO vehicle control or expressing MDM2 shRNA or non-targeting control shRNA (48hr). A, Pathway enrichment analysis using Hallmark gene signatures. B, Heatmap of p53 family target genes of individual samples (3 each). C, Spearman’s correlation of differentially expressed p53 family target genes between PROTAC-treated relative to DMSO vehicle control and MDM2 shRNA relative to non-targeting shRNA control; Spearman’s correlation coefficient (ρ) and P-value indicated. D, qRT-PCR analysis (triplicate, 6μM, 16hr) to validate RNA-seq results. E-H, Western blotting performed for the proteins indicated following treatment with MDM2-PROTAC, control compounds, or DMSO vehicle control (–) of MDA-MB-231 cells growing in culture (E, 6μM, 16hr), MDA-MB-231 subcutaneous tumors harvested 72hr after treatment began (G, top, same β-ACTIN blot as Fig. 5E), TNBC patient-derived explants (G, bottom, same β-ACTIN blots as Fig. 6B), following knockdown of MDM2 with two shRNA or non-targeting shRNA (shNT) control in MDA-MB-231 cells (F), or following treatment with the PROTAC (6μM, 16hr) in MDA-MB-231 cells pre-treated (1hr, 10μM) with RG7112, VHL-Amine, or VH298 (H). I, TAp73 ChIP was performed with MDA-MB-231 cells following treatment with the MDM2-PROTAC (6μM, 16hr) or DMSO vehicle control, and enrichment of TAp73 (triplicate; first normalized to input DNA then IgG control) was determined at the loci indicated. J, MDA-MB-231 cells pre-treated (1hr, 10μM) with MG132 were treated with MDM2-PROTAC (6μM, 16hr) or DMSO vehicle control and MDM2 (top) and TAp73 (bottom) were immunoprecipitated and proteins Western blotted. K, Whole cell lysates (WCL) from MDA-MB-231 cells treated with MDM2-PROTAC, RG7112D, RG7112 (all at 6μM, 16hr) or DMSO vehicle control were Western blotted (left), or TAp73 was immunoprecipitated and then proteins Western blotted (right). L and M, After 48hr, MDA-MB-231 cells expressing two independent TAp73 shRNA or non-targeting shRNA (shNT) control were treated with MDM2-PROTAC or DMSO vehicle control (6μM, 16hr). p53/TAp73 target genes were evaluated by Western blotting (L) and qRT-PCR (M, triplicate). N, MTT assay (quadruplicate, 24hr intervals) of MDA-MB-231 cells expressing two independent TAp73 shRNA or non-targeting shRNA (shNT) control and treated with MDM2-PROTAC (4μM) or DMSO vehicle control. Mean ± SEM (D, I, M) and mean ± SD (N). For D and I, *P<0.0001 (unpaired two-tailed t-tests), comparing PROTAC to DMSO vehicle control or MDM2 shRNA to non-targeting control shRNA. For M, *P<0.0015, comparing non-targeting shRNA control with PROTAC to DMSO vehicle control and **P<0.0012, comparing TAp73 shRNA with PROTAC to non-targeting shRNA control with PROTAC; 2-way ANOVA. For N, *P<0.00081, comparing non-targeting control shRNA with PROTAC to DMSO vehicle control and **P<0.0031, comparing TAp73 shRNA with PROTAC to non-targeting control shRNA with PROTAC; 2-way ANOVA. For E-G and L, long exp is long exposure.

Comment in

References

    1. Zhou X, Hao Q, Lu H. Mutant p53 in cancer therapy-the barrier or the path. J Mol Cell Biol 2019;11(4):293–305 doi 10.1093/jmcb/mjy072. - DOI - PMC - PubMed
    1. Levine AJ. The many faces of p53: something for everyone. J Mol Cell Biol 2019;11(7):524–30 doi 10.1093/jmcb/mjz026. - DOI - PMC - PubMed
    1. Shah SP, Roth A, Goya R, Oloumi A, Ha G, Zhao Y, et al. The clonal and mutational evolution spectrum of primary triple-negative breast cancers. Nature 2012;486(7403):395–9 doi 10.1038/nature10933. - DOI - PMC - PubMed
    1. Darb-Esfahani S, Denkert C, Stenzinger A, Salat C, Sinn B, Schem C, et al. Role of TP53 mutations in triple negative and HER2-positive breast cancer treated with neoadjuvant anthracycline/taxane-based chemotherapy. Oncotarget 2016;7(42):67686–98 doi 10.18632/oncotarget.11891. - DOI - PMC - PubMed
    1. Turner N, Moretti E, Siclari O, Migliaccio I, Santarpia L, D’Incalci M, et al. Targeting triple negative breast cancer: is p53 the answer? Cancer Treat Rev 2013;39(5):541–50 doi 10.1016/j.ctrv.2012.12.001. - DOI - PubMed

Publication types

MeSH terms

Substances