Clinical Trial
. 2023 Mar;5(2):e220022.
doi: 10.1148/rycan.220022.

Pretherapy Ferumoxytol-enhanced MRI to Predict Response to Liposomal Irinotecan in Metastatic Breast Cancer

Affiliations
Clinical Trial

Pretherapy Ferumoxytol-enhanced MRI to Predict Response to Liposomal Irinotecan in Metastatic Breast Cancer

Harshan Ravi et al. Radiol Imaging Cancer. 2023 Mar.

Abstract

Purpose To investigate ferumoxytol (FMX)-enhanced MRI as a pretreatment predictor of response to liposomal irinotecan (nal-IRI) for thoracoabdominal and brain metastases in women with metastatic breast cancer (mBC). Materials and Methods In this phase 1 expansion trial (ClinicalTrials.gov identifier, NCT01770353; 27 participants), 49 thoracoabdominal (19 participants; mean age, 48 years ± 11 [SD]) and 19 brain (seven participants; mean age, 54 years ± 8) metastases were analyzed on MR images acquired before, 1-4 hours after, and 16-24 hours after FMX administration. In thoracoabdominal metastases, tumor transverse relaxation rate (R*2) was normalized to the mean R*2 in the spleen (rR*2), and the tumor histogram metric rR*2,N, representing the average of rR*2 in voxels above the nth percentile, was computed. In brain metastases, a novel compartmentation index was derived by applying the MRI signal equation to phantom-calibrated coregistered FMX-enhanced MRI brain scans acquired before, 1-4 hours after, and 16-24 hours after FMX administration. The fraction of voxels with an FMX compartmentation index greater than 1 was computed over the whole tumor (FCIGT1) and from voxels above the 90th percentile R*2 (FCIGT1 R*2,90). Results rR*2,90 computed from pretherapy MRI performed 16-24 hours after FMX administration, without reference to calibration phantoms, predicted response to nal-IRI in thoracoabdominal metastases (accuracy, 74%). rR*2,90 performance was robust to the inclusion of some peritumoral tissue within the tumor region of interest. FCIGT1 R*2,90 provided 79% accuracy on cross-validation in prediction of response in brain metastases. Conclusion This first in-human study focused on mBC suggests that FMX-enhanced MRI biologic markers can be useful for pretherapy prediction of response to nal-IRI in patients with mBC. Keywords: MRI Contrast Agent, MRI, Breast, Head/Neck, Tumor Response, Experimental Investigations, Brain/Brain Stem Clinical trial registration no. NCT01770353 Supplemental material is available for this article. © RSNA, 2023 See also commentary by Daldrup-Link in this issue.

Keywords: Brain/Brain Stem; Breast; Experimental Investigations; Head/Neck; MRI; MRI Contrast Agent; Tumor Response.


Conflict of interest statement

Disclosures of conflicts of interest: H.R. No relevant relationships. A.M.A.L. No relevant relationships. J.R.C. No relevant relationships. H.S.H. Research funding to institution from AbbVie, Arvinas, GSK, G1 Therapeutics, Quantum Leap Healthcare Collaborative, Marker, Pfizer, Zymeworks, Celcuity, and Department of Defense; payment for speakers bureaus from Lilly; advisory board for Novartis, AstraZeneca, and Gilead. D.K.J. R37 NCI/NIH grant 1R37CA229810-01A1 (Using Radiogenomics to Noninvasively Predict the Malignant Potential of Intraductal Papillary Mucinous Neoplasms of the Pancreas and Uncover Hidden Biology). S.G.K. Employee of Merrimack Pharmaceuticals (to March 2017) and Ipsen Bioscience, Merrimack was the initial clinical study sponsor; patent applications for treatment of breast cancer with liposomal irinotecan with Ipsen Biopharm; Ipsen stock and stock grants. J.C.S. Funding and drug support to institution to conduct the trial: Merrimack (and later Ipsen); funding and drug support for conduct of clinical trial to institution from Merck, Pfizer, Tesaro/GSK, Plexxikon, Corcept, AbbVie, Bolt Biotherapeutics, Immune Sensor Therapeutics, Syros Pharmaceuticals, Agenus, Sermonix, Ipsen, Arcus, Endocyte, Five Prime, and Baxter; honoraria for advisory board participation from Pfizer, Immunomedics, AstraZeneca, Novartis, Tempus, and Ipsen; stock options in Biosplice Therapeutics; employer-employee relationship with Biosplice Therapeutics. R.L.K. No relevant relationships. N.R. Funding was received from Ipsen Pharmaceuticals and Imaging Endpoints to institution to defray study-related costs. Some of the reported work was performed by the Quantitative Imaging Shared Service (Core) of the Moffitt Cancer Center, which is partly supported by funding from the NIH (P30 CA076292); grant funding that was unrelated to the work reported in this article: NIH: R01 CA249016 (MPI), U01 CA200464(co-I), U01 CA143062 (co-I), U54 CA193489 (co-I), State of Florida: “Live Like Bella Foundation” (co-I), Halozyme Therapeutics: 2-year research grant (PI), HealthMyne: 1-year research grant (co-I); Gillies RJ, Gatenby RA, Raghunand N, Arrington J, Stringfield O, Balagurunathan Y, Goldgof DB, Hall LO. Radiologically Identified Tumor Habitats. US Patent No. 10,827,945 (subject matter of the patent is unrelated to the work reported in this article).

Figures

None
Graphical abstract
Timing of ferumoxytol (FMX)-enhanced MRI, diagnostic imaging, and
liposomal irinotecan (nal-IRI) treatment in a phase 1 study of nal-IRI in an
expansion cohort of participants with metastatic breast cancer. Pretreatment
FMX-enhanced MRI scans were acquired before FMX and 16–24 hours after
FMX administration in 27 participants. In 18 participants, FMX-enhanced MRI
scans were also acquired 1–4 hours after FMX administration. The
nal-IRI treatment regimen and standard-of-care diagnostic imaging were
initiated approximately 1 week after the end of FMX-enhanced MRI
sessions.
Figure 1:
Timing of ferumoxytol (FMX)-enhanced MRI, diagnostic imaging, and liposomal irinotecan (nal-IRI) treatment in a phase 1 study of nal-IRI in an expansion cohort of participants with metastatic breast cancer. Pretreatment FMX-enhanced MRI scans were acquired before FMX and 16–24 hours after FMX administration in 27 participants. In 18 participants, FMX-enhanced MRI scans were also acquired 1–4 hours after FMX administration. The nal-IRI treatment regimen and standard-of-care diagnostic imaging were initiated approximately 1 week after the end of FMX-enhanced MRI sessions.
Radiologic follow-up of individual tumors. Tumor diameter change for
49 thoracoabdominal tumors from 19 participants. Notation at the top of each
plot indicates participant (P) number and corresponding lesion (L) number
with response status (1 for responding tumors and 0 for nonresponding
tumors).
Figure 2:
Radiologic follow-up of individual tumors. Tumor diameter change for 49 thoracoabdominal tumors from 19 participants. Notation at the top of each plot indicates participant (P) number and corresponding lesion (L) number with response status (1 for responding tumors and 0 for nonresponding tumors).
Radiologic follow-up of individual tumors. Tumor diameter change for
19 brain tumors from seven participants. Notation at the top of each plot
indicates participant (P) number and corresponding lesion (L) number with
response status (1 for responding tumors, 0 for nonresponding
tumors).
Figure 3:
Radiologic follow-up of individual tumors. Tumor diameter change for 19 brain tumors from seven participants. Notation at the top of each plot indicates participant (P) number and corresponding lesion (L) number with response status (1 for responding tumors, 0 for nonresponding tumors).
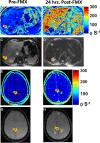
Transverse relaxation rate (R*2) maps computed before
ferumoxytol (FMX) and 24 hours after FMX administration in a representative
participant with (A, B) liver and (E, F) brain metastases (arrows).
R*2-weighted anatomic images on which radiologists drew tumor regions
of interest (arrows) are shown for (C, D) liver and (G, H) brain. The color
scale, from blue to red, indicates increasing values of R*2 (in
seconds−1).
Figure 4:
Transverse relaxation rate (R*2) maps computed before ferumoxytol (FMX) and 24 hours after FMX administration in a representative participant with (A, B) liver and (E, F) brain metastases (arrows). R*2-weighted anatomic images on which radiologists drew tumor regions of interest (arrows) are shown for (C, D) liver and (G, H) brain. The color scale, from blue to red, indicates increasing values of R*2 (in seconds−1).
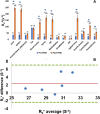
Summary of transverse relaxation rate (R*2) measurements before
and after ferumoxytol (FMX) administration. (A) R*2 values measured
from pre-FMX and 16- to 24-hour post-FMX MRI scans in tumor and normal
tissues (P < .001). (B) Bland-Altman plot of repeatability of
R*2 measurements in reference muscle tissue. CSF = cerebrospinal
fluid, IVC = inferior vena cava.
Figure 5:
Summary of transverse relaxation rate (R*2) measurements before and after ferumoxytol (FMX) administration. (A) R*2 values measured from pre-FMX and 16- to 24-hour post-FMX MRI scans in tumor and normal tissues (P < .001). (B) Bland-Altman plot of repeatability of R*2 measurements in reference muscle tissue. CSF = cerebrospinal fluid, IVC = inferior vena cava.
Discriminator classification performance for response assessment in
abdominal metastases. Violin plots of responding tumor (RT) versus
nonresponding tumor (NRT) classes for (A) mean unnormalized transverse
relaxation rate (R*2) and (B) mean spleen normalized transverse
relaxation rate (rR*2). Nineteen participants’ average spleen
R*2 are shown 24 hours after FMX (C). The error bar represents
R*2 SD within the regions of interest. The area under the receiver
operating characteristic curve (AUC) of rR*2 (D) shows that
discriminator performance increases as the percentile threshold (N)
increases. (E) However, Reproducibilityindex decreases with increasing
percentile. A compromise threshold percentile (Nopt) is indicated by the
dashed gray line, which was selected to provide good AUC for rR*2 and
acceptable Reproducibilityindex.
Figure 6:
Discriminator classification performance for response assessment in abdominal metastases. Violin plots of responding tumor (RT) versus nonresponding tumor (NRT) classes for (A) mean unnormalized transverse relaxation rate (R*2) and (B) mean spleen normalized transverse relaxation rate (rR*2). Nineteen participants’ average spleen R*2 are shown 24 hours after FMX (C). The error bar represents R*2 SD within the regions of interest. The area under the receiver operating characteristic curve (AUC) of rR*2 (D) shows that discriminator performance increases as the percentile threshold (N) increases. (E) However, Reproducibilityindex decreases with increasing percentile. A compromise threshold percentile (Nopt) is indicated by the dashed gray line, which was selected to provide good AUC for rR*2 and acceptable Reproducibilityindex.
Sensitivity of the average of spleen normalized transverse relaxation
rate voxels in the 90th percentile bin in regions of interest
(rR*2,90) discriminator performance to variability in the tumor
regions of interest. Area under the receiver operating characteristic curve
(AUC) for discriminating responding tumor versus nonresponding tumor
thoracoabdominal metastases was calculated after (A) erosion and (B)
dilation of radiologist-drawn regions of interest by 1 to 5 voxels in all
directions in plane.
Figure 7:
Sensitivity of the average of spleen normalized transverse relaxation rate voxels in the 90th percentile bin in regions of interest (rR* 2,90) discriminator performance to variability in the tumor regions of interest. Area under the receiver operating characteristic curve (AUC) for discriminating responding tumor versus nonresponding tumor thoracoabdominal metastases was calculated after (A) erosion and (B) dilation of radiologist-drawn regions of interest by 1 to 5 voxels in all directions in plane.
Performance of discriminators for classification of responding tumor
(RT) versus nonresponding tumor (NRT) brain metastases. (A) Qualitative
illustration of maps generated for three tumors with different responses to
liposomal irinotecan treatment. Images depict a responding tumor (top row),
a tumor that first responded then progressed (middle row), and a tumor that
progressed (bottom row). For each tumor, computed and model-expected
R1-weighted post-FMX MR images, their ratio, and reference transverse
relaxation rate (R*2) maps are shown. Radiologist-drawn tumor
contours are indicated by arrows. (B) The receiver operating characteristic
plots of three putative discriminators of RT (nine lesions) versus NRT (10
lesions). FCIGT1 = fraction of pixels within a tumor volume of interest with
compartmentation index greater than 1, FCIGT1R*2,90 = fraction of
pixels within a tumor volume of interest with compartmentation index greater
than 1 and R*2 in the 90th and higher percentile.
Figure 8:
Performance of discriminators for classification of responding tumor (RT) versus nonresponding tumor (NRT) brain metastases. (A) Qualitative illustration of maps generated for three tumors with different responses to liposomal irinotecan treatment. Images depict a responding tumor (top row), a tumor that first responded then progressed (middle row), and a tumor that progressed (bottom row). For each tumor, computed and model-expected R1-weighted post-FMX MR images, their ratio, and reference transverse relaxation rate (R*2) maps are shown. Radiologist-drawn tumor contours are indicated by arrows. (B) The receiver operating characteristic plots of three putative discriminators of RT (nine lesions) versus NRT (10 lesions). FCIGT1 = fraction of pixels within a tumor volume of interest with compartmentation index greater than 1, FCIGT1R*2,90 = fraction of pixels within a tumor volume of interest with compartmentation index greater than 1 and R*2 in the 90th and higher percentile.

Comment in

References

    1. Sung H , Ferlay J , Siegel RL , et al. . Global cancer statistics 2020: GLOBOCAN estimates of incidence and mortality worldwide for 36 cancers in 185 countries . CA Cancer J Clin 2021. ; 71 ( 3 ): 209 – 249 . - PubMed
    1. Siegel RL , Miller KD , Jemal A . Cancer statistics, 2016 . CA Cancer J Clin 2016. ; 66 ( 1 ): 7 – 30 . - PubMed
    1. Sachdev JC , Munster P , Northfelt DW , et al. . Phase I study of liposomal irinotecan in patients with metastatic breast cancer: findings from the expansion phase . Breast Cancer Res Treat 2021. ; 185 ( 3 ): 759 – 771 . - PMC - PubMed
    1. Shigeoka Y , Itoh K , Igarashi T , et al. . Clinical effect of irinotecan in advanced and metastatic breast cancer patients previously treated with doxorubicin- and docetaxel-containing regimens . Jpn J Clin Oncol 2001. ; 31 ( 8 ): 370 – 374 . - PubMed
    1. Noble CO , Krauze MT , Drummond DC , et al. . Pharmacokinetics, tumor accumulation and antitumor activity of nanoliposomal irinotecan following systemic treatment of intracranial tumors . Nanomedicine (Lond) 2014. ; 9 ( 14 ): 2099 – 2108 . - PubMed

Publication types

Associated data