. 2023 Feb 15;145(6):3419-3426.
doi: 10.1021/jacs.2c10942. Epub 2023 Feb 3.

Pre-Equilibrium Reaction Mechanism as a Strategy to Enhance Rate and Lower Overpotential in Electrocatalysis

Affiliations

Pre-Equilibrium Reaction Mechanism as a Strategy to Enhance Rate and Lower Overpotential in Electrocatalysis

Santanu Pattanayak et al. J Am Chem Soc. .

Abstract

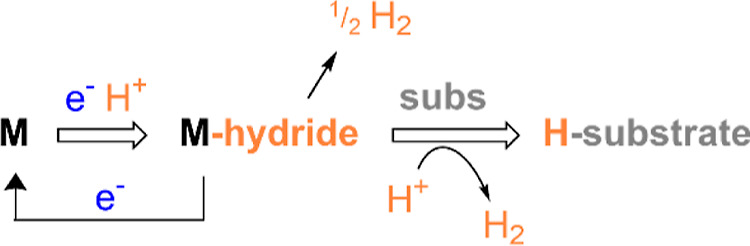
Pre-equilibrium reaction kinetics enable the overall rate of a catalytic reaction to be orders of magnitude faster than the rate-determining step. Herein, we demonstrate how pre-equilibrium kinetics can be applied to breaking the linear free-energy relationship (LFER) for electrocatalysis, leading to rate enhancement 5 orders of magnitude and lowering of overpotential to approximately thermoneutral. This approach is applied to pre-equilibrium formation of a metal-hydride intermediate to achieve fast formate formation rates from CO2 reduction without loss of selectivity (i.e., H2 evolution). Fast pre-equilibrium metal-hydride formation, at 108 M-1 s-1, boosts the CO2 electroreduction to formate rate up to 296 s-1. Compared with molecular catalysts that have similar overpotential, this rate is enhanced by 5 orders of magnitude. As an alternative comparison, overpotential is lowered by ∼50 mV compared to catalysts with a similar rate. The principles elucidated here to obtain pre-equilibrium reaction kinetics via catalyst design are general. Design and development that builds on these principles should be possible in both molecular homogeneous and heterogeneous electrocatalysis.


Conflict of interest statement

The authors declare no competing financial interest.

Figures

Scheme 1
Scheme 1. Three Common Pathways for the Metal–Hydride Reaction
Scheme 2
Scheme 2. Proposed CO2 Reduction Mechanism by 13–
Figure 1
Figure 1
CV of 0.05 mM 12– in 0.1 M Bu4NBF4 MeCN solution (black): (left) in 0.1 M Bu4NBF4 MeCN/H2O (95:5) under 1 atm N2 (red); in 0.1 M Bu4NBF4 MeCN/H2O (95:5) under 1 atm CO2 (blue). (right) with 5.1 mM AnsdH+ under 1 atm N2 (red) and with 0.25 mM AnsdH+ under 1 atm CO2 (blue). Inset: Plot of j versus [H2O] under 1 atm CO2.
Figure 2
Figure 2
CVs of 0.1 mM 12– in 0.1 M Bu4NBF4 MeCN/H2O (99.3:0.7). (left) Under 1 atm N2 at variable scan rates (starting from bright green 0.2, 0.3, 0.4, 0.5, 0.6, 0.7, 0.8, 0.9, 1.2, 1.4, and 1.6 V s–1); CV in black is for 12– without added H2O. (right) Under 1 atm CO2 at variable scan rates (starting from red trace 0.8, 1.2, 1.6, 2, 3, 4, 5, and 6 V s–1). Insets: plots of (EpE1/2) (F/RT) vs ln(υ). The red line is a linear fit with slope fixed at −0.5.
Figure 3
Figure 3
CVs of 12– with (0.05, 0.06, 0.77, 0.09, 0.11-, and 0.12 mM H+, colors) in 0.1 M Bu4NBF4 MeCN under CO2, at 100 mV/s and using the GC electrode. (left) with 5% H2O as the source of H+. Inset: plot of jc versus [12–], at −1.054 V. (right) with 2 mM AnsdH+ as the source of H+. Inset: plot of jc vs [12–], at −0.82 V. Red lines are linear fit to the data, and black CV trace has no added H+.
Figure 4
Figure 4
Forward CV traces of (top left) 0.06 mM 12– in 0.1 M Bu4NBF4 MeCN/H2O (95:5) under 1 atm CO2 at the scan rate = 0.1, 0.2, 0.4, 0.6, 0.9, 1.2, 1.5, 2, 3, 4, 6, 8, 12, 14, 18, 21, and 22 V/s; and (bottom left) 3.5 mM AnsdH+ and 0.2 mM 12– in 0.1 M Bu4NBF4 MeCN under CO2 at various scan rates: 0.3, 0.5. 0.7, 0.8, 1.2, 1.8, 2.5, 3, 4, 5, 5.5, 6, 7, and 8 V/s. (Right) Plots of jmax vs υ at potentials negative to −1.08 V (top) and −0.82 (bottom), after subtraction of the background current value.
Figure 5
Figure 5
Tafel-style plot: Log10[(TOF/s–1) (EF)2] vs overpotential (η) at Ecat/2, for selected molecular CO2 to HCO2 reduction catalysts. Details of calculations and parameters used to construct the plot are shown in Table S2 and references therein. η = ECO2/HCOOEcat/2.
Figure 6
Figure 6
LFER between Log(TOF/s–1) and Ecat/2 for selected molecular electrocatalysts {12–, [Fe4N(CO)12]1–,, [Fe4N(CO)11(PPh3)], [FeN5Cl2]+, [FeP4N2]2+, [Co(imino-bpy)]2+, [(bipy)Co(PyS)2]+, CpCoPCy2NBn2I2, [Ni(qpdt)2], [Pt(depe)2]+,, Ir(POCOP), and [Mn(bipy)(CO)3]/Fe–S}. Data for this plot, see Table S2. The blue shadow highlights correlation of Log10[(TOF/s–1)(FEHCOO)2] with Ecat/2.

References

    1. Nitopi S.; Bertheussen E.; Scott S. B.; Liu X.; Engstfeld A. K.; Horch S.; Seger B.; Stephens I. E. L.; Chan K.; Hahn C.; Nørskov J. K.; Jaramillo T. F.; Chorkendorff I. Progress and Perspectives of Electrochemical CO2 Reduction on Copper in Aqueous Electrolyte. Chem. Rev. 2019, 119, 7610–7672. 10.1021/acs.chemrev.8b00705. - DOI - PubMed
    1. Olah G. A.; Goeppert A.; Prakash G. K. Chemical Recycling of Carbon Dioxide to Methanol and Dimethyl Ether: From Greenhouse Gas to Renewable, Environmentally Carbon Neutral Fuels and Synthetic Hydrocarbons. J. Org. Chem. 2009, 74, 487–498. 10.1021/jo801260f. - DOI - PubMed
    1. Olah G. A.; Goeppert A.; Surya Prakash G. K.. Beyond Oil and Gas: The Methanol Economy, 2nd ed.; Wiley-VCH: Weinheim, Germany, 2009; pp 233–288.
    1. Chen H.; Dong F.; Minteer S. D. The progress and outlook of bioelectrocatalysis for the production of chemicals, fuels and materials. Nat. Catal. 2020, 3, 225–244. 10.1038/s41929-019-0408-2. - DOI
    1. De Luna P.; Hahn C.; Higgins D.; Jaffer S. A.; Jaramillo T. F.; Sargent E. H. What would it take for renewably powered electrosynthesis to displace petrochemical processes?. Science 2019, 364, eaav350610.1126/science.aav3506. - DOI - PubMed