

Association of subpleural ground-glass opacities with respiratory failure and RNAemia in COVID-19
- PMID: 36735038
- PMCID: PMC9896440
- DOI: 10.1007/s00330-023-09427-0
Association of subpleural ground-glass opacities with respiratory failure and RNAemia in COVID-19
Abstract
Objectives: To examine the radiological patterns specifically associated with hypoxemic respiratory failure in patients with coronavirus disease (COVID-19).
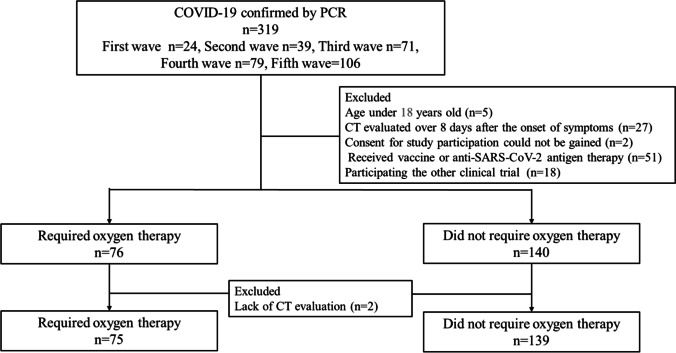
Methods: We enrolled patients with COVID-19 confirmed by qPCR in this prospective observational cohort study. We explored the association of clinical, radiological, and microbiological data with the development of hypoxemic respiratory failure after COVID-19 onset. Semi-quantitative CT scores and dominant CT patterns were retrospectively determined for each patient. The microbiological evaluation included checking the SARS-CoV-2 viral load by qPCR using nasal swab and serum specimens.
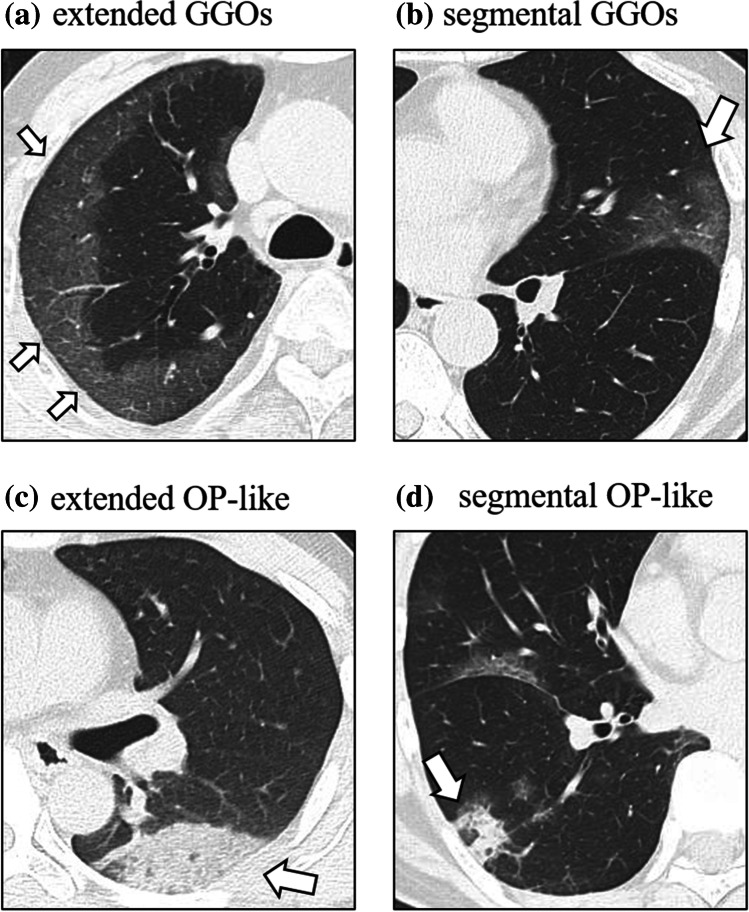
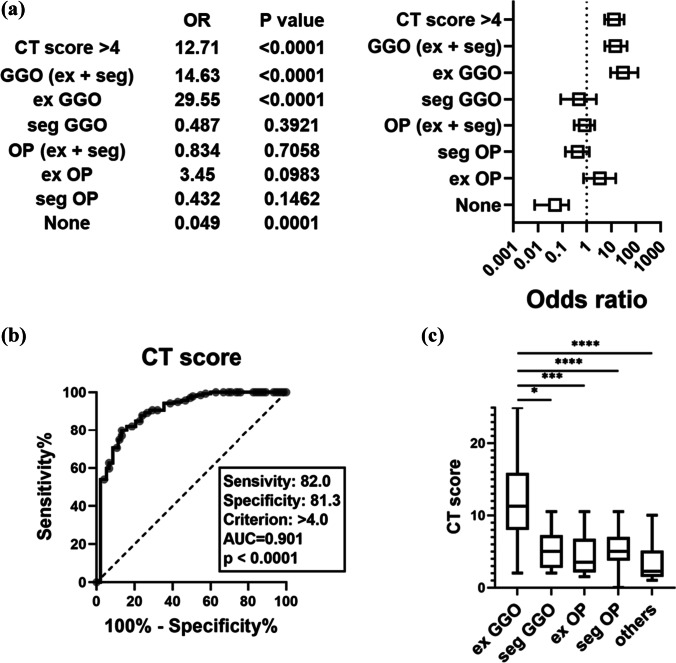
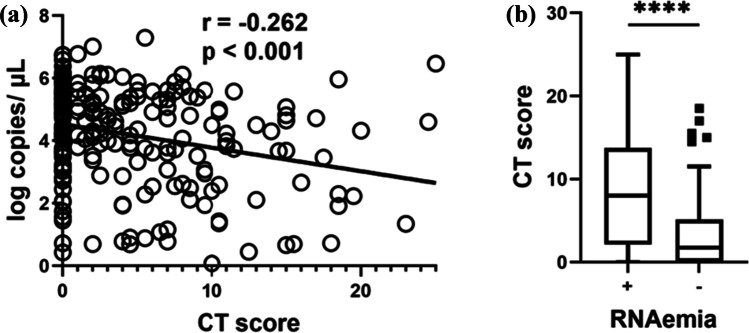
Results: Of the 214 eligible patients, 75 developed hypoxemic respiratory failure and 139 did not. The CT score was significantly higher in patients who developed hypoxemic respiratory failure than in those did not (median [interquartile range]: 9 [6-14] vs 0 [0-3]; p < 0.001). The dominant CT patterns were subpleural ground-glass opacities (GGOs) extending beyond the segmental area (n = 44); defined as "extended GGOs." Multivariable analysis showed that hypoxemic respiratory failure was significantly associated with extended GGOs (odds ratio [OR] 29.6; 95% confidence interval [CI], 9.3-120; p < 0.001), and a CT score > 4 (OR 12.7; 95% CI, 5.3-33; p < 0.001). The incidence of RNAemia was significantly higher in patients with extended GGOs (58.3%) than in those without any pulmonary lesion (14.7%; p < 0.001).
Conclusions: Extended GGOs along the subpleural area were strongly associated with hypoxemia and viremia in patients with COVID-19.
Key points: • Extended ground-glass opacities (GGOs) along the subpleural area and a CT score > 4, in the early phase of COVID-19, were independently associated with the development of hypoxemic respiratory failure. • The absence of pulmonary lesions on CT in the early phase of COVID-19 was associated with a lower risk of developing hypoxemic respiratory failure. • Compared to patients with other CT findings, the extended GGOs and a higher CT score were also associated with a higher incidence of RNAemia.
Keywords: COVID-19; CT; Ground-glass opacity; Respiratory failure; Severe pneumonia.
© 2023. The Author(s), under exclusive licence to European Society of Radiology.
Conflict of interest statement
The authors of this manuscript declare no relationships with any companies whose products or services may be related to the subject matter of the article.
Figures
References
Publication types
MeSH terms
Grants and funding
LinkOut - more resources
Full Text Sources
Medical
Miscellaneous
