. 2023 Feb 3;9(5):eade5987.
doi: 10.1126/sciadv.ade5987. Epub 2023 Feb 3.

Reversal of hyperactive higher-order thalamus attenuates defensiveness in a mouse model of PTSD

Affiliations

Reversal of hyperactive higher-order thalamus attenuates defensiveness in a mouse model of PTSD

Kaiwen Xi et al. Sci Adv. .

Abstract

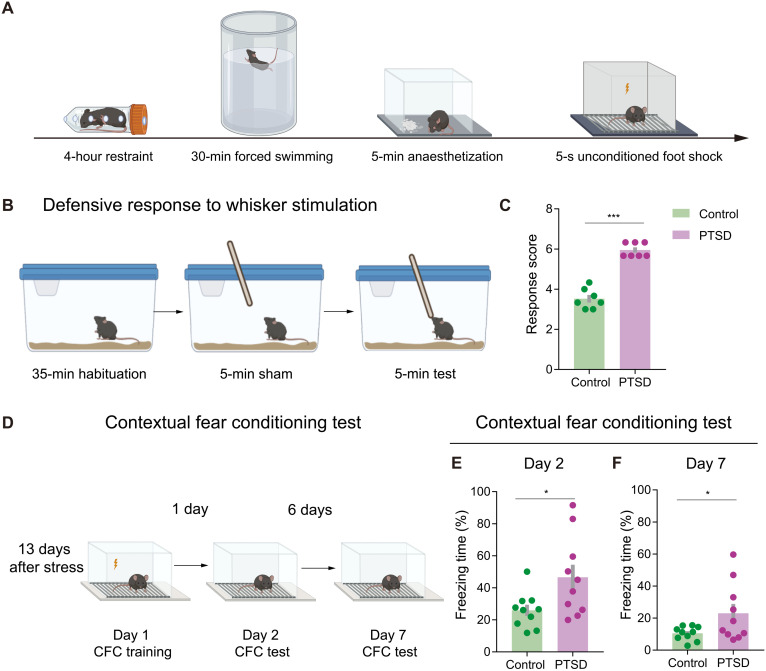
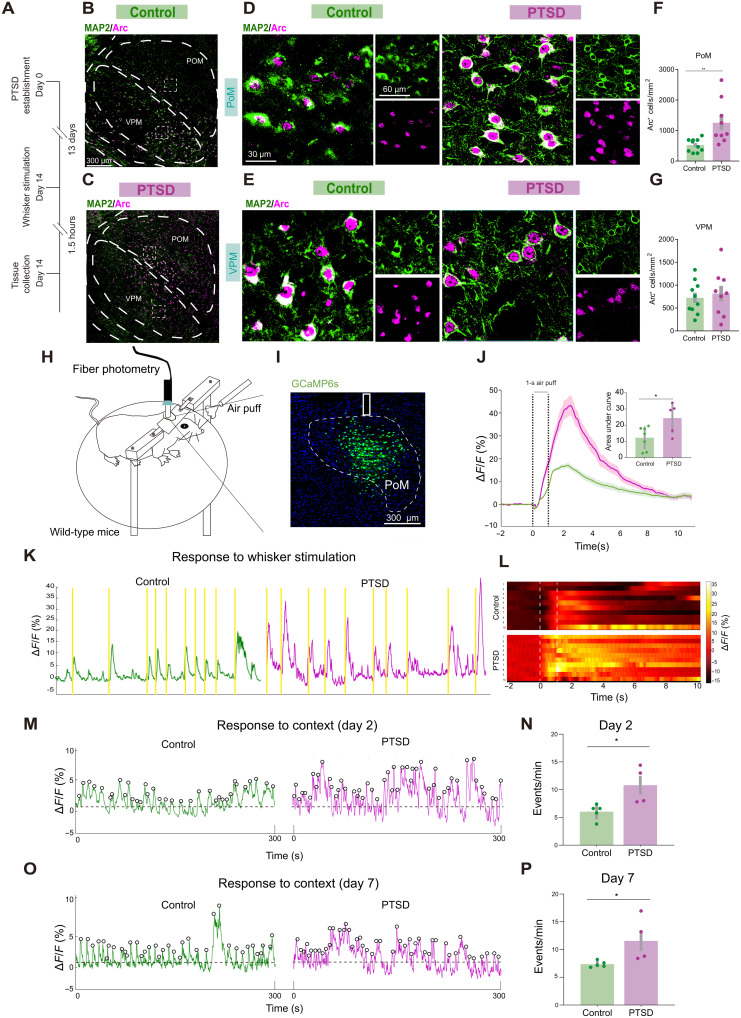
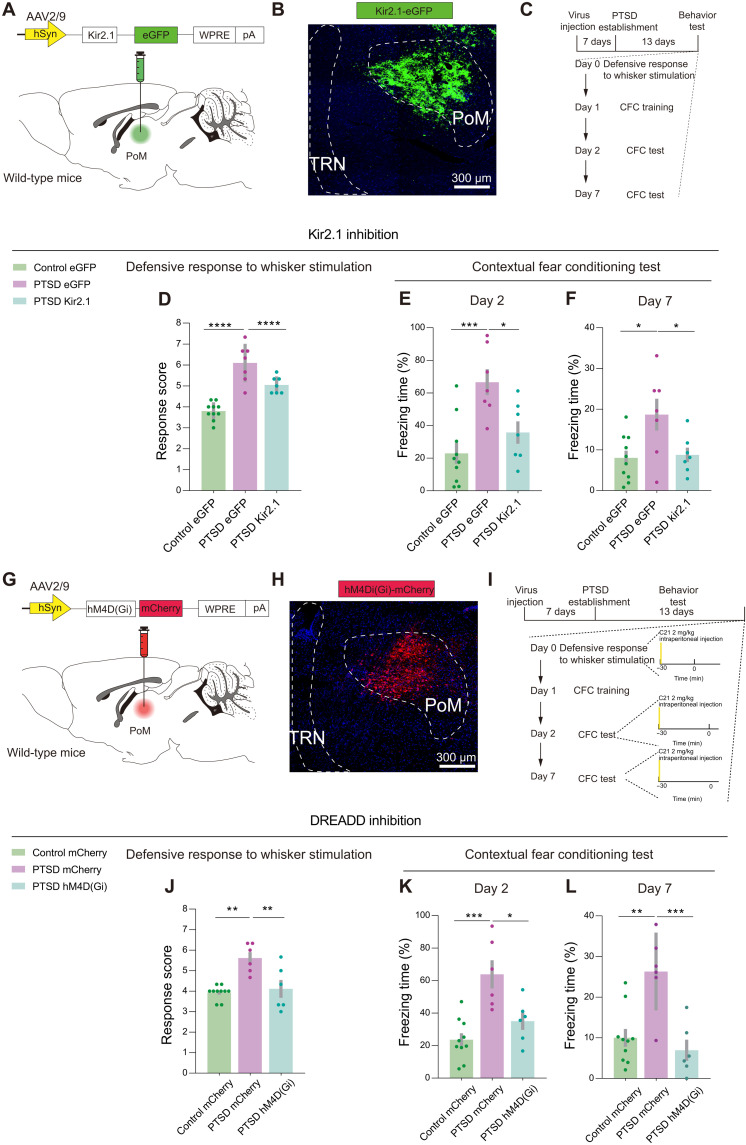
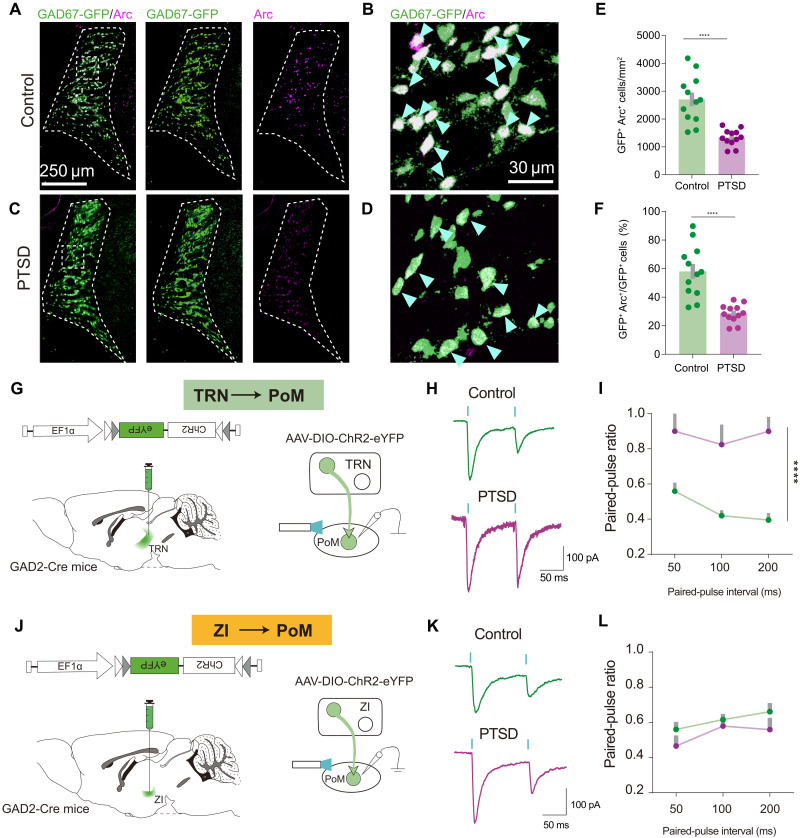
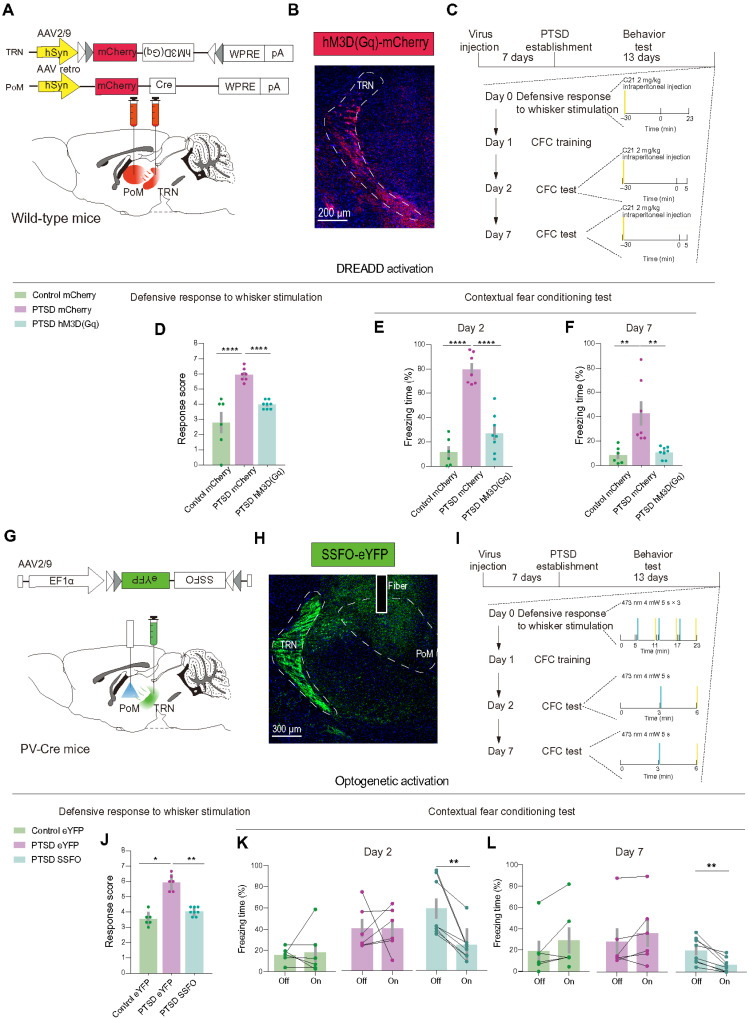
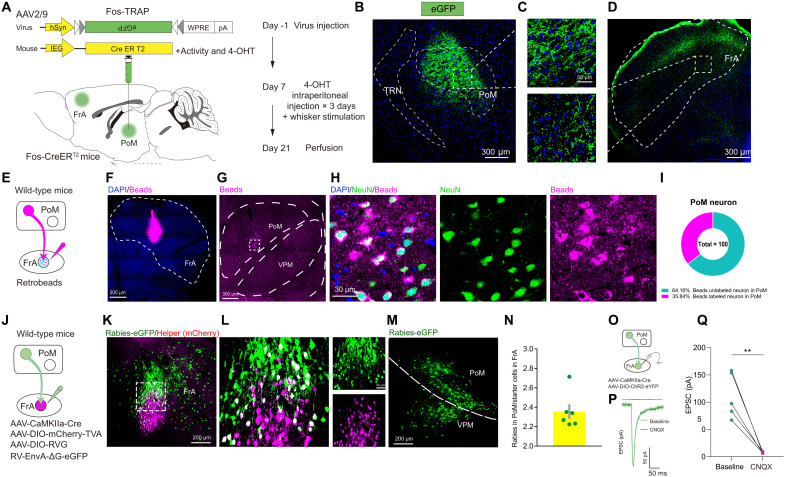
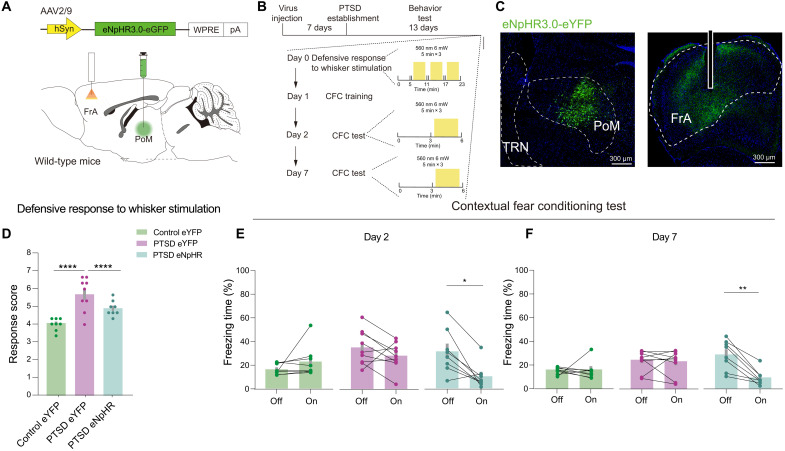
Posttraumatic stress disorder (PTSD) is a highly prevalent and debilitating psychiatric disease often accompanied by severe defensive behaviors, preventing individuals from integrating into society. However, the neural mechanisms of defensiveness in PTSD remain largely unknown. Here, we identified that the higher-order thalamus, the posteromedial complex of the thalamus (PoM), was overactivated in a mouse model of PTSD, and suppressing PoM activity alleviated excessive defensive behaviors. Moreover, we found that diminished thalamic inhibition derived from the thalamic reticular nucleus was the major cause of thalamic hyperactivity in PTSD mice. Overloaded thalamic innervation to the downstream cortical area, frontal association cortex, drove abnormal defensiveness. Overall, our study revealed that the malfunction of the higher-order thalamus mediates defensive behaviors and highlighted the thalamocortical circuit as a potential target for treating PTSD-related overreactivity symptoms.


Figures

Fig. 1.
Fig. 1.. PTSD mice show excessive defensive behavior.
(A) Schematic of PTSD model establishment. (B) Schematic of the test for defensive response to whisker stimulation. (C) Response scores of total defensive behaviors in control and PTSD mice. Total response score was elevated in PTSD mice (n = 7 mice for each group). (D) Schematic of the contextual fear conditioning (CFC) test. (E) Freezing time in the day 2 CFC test. PTSD mice exhibited elevated freezing time in the day 2 CFC test. (F) Freezing time in the day 7 CFC test. PTSD mice exhibited elevated freezing time in the day 7 CFC test (n = 10 mice for each group). Data are presented as means ± SEM. *P < 0.05 and ***P < 0.001. See table S1 for detailed statistical information.
Fig. 2.
Fig. 2.. PTSD mice show elevated neural activity of PoM in defensive behaviors.
(A) Schematic of Arc and MAP2 immunofluorescence staining. (B to E) Representative images showing Arc and MAP2 expression in PoM and VPM under low magnification in control and PTSD groups. (F) Density of cells immunoreactive for Arc in PoM. (G) Density of cells immunoreactive for Arc in the VPM (n = 10 mice for the control group and n = 9 mice for the PTSD group). (H) Schematic of the mouse receiving air puff as whisker stimulation in fiber photometry. (I) Representative images showing GCaMP6 expression and fiber implanted in PoM. (J) Behavior-triggered average of ΔF/F signals. The latency for signal onset and the average air-puff duration plotted in bar graphs. The AUC of ΔF/F average signals in control and PTSD mice (n = 7 mice for the control group and n = 5 mice for the PTSD group). (K) Representative traces of GCaMP6s ΔF/F signal in control and PTSD mice, with colored rectangles indicating when the animal received whisker stimulation. (L) Heatmap depicting Ca2+ responses sorted by trial. (M) Representative traces of the GCaMP6 signals in control and PTSD mice when the animals entered chamber A on day 2 of the CFC test. (N) Frequency of calcium events in chamber A on day 2 of the CFC test (n = 4 mice for the control group and n = 5 mice for the PTSD group). (O) Representative traces of GCaMP6s signals in control and PTSD mice when the animals entered chamber A on day 7 of the CFC test. (P) Frequency of calcium events in chamber A on day 7 of the CFC test. Data are presented as means ± SEM. *P < 0.05 and **P < 0.01. See table S1 for detailed statistical information.
Fig. 3.
Fig. 3.. PoM inhibition improves innate and learned defensive behaviors in PTSD mice.
(A) Schematic of the viral strategy to inhibit PoM neurons through Kir2.1 overexpression. (B) Representative images showing Kir2.1 expression in PoM. (C) Schematic of the behavioral tests. (D) Total defensive response scores in control and PTSD mice (n = 10 mice for the control eGFP group, n = 7 mice for the PTSD eGFP group, and n = 7 mice for the PTSD Kir2.1 group). (E) Freezing time in the day 2 CFC test. (F) Freezing time in the day 7 CFC test (n = 10 mice for the control eGFP group, n = 7 mice for the PTSD eGFP group, and n = 7 mice for the PTSD Kir2.1 group). (G) Schematic of the viral strategy to chemogenetically inhibit PoM neurons. (H) Representative images showing hM4D(Gi) expression in PoM in an experimental mouse. (I) Schematic of behavioral tests. (J) Total defensive response scores in control and PTSD mice [n = 10 mice for the control mCherry group, n = 6 mice for the PTSD mCherry group, and n = 6 mice for the PTSD hM4D(Gi) mice group]. (K) Freezing time in the day 2 CFC test. (L) Freezing time in the day 7 CFC test [n = 10 mice for the control mCherry group, n = 6 mice for the PTSD mCherry group, and n = 6 mice for the PTSD hM4D(Gi) mice group]. *P < 0.05, **P < 0.01, ***P < 0.001, and ****P < 0.0001. Data are presented as means ± SEM. See table S1 for detailed statistical information.
Fig. 4.
Fig. 4.. Decreased TRN inhibitory inputs to PoM in PTSD mice.
(A and B) Representative images showing GAD67-GFP and Arc expression in TRN in control mice. (C and D) Representative images showing GAD67-GFP and Arc expression in TRN in PTSD mice. (E) Density of GAD67-GFP+ cells immunoreactive for Arc in TRN. (F) Percentage of GAD67-GFP+Arc+ cells in GAD67-GFP+ cells in TRN (n = 12 mice for each group). (G) Schematic of the viral strategy for PPR recordings in PoM with photoactivation of TRN terminals. (H) Representative images showing the PPR of IPSC in PoM neurons with photoactivation of TRN terminals in control and PTSD mice. (I) Average PPR of IPSC in control and PTSD mice (n = 7 neurons for the control group and n = 8 neurons for the PTSD group). (J) Schematic of the viral strategy for PPR recording in PoM with photoactivation of ZI terminals. (K) Representative images showing PPR of IPSC in PoM neurons with photoactivation of ZI terminals. (L) Average PPR of IPSC in PoM neurons (n = 8 neurons for the control group and n = 7 neurons for the PTSD group). ****P < 0.0001. Data are presented as means ± SEM. See table S1 for detailed statistical information.
Fig. 5.
Fig. 5.. Activation of TRN-PoM circuit improves excessive innate and learned defensive behaviors in PTSD mice.
(A) Schematic of the viral strategy to chemogenetically activate TRN neurons projecting to PoM. (B) Representative images showing hM3D(Gq) expression in TRN. (C) Schematic of behavioral tests. (D) Total defensive response scores in control and PTSD mice [n = 6 mice for the control mCherry group, n = 7 mice for the PTSD mCherry group, and n = 8 mice for the PTSD hM3D(Gq) group]. (E) Freezing time in the day 2 CFC test. (F) Freezing time in the day 7 CFC test [n = 6 mice for the control mCherry group, n = 7 mice for the PTSD mCherry group, and n = 8 mice for the PTSD hM3D(Gq) group]. (G) Schematic of the viral strategy to optically activate axons of TRN projecting to PoM. (H) Representative images showing SSFO expression in TRN and optical fiber site in PoM. (I) Schematic of behavioral tests. (J) Response scores of total defensive responses in control and PTSD mice (n = 6 mice for the control eYFP group, n = 6 mice for the PTSD eYFP group, and n = 8 mice for the PTSD SSFO group). (K) Freezing time in the day 2 CFC test. (L) Freezing time in the day 7 CFC test (n = 6 mice for the control eYFP group, n = 6 mice for the PTSD eYFP group, and n = 8 mice for the PTSD SSFO group). Data are presented as means ± SEM. *P < 0.05, **P < 0.01, and ****P < 0.0001. See table S1 for detailed statistical information.
Fig. 6.
Fig. 6.. PoM-FrA projection is monosynaptic and functionally related to defensive behaviors.
(A) Schematic of Fos-TRAP strategy for anterograde tracing of the downstream regions of PoM. (B to D) Representative images showing eGFP expression in PoM and FrA. (E) Schematic of retrobead injection for retrograde tracing of upstream regions of FrA. (F) Representative images showing retrobead expression in FrA under low magnification. (G) Representative images showing retrobead expression in PoM under low magnification. (H) Representative images showing retrobead expression and NeuN staining in PoM. (I) Pie chart of the percentage of retrobead+ neurons in PoM neurons. (J) Schematic of rabies virus injection for retrograde tracing of the upstream regions of FrA. (K) Representative images showing starter cell expression in FrA under low magnification (left). (L) Representative images showing starter cell expression in FrA under high magnification. (M) Representative images showing rabies expression in PoM under low magnification. (N) Histogram for numbers of rabies-labeled PoM neurons normalized to the number of starter cells. (O) Schematic of viral strategy for EPSC recording in FrA evoked by PoM. (P) Representative images showing EPSC of neurons in FrA evoked by PoM inputs with (purple) and without (green) CNQX infusion. (Q) EPSC of neurons in FrA evoked by PoM inputs with (purple) and without (green) CNQX infusion (n = 5 neurons from three mice). Data are presented as means ± SEM. **P < 0.01. See table S1 for detailed statistical information.
Fig. 7.
Fig. 7.. Inhibition of PoM-FrA circuit rescues excessive innate and learned defensive behaviors in PTSD mice.
(A) Schematic of the viral strategy to optically inhibit axons of PoM projecting to FrA. (B) Schematic of behavioral tests. (C) Representative images showing eNpHR expression in PoM and the optical fiber site in FrA in an experimental mouse. (D) Total defensive response scores in control and PTSD mice (n = 8 mice for the control eYFP group, n = 9 mice for the PTSD eYFP group, and n = 8 mice for the PTSD eNpHR group). (E) Freezing time in the day 2 CFC test. (F) Freezing time in the day 7 CFC test (n = 8 mice for the control eYFP group, n = 9 mice for the PTSD eYFP group, and n = 8 mice for the PTSD eNpHR group). Data are presented as means ± SEM. *P < 0.05, **P < 0.01, and ****P < 0.0001. See table S1 for detailed statistical information.

References

    1. Fenster R. J., Lebois L. A. M., Ressler K. J., Suh J., Brain circuit dysfunction in post-traumatic stress disorder: From mouse to man. Nat. Rev. Neurosci. 19, 535–551 (2018). - PMC - PubMed
    1. Purgato M., Gastaldon C., Papola D., van Ommeren M., Barbui C., Tol W. A., Psychological therapies for the treatment of mental disorders in low- and middle-income countries affected by humanitarian crises. Cochrane Database Syst. Rev. 7, CD011849 (2018). - PMC - PubMed
    1. Cathomas F., Holt L. M., Parise E. M., Liu J., Murrough J. W., Casaccia P., Nestler E. J., Russo S. J., Beyond the neuron: Role of non-neuronal cells in stress disorders. Neuron 110, 1116–1138 (2022). - PMC - PubMed
    1. Fratzl A., Koltchev A. M., Vissers N., Tan Y. L., Marques-Smith A., Stempel A. V., Branco T., Hofer S. B., Flexible inhibitory control of visually evoked defensive behavior by the ventral lateral geniculate nucleus. Neuron 109, 3810–3822.e9 (2021). - PMC - PubMed
    1. Tseng Y. T., Zhao B., Chen S., Ye J., Liu J., Liang L., Ding H., Schaefke B., Yang Q., Wang L., Wang F., Wang L., The subthalamic corticotropin-releasing hormone neurons mediate adaptive REM-sleep responses to threat. Neuron 110, 1223–1239.e8 (2022). - PubMed