. 2023 Feb 3;9(5):eade9341.
doi: 10.1126/sciadv.ade9341. Epub 2023 Feb 3.

Long-term insect censuses capture progressive loss of ecosystem functioning in East Asia

Affiliations

Long-term insect censuses capture progressive loss of ecosystem functioning in East Asia

Yan Zhou et al. Sci Adv. .

Abstract

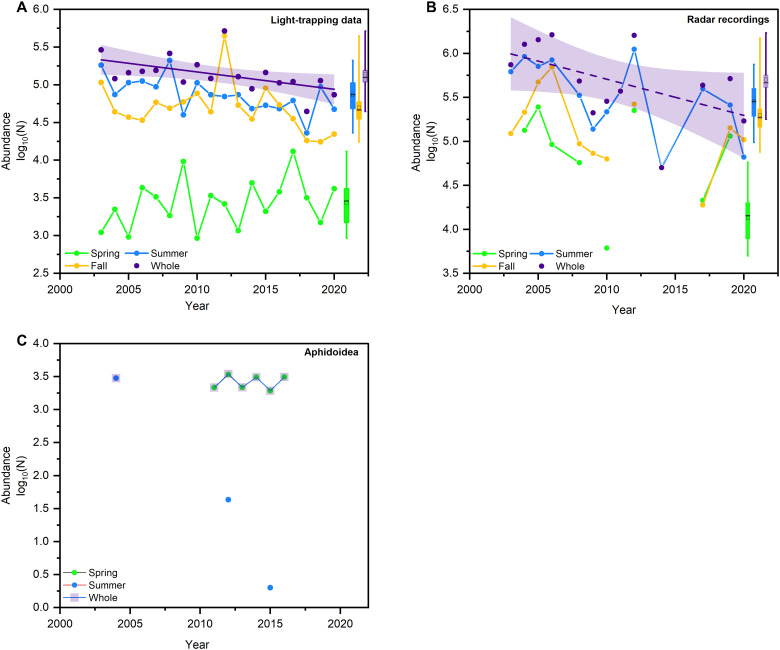
Insects provide critical ecosystem services such as biological pest control, in which natural enemies (NE) regulate the populations of crop-feeding herbivores (H). While H-NE dynamics are routinely studied at small spatiotemporal scales, multiyear assessments over entire agrolandscapes are rare. Here, we draw on 18-year radar and searchlight trapping datasets (2003-2020) from eastern Asia to (i) assess temporal population trends of 98 airborne insect species and (ii) characterize the associated H-NE interplay. Although NE consistently constrain interseasonal H population growth, their summer abundance declined by 19.3% over time and prominent agricultural pests abandoned their equilibrium state. Within food webs composed of 124 bitrophic couplets, NE abundance annually fell by 0.7% and network connectance dropped markedly. Our research unveils how a progressive decline in insect numbers debilitates H trophic regulation and ecosystem stability at a macroscale, carrying implications for food security and (agro)ecological resilience during times of global environmental change.


Figures

Fig. 1.
Fig. 1.. Seasonal and annual abundance of migratory insects on BH over 2003–2020.
(A) Temporal dynamics of all insect species that were sampled through high-altitude searchlight trapping (F1,16 = 6.08, P = 0.03). (B) Temporal dynamics of insect species recorded with radar (F1,11 = 4.09, P = 0.07). (C) Seasonal abundance data for Aphidoidea over a restricted time period, i.e., covering 7 of 18 years. Temporal dynamics are plotted for overall insect abundance during spring (green), summer (blue), fall (orange), and year-long (purple dots). Radar data are lacking for 2007, spring of 2003, 2009, 2011, 2014, and 2020, and fall of 2011 and 2014. In either panel, abundance values are log-transformed and boxplots represent interquartile ranges with medians (solid horizontal line) and means (small square). Whiskers indicate the 5th and 95th percentiles of the range. Solid and dashed lines with shaded 95% confidence interval (CI) indicate significant or marginally significant trends (0.05 < P < 0.1) in total annual abundance over time based on linear regression models, respectively.
Fig. 2.
Fig. 2.. Year-by-year variation in abundance and community-level indices for H and NE guilds over 2003–2020.
H (red dots) and NE (blue dots) comprise a respective total of 80 and 18 species, and their abundance was assessed using high-altitude searchlight trapping on BH (table S1). Panels show temporal trends for different variables: (A) Annual abundance of H and NE and the associated NE/H abundance ratio (yellow dots). A sine curve {y = 0.2 + 0.12*sin [2.55 (x − 83.33)], R2 = 0.293} was fitted to the abundance ratio. (B) H and NE dominance. (C) H and NE diversity. (D) Summer abundance of H and NE and the associated NE/H abundance ratio. Solid or dashed regression lines with 95% CI (shaded area) either indicate significant (P < 0.05) or marginally significant (0.05 < P < 0.1) trends based on linear regression models that include abundance [H: F1,16 = 3.61, P = 0.08; NE: F1,16 = 15.66, P = 0.001; (A); Hsu: F1,16 = 3.61, P = 0.08; NEsu: F1,16 = 15.66, P = 0.001; (D)], dominance [NE: F1,16 = 6.75, P = 0.02; (B)], and diversity [F1,16 = 24.28, P < 0.001; (C)] as the dependent variable, respectively.
Fig. 3.
Fig. 3.. Interannual and seasonal variation in (absolute or relative) H and NE abundance.
(A) Annual oscillation and variation in seasonal abundance ratio in spring and fall of H and NE abundance {Hfn/Hsn: y = 1.38 + 0.34sin [2.77 (x + 16.71)], R2 = 0.27; NEfn/NEsn: y = 0.93 + 0.55sin [2.31 (x + 115.73)], R2 = 0.66}. (B) Interannual oscillation and variation in seasonal abundance ratio in spring and fall of NE/H abundance ratio {Hsn/Hfn-1: y = 0.03 + 0.03sin [2.26 (x − 44.87)], R2 = 0.46; y = 0.11 + 0.12sin [2.49 (x + 71.65)], R2 = 0.41}. (C) Interannual and intra-annual variation in the NE/H ratio between spring and fall.
Fig. 4.
Fig. 4.. NE-mediated mitigation of H population buildup across seasons or within a given year.
Patterns are drawn using H and NE abundance records, as obtained through light trapping on BH during 2003–2020. (A) NE abundance in a previous season (NEn-1) negatively relates to the ensuing H population growth in season n (GRHn; F1,33 = 26.51, P < 0.001). Season here only refers to spring and fall. (B) NE abundance during fall of year n − 1 (NEfn-1) positively relates to spring-time H population growth in the subsequent year (GRHsn; F1,15 = 5, P = 0.041). (C) Relationship between spring NE abundance (NEsn) and fall-time H population growth in the same year (GRHfn). Linear regression patterns are highly significant (P < 0.05), with the shaded area showing a 95% CI.
Fig. 5.
Fig. 5.. Temporal trends in the CV for monthly H abundance over 2003–2020 for a subset of species.
CV values are annually calculated using monthly abundance records over June to September; long-term CV trends reflect potential gains or losses in ecological equilibrium. Patterns are shown for 10 (of 80) H species that either exhibit statistically significant increases or decreases in CV values over time (P < 0.1). The relative magnitude of CV for either group of species is shown by pink or blue bars on the left, while the relative abundance of each species is shown in the colored bars on the right. Species with significant changes in abundance and dominance are equally indicated.
Fig. 6.
Fig. 6.. Multiyear trends in (relative) species abundance and network connectance for a food web composed of 124 bitrophic H × NE couplets.
(A) Quantitative food web composed of migratory H (red circles) and NE (blue circles), captured with searchlight traps over 2003–2020 on BH. Digits within a given circle indicate species identity (table S1). Circle size reflects the relative annual abundance of each species. Interspecies links comprise positive (magenta), negative (black), or both positive and negative (purple lines) NE × H correlations. (B) Temporal shifts in annual abundance of the H and NE species that constitute the 124 couplets and the associated NE/H abundance ratio (H: F1,16 = 4.29, P = 0.06; NE: F1,16 = 13.39, P = 0.002). (C) Temporal decline in connectance of the assembled NE × H food web (F1,16 = 9.81, P = 0.006). Solid and dashed lines with a shaded 95% CI indicate statistically significant (P < 0.05) or marginally significant (0.05 < P < 0.1) trends based on linear regression models.

References

    1. S. Seibold, M. M. Gossner, N. K. Simons, N. Blüthgen, J. Müller, D. Ambarlı, C. Ammer, J. Bauhus, M. Fischer, J. C. Habel, K. E. Linsenmair, T. Nauss, C. Penone, D. Prati, P. Schall, E.-D. Schulze, J. Vogt, S. Wöllauer, W. W. Weisser, Arthropod decline in grasslands and forests is associated with landscape-level drivers. Nature 574, 671–674 (2019). - PubMed
    1. J. Uhler, S. Redlich, J. Zhang, T. Hothorn, C. Tobisch, J. Ewald, S. Thorn, S. Seibold, O. Mitesser, J. Morinière, V. Bozicevic, C. S. Benjamin, J. Englmeier, U. Fricke, C. Ganuza, M. Haensel, R. Riebl, S. Rojas-Botero, T. Rummler, L. Uphus, S. Schmidt, I. Steffan-Dewenter, J. Müller, Relationship of insect biomass and richness with land use along a climate gradient. Nat. Commun. 12, 5946 (2021). - PMC - PubMed
    1. P. Soroye, T. Newbold, J. Kerr, Climate change contributes to widespread declines among bumble bees across continents. Science 367, 685–688 (2020). - PubMed
    1. F. Sánchez-Bayo, K. A. G. Wyckhuys, Worldwide decline of the entomofauna: A review of its drivers. Biol. Conserv. 232, 8–27 (2019).
    1. D. L. Wagner, E. M. Grames, M. L. Forister, M. R. Berenbaum, D. Stopak, Insect decline in the Anthropocene: Death by a thousand cuts. Proc. Natl. Acad. Sci. U.S.A. 118, e2023989118 (2021). - PMC - PubMed