

Methane Emissions from Municipal Wastewater Collection and Treatment Systems
- PMID: 36735881
- PMCID: PMC10041530
- DOI: 10.1021/acs.est.2c04388
Methane Emissions from Municipal Wastewater Collection and Treatment Systems
Abstract
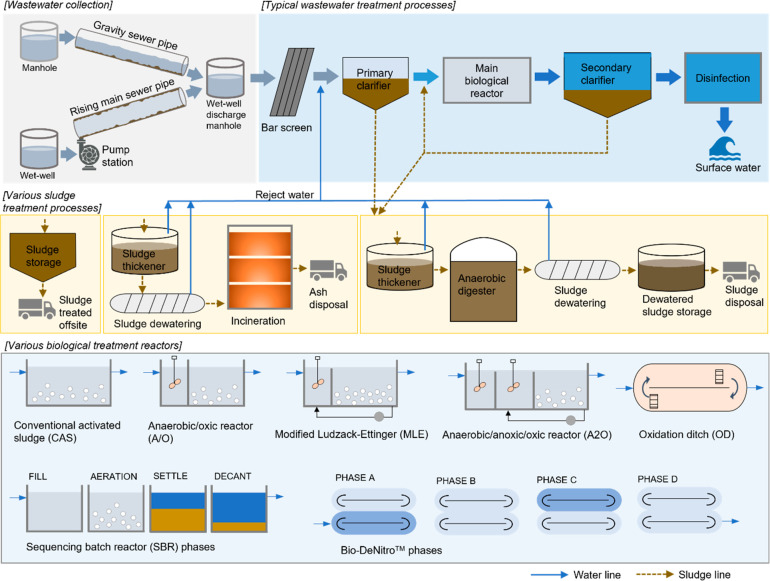
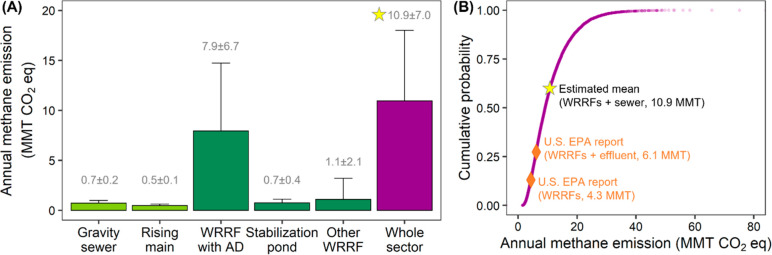
Municipal wastewater collection and treatment systems are critical infrastructures, and they are also identified as major sources of anthropogenic CH4 emissions that contribute to climate change. The actual CH4 emissions at the plant- or regional level vary greatly due to site-specific conditions as well as high seasonal and diurnal variations. Here, we conducted the first quantitative analysis of CH4 emissions from different types of sewers and water resource recovery facilities (WRRFs). We examined variations in CH4 emissions associated with methods applied in different monitoring campaigns, and identified main CH4 sources and sinks to facilitate carbon emission reduction efforts in the wastewater sector. We found plant-wide CH4 emissions vary by orders of magnitude, from 0.01 to 110 g CH4/m3 with high emissions associated with plants equipped with anaerobic digestion or stabilization ponds. Rising mains show higher dissolved CH4 concentrations than gravity sewers when transporting similar raw sewage under similar environmental conditions, but the latter dominates most collection systems around the world. Using the updated data sets, we estimated annual CH4 emission from the U.S. centralized, municipal wastewater treatment to be approximately 10.9 ± 7.0 MMT CO2-eq/year, which is about twice as the IPCC (2019) Tier 2 estimates (4.3-6.1 MMT CO2-eq/year). Given CH4 emission control will play a crucial role in achieving net zero carbon goals by the midcentury, more studies are needed to profile and mitigate CH4 emissions from the wastewater sector.
Keywords: IPCC; Literature text mining; Methane; Mitigation strategies; Monitoring campaigns; Monte Carlo analysis; Wastewater treatment.
Conflict of interest statement
The authors declare no competing financial interest.
Figures


References
-
- Forster P.; Storelvmo T.; Armour K.; Collins W.; Dufresne J.-L.; Frame D.; Lunt D.; Mauritsen T.; Palmer M.; Watanabe M.. Earth’s energy budget, climate feedbacks, and climate sensitivity. In Climate Change 2021: The Physical Science Basis. Contribution of Working Group I to the Sixth Assessment Report of the Intergovernmental Panel on Climate Change. https://www.ipcc.ch/report/ar6/wg1/downloads/report/IPCC_AR6_WGI_Chapter..., 2021.
-
- Stocker T.Climate Change 2013: The Physical Science Basis: Working Group I Contribution to the Fifth Assessment Report of the Intergovernmental Panel on Climate Change; Cambridge University Press, 2014.
-
- Winiwarter W.; Klimont Z. The role of N-gases (N2O, NOx, NH3) in cost-effective strategies to reduce greenhouse gas emissions and air pollution in Europe. Current opinion in environmental sustainability 2011, 3 (5), 438–445. 10.1016/j.cosust.2011.08.003. - DOI
-
- Zhu Z.; Lu L.; Yao X.; Zhang W.; Liu W.. AR6 Climate Change 2021: The Physical Science Basis; Intergovernmental Panel on Climate Change, 2021.
Publication types
MeSH terms
Substances
LinkOut - more resources
Full Text Sources
