. 2023 May 18;141(20):2520-2536.
doi: 10.1182/blood.2022017584.

Arginine metabolism regulates human erythroid differentiation through hypusination of eIF5A

Affiliations

Arginine metabolism regulates human erythroid differentiation through hypusination of eIF5A

Pedro Gonzalez-Menendez et al. Blood. .

Abstract

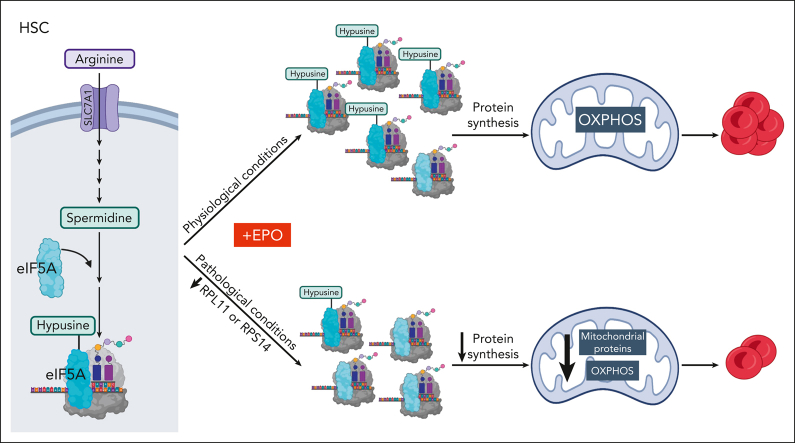
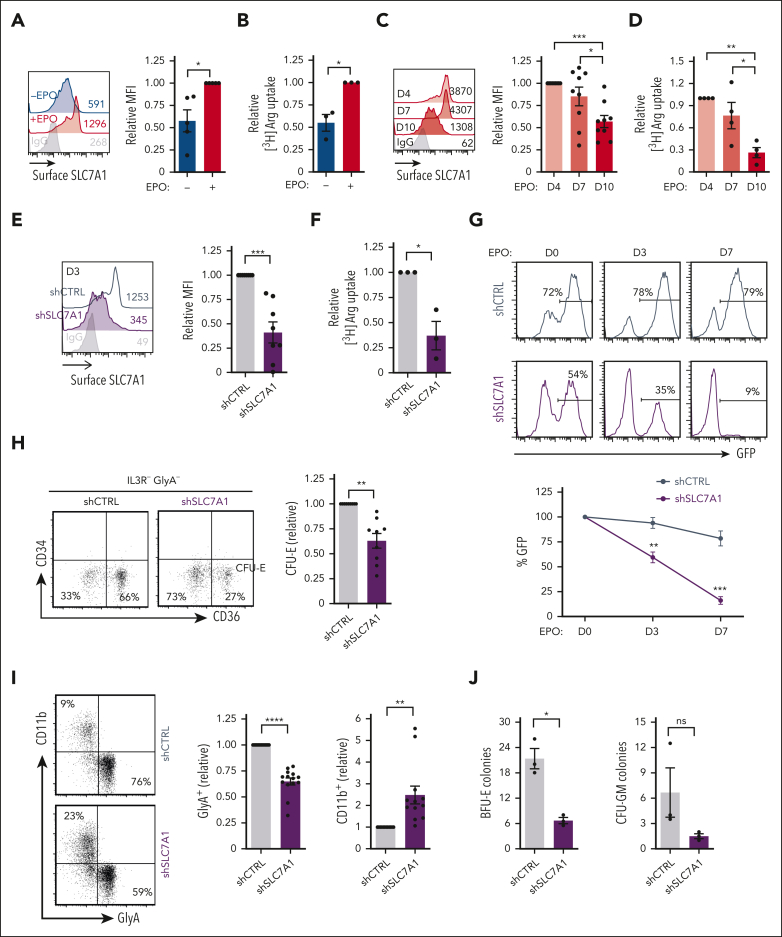
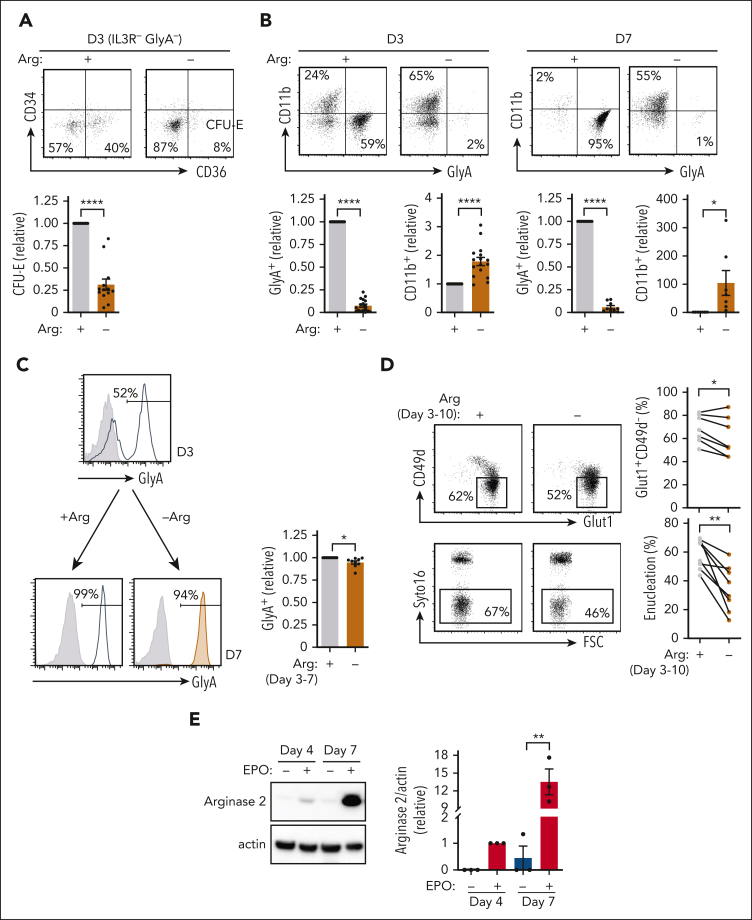
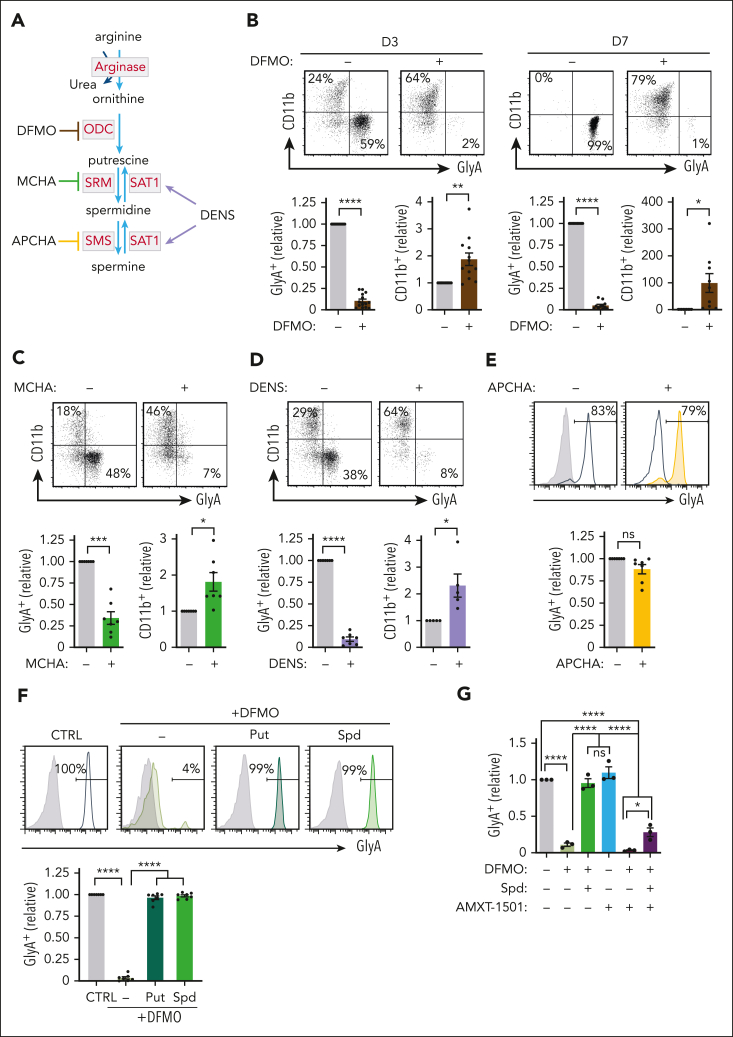
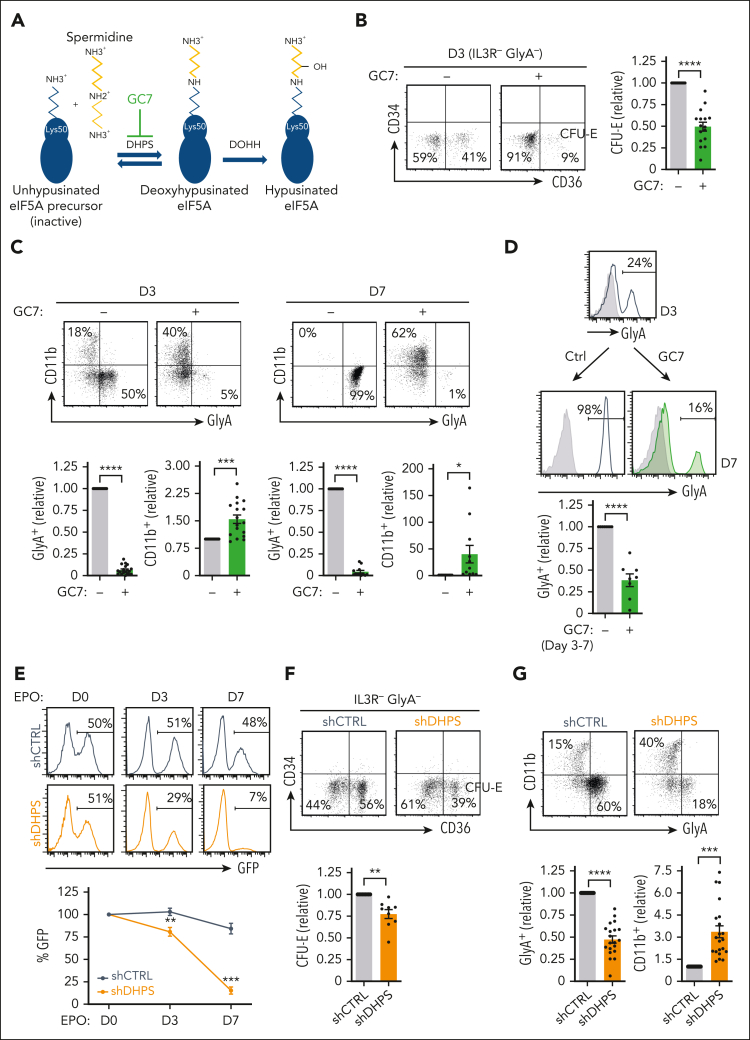
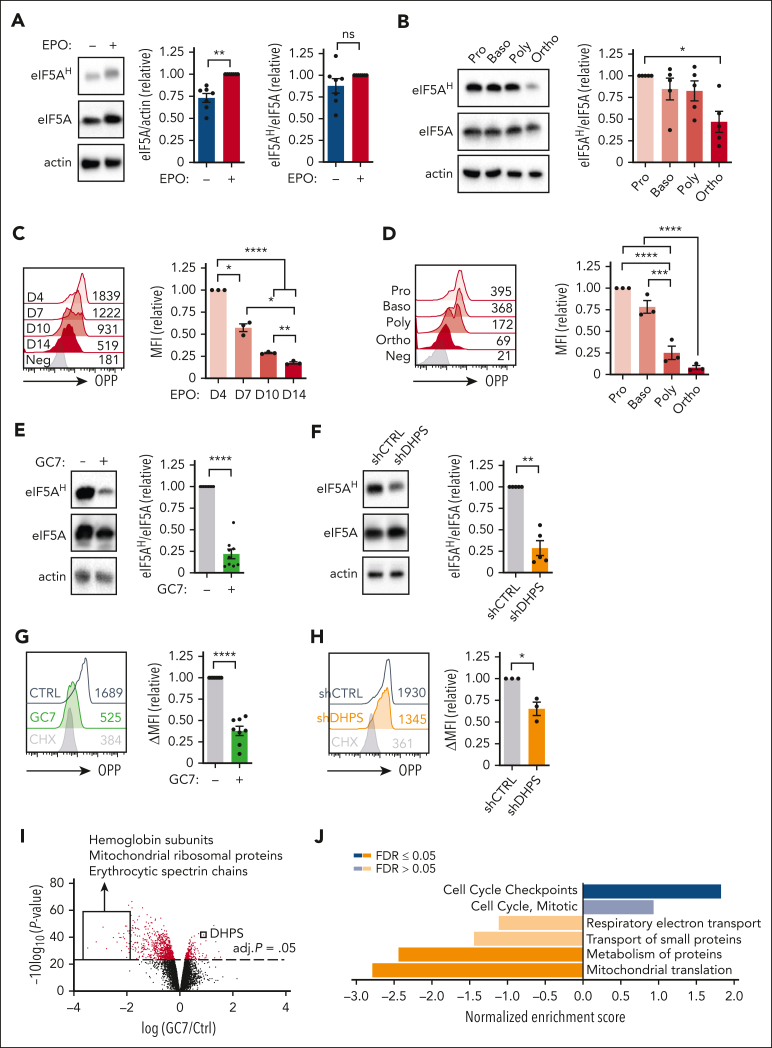
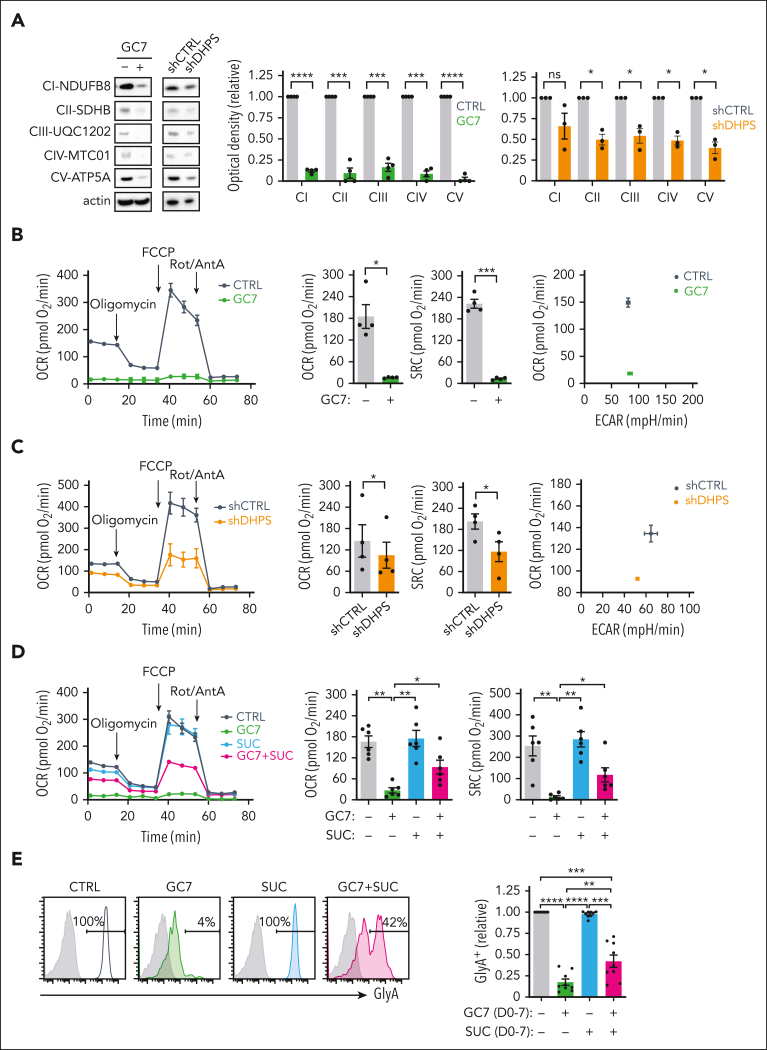
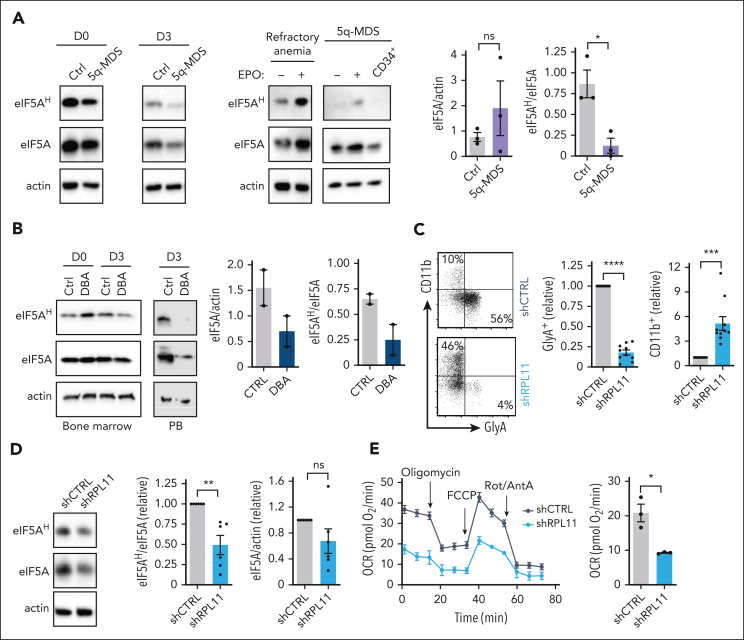
Metabolic programs contribute to hematopoietic stem and progenitor cell (HSPC) fate, but it is not known whether the metabolic regulation of protein synthesis controls HSPC differentiation. Here, we show that SLC7A1/cationic amino acid transporter 1-dependent arginine uptake and its catabolism to the polyamine spermidine control human erythroid specification of HSPCs via the activation of the eukaryotic translation initiation factor 5A (eIF5A). eIF5A activity is dependent on its hypusination, a posttranslational modification resulting from the conjugation of the aminobutyl moiety of spermidine to lysine. Notably, attenuation of hypusine synthesis in erythroid progenitors, by the inhibition of deoxyhypusine synthase, abrogates erythropoiesis but not myeloid cell differentiation. Proteomic profiling reveals mitochondrial translation to be a critical target of hypusinated eIF5A, and accordingly, progenitors with decreased hypusine activity exhibit diminished oxidative phosphorylation. This affected pathway is critical for eIF5A-regulated erythropoiesis, as interventions augmenting mitochondrial function partially rescue human erythropoiesis under conditions of attenuated hypusination. Levels of mitochondrial ribosomal proteins (RPs) were especially sensitive to the loss of hypusine, and we find that the ineffective erythropoiesis linked to haploinsufficiency of RPS14 in chromosome 5q deletions in myelodysplastic syndrome is associated with a diminished pool of hypusinated eIF5A. Moreover, patients with RPL11-haploinsufficient Diamond-Blackfan anemia as well as CD34+ progenitors with downregulated RPL11 exhibit a markedly decreased hypusination in erythroid progenitors, concomitant with a loss of mitochondrial metabolism. Thus, eIF5A-dependent protein synthesis regulates human erythropoiesis, and our data reveal a novel role for RPs in controlling eIF5A hypusination in HSPCs, synchronizing mitochondrial metabolism with erythroid differentiation.


Conflict of interest statement

Conflict-of-interest disclosure: M.S., S.K., and N.T. are inventors on patents describing the use of RBD ligands but N.T. no longer has any patent rights. M.S. is the cofounder of METAFORA-biosystems, a start-up company that focuses on metabolite transporters under physiological and pathological conditions. The remaining authors declare no competing financial interests.

Figures

None
Graphical abstract
Figure 1.
Figure 1.
HSC specification to the erythroid lineage is dependent on the expression and function of the SLC7A1 arginine transporter. (A) Cell-surface expression of SLC7A1 was evaluatedafter rEPO-induced erythroid differentiation of CD34+ progenitors (day 4) and representative histograms in the absence or presence of rEPO are presented (left). Relative MFIs of SCL7A1 in rEPO-induced progenitors are compared with levels detected in the absence of EPO (right, n = 5 independent experiments). (B) Arginine uptake in the absence or presence of rEPO (day 4) was monitored using L-[2,3,4-3H)] arginine monohydrochloride (2 μCi) for 10 minutes at room temperature. Uptake in the presence of EPO was arbitrarily set at 1 (means of triplicates in 3 independent experiments). (C) Surface SLC7A1 levels were monitored at days 4, 7, and 10 of rEPO-mediated differentiation and representative histograms are shown (left). Mean fluorescent intensities (MFIs) of SLC7A1 staining relative to day 4 were quantified (right, n = 9). (D) Arginine uptake was evaluated at days 4, 7, and 10 of erythroid differentiation; arginine uptake at day 4 was arbitrarily set at 1 (means of triplicates in 4 independent experiments). (E) CD34+ progenitors were transduced 3 days with GFP-tagged shCTRL and shSLC7A1 lentiviral vectors and representative histograms of cell-surface SLC7A1 expression on GFP+ cells (left) as well as quantification of SLC7A1 expression relative to control-transduced cells is shown (right, n = 8 independent experiments). (F) Arginine uptake was monitored in fluorescence-activated cell sorter–sorted progenitors transduced with shCTRL and shSLC7A1 vectors at day 4 and uptake levels relative to the shCTRL condition are presented (n = 3). (G) The evolution of shCTRL- and shSLC7A1-transduced progenitors was monitored as a function of GFP expression at days 0, 3, and 7 of rEPO-induced differentiation and representative histograms are shown (left). Quantification of the percentages of GFP+ cells relative to day 0 is presented (right, n = 6). (H) Differentiation of rEPO-induced shCTRL- and shSLC7A1-transduced progenitors was monitored as a function of CD34 and CD36 expression on IL3RGlyA cells; CFU-E are defined by an IL3RGlyACD34CD36+ phenotype (left, day 3). Quantification of CFU-E relative to shCTRL-transduced progenitors is presented (right, n = 9). (I) The differentiation of progenitors to an erythroid (GlyA) vs myeloid (CD11b) fate was evaluated by flow cytometry at day 3 of rEPO-induced differentiation. Representative plots (left) and quantifications (right) are presented. Surface expression of GlyA and CD11b was monitored on shCTRL- and shSLC7A1-transduced progenitors at day 3 of differentiation (left). Quantification of erythroid (n = 14) and myeloid (n = 12) differentiation is shown in independent experiments (right). (J) CD34+CD38 progenitors transduced with shCTRL and shCAT1 vectors were evaluated for CFU potential using the StemMACS HSC-CFU Assay Kit and the numbers of burst-forming unit erythroid (BFU-E) and CFU–granulocyte-macrophage (GM) colonies generated at day 14 are presented for 3 independent experiments. ∗P < .05; ∗∗P < .01; ∗∗∗P < .001; ∗∗∗∗P < .0001. IgG, immunoglobulin G; ns, not significant.
Figure 2.
Figure 2.
Arginine is required for erythroid lineage commitment and its absence attenuates terminal differentiation. (A) The fate of progenitors treated with rEPO in the presence (+) or absence (−) or exogenous arginine was monitored as a function of CD34 and CD36 expression in IL3RGlyA cells at day 3 of differentiation. Representative dot plots are presented (top) and IL3RGlyACD34CD36+ (CFU-E) cells were quantified relative to differentiation in the presence of arginine (bottom, n = 13). (B) Relative levels of erythroid and myeloid differentiation were monitored by GlyA and CD11b staining, respectively. Representative dot plots are shown at days 3 and 7 of differentiation in the presence or absence of arginine (top). Quantification of GlyA+ (n = 17, day 3; n = 9, day 7) and CD11b+ cells (n = 16, day 3; n = 7, day 7) are presented (bottom). (C) The impact of arginine at later stages of erythroid differentiation was evaluated by depleting arginine after 3 days of EPO-induced erythroid differentiation. GlyA was evaluated at day 3 (top histogram; gray histograms, isotype control; solid line histograms, specific staining) and then 4 days later (day 7) in the presence or absence of arginine (bottom histograms, solid line, and orange histograms, respectively). Quantification of the percentages of GlyA+ cells was compared after EPO-induced differentiation from day 3 to 7 in the presence or absence of arginine (right, n = 9). (D) The impact of arginine deprivation between days 3 and 10 of rEPO-induced differentiation was monitored as a function of CD49d/GLUT1 profiles (top) and enucleation (bottom, Syto16 staining). Representative plots are shown (left) and quantification in 8 individual donors is presented (right). (E) Arginase 2 expression was evaluated by immunoblot at days 4 and 7 of differentiation in the absence or presence of EPO. Actin levels are shown as a loading control (left). Quantification of arginase 2 expression relative to actin was evaluated in the different conditions (right, n = 3). ∗P < .05; ∗∗P < .01; ∗∗∗∗P < .0001.
Figure 3.
Figure 3.
Erythroid differentiation is dependent on arginine-derived polyamine biosynthesis but not transport. (A) Schematic representation of polyamine biosynthesis from arginine with key enzymes indicated in red (ornithine carboxylase [ODC], spermidine synthase [SRM], spermine synthase [SMS], spermidine/spermine-N1-acetyl transferase [SAT1]). Steps that are inhibited by α-difluoromethylornithine (DMFO), trans-4-methyl cyclohexylamine (MCHA), and N-(3-amino-propyl)cyclohexylamine (APCHA) are presented. N1, N11-diethylnorspermine (DENS), an activator of polyamine catabolism, is also indicated. (B) The impact of DFMO (1 mM) on rEPO-induced differentiation of CD34+ progenitors was monitored by evaluating CD11b/GlyA profiles at days 3 and 7. Representative dot plots (top) and quantification of relative levels at days 3 (n = 14 for GlyA, n = 12 for CD11b) and 7 (n = 11 for GlyA, n = 9 for CD11b) of differentiation are shown (bottom). (C) The impact of MCHA (100 μM) was evaluated as a function of CD11b/GlyA profiles (top) at day 3 and quantifications are shown (bottom, n = 7). (D) The impact of DENS (10 μM) on EPO-induced differentiation was evaluated at day 3 and representative plots (top) and quantifications (n = 7 for GlyA and n = 5 for CD11b) are shown (bottom). (E) APCHA (100 μM) was added to rEPO-induced progenitors and representative profiles (top) and quantifications (bottom, n = 7) are shown. (F) DFMO-treated progenitors were differentiated with rEPO in the presence or absence of putrescine (Put; 100 μM) or spermidine (Spd; 100 μM), and GlyA was evaluated at day 7 (top, green histograms). Quantification from 7 independent experiments is presented (bottom). (G) Erythroid differentiation was induced in the presence or absence of DFMO, spermidine, and AMXT-1501 (2.5 μM), an inhibitor of polyamine transport. Quantification of GlyA expression relative to control conditions is presented (bottom, n = 3). ∗P < .05; ∗∗P < .001; ∗∗∗P < .001; ∗∗∗∗P < .0001.
Figure 4.
Figure 4.
DHPS is required for erythroid commitment and differentiation. (A) Schematic representation of the 2-step process resulting in eIF5AH. In the first step, DHPS catalyzes the addition of an aminobutyl moiety from the spermidine to the lysine 50 on eIF5A, generating an eIF5A intermediate. Subsequently, DOHH catalyzes the hydroxylation of the spermidine modification, generating an active hypusinated eIF5A. GC7 can inhibit the first step of this reaction. (B) The effect of GC7 on early erythropoiesis was evaluated by monitoring CD34/CD36 profiles of EPO-stimulated CD34+ progenitors in the absence (−) or presence (+) of GC7 (5 μM). Representative dot plots of IL3RGlyA cells are shown and the percentages of IL3RGlyACD34CD36+ (CFU-E) are indicated (left). Quantification of CFU-E in 16 independent experiments are presented (right). (C) Representative dot plots of GlyA/CD11b profiles are presented at days 3 and 7 of EPO-induced differentiation in the absence or presence of GC7 (top). Quantification of GlyA+ and CD11b+ cells relative to levels in the absence of GC7 (indicated as “1”) are presented (bottom, n = 11-19). (D) CD34+ progenitors were differentiated in rEPO for 3 days and differentiation continued until day 7 in the absence or presence of GC7 (between days 3 and 7). Representative histograms showing GlyA expression at days 3 and 7 (with isotype controls, gray histograms) are presented and quantification of GlyA+ cells are presented relative to levels in the absence of GC7 (designated as “1,” bottom, n = 8). (E) CD34+ progenitors were transduced with shCTRL or shDHPS lentiviral vectors, harboring the enhanced GFP transgene and rEPO added 72 hours later. GFP expression was monitored at this time point (designated day 0), as well at days 3 and 7 of differentiation and representative are shown (top). Quantification of the evolution of GFP expression relative to day 0 (designated as “100%”) is presented for 5 donors (bottom). (F) shCTRL and shDHPS transduced progenitors were differentiated in the presence of rEPO for 3 days and representative CD34/CD36 profiles of IL3RGlyA cells are presented (top). Quantification of IL3RGlyACD34CD36+ cells in shDHPS-transduced cells relative to shCTRL-transduced cells are shown (bottom, n = 9). (G) shCTRL and shDHPS transduced progenitors were differentiated for 3 days and representative GlyA/CD11 dot plots are shown (top). Quantification of GlyA+ and CD11b+ cells are presented relative to shCTRL conditions (bottom; n = 20 for GlyA, n = 21 for CD11b). ∗P < .05; ∗∗P < .01; ∗∗∗P < .001; ∗∗∗∗P < .0001.
Figure 5.
Figure 5.
DHPS-mediated hypusination of eIF5A regulates protein synthesis in early erythroid progenitors. (A) Hypusination was evaluated in progenitors differentiated in the presence or absence of EPO (day 4) and representative immunoblots of eIF5AH, eIF5A, and actin are shown (left). Quantification of eIF5A/actin (middle) and eIF5AH/eIF5A (right) ratios are presented relative to levels in the presence of EPO (n = 7). (B) Proerythroblasts (Pro), basophilic (Baso), polychromatic (Poly), and orthochromatic (Ortho) erythroblasts were sorted based on their GLUT1/CD49d prolife at day 7 of differentiation and hypusination was monitored by immunoblotting (left). eIF5AH was quantified relative to total eIF5A levels (right, n = 5). (C) Protein synthesis was monitored at the indicated day of erythroid differentiation by O-propargyl-puromycin (OPP) labeling and representative histograms and MFI are indicated (left). Quantification of MFIs relative to day 4 are presented for 3 donors (right). (D) Protein synthesis was monitored by OPP labeling in erythroblast subsets 24 hours after sorting (as in panel B, left). Quantification of MFIs relative to proerythroblasts are presented for 3 donors (right). (E) Hypusination was evaluated after 3 days of EPO stimulation in the absence (−) or presence (+) of GC7 (5 μM) and representative immunoblots of eIF5AH, eIF5A, and actin are shown (left). Quantification relative to levels in the absence of GC7 are presented (right, n = 9). (F) Hypusination in shCTRL- and shDHPS-transduced progenitorsevaluated at day 3 of differentiation after sorting based on GFP expression and representative immunoblots are shown (left). Quantification of the relative levels of eIF5AH/eIF5A is presented (right, n = 5). (G) CD34+ progenitors were differentiated in the presence of EPO, together with GC7 (5 μM) or cycloheximide (CHX; 1 μM). Protein synthesis was evaluated at day 1 of differentiation and a representative histogram is shown (left). Quantification of protein synthesis relative to control conditions is presented (right, n = 8). (H) shCTRL- and shDHPS-transduced progenitors were sorted 72 hours after transduction based on GFP expression. Protein synthesis evaluated 24 hours after the addition of EPO and a representative histogram (left) as well as quantification (right, n = 3) are presented. (I) CD34+ progenitors were differentiated with EPO in the absence or presence of GC7 (5 μM) for 2 days and protein expression was evaluated by mass spectrometry–based quantitative proteomics. A volcano plot shows differences in protein expression (log2 fold change) induced by GC7, and the identity of specified downregulated and upregulated proteins are noted. Statistical significance of relative protein expression is computed via 2-sample moderated t test, and proteins with an false discovery rate (FDR) adjusted (adj.) P < .05 are colored in red. (J) Overrepresentation analyses of gene ontology for nonredundant biological processes were evaluated for significantly upregulated and downregulated and enrichment scores are indicated. ∗P < .05; ∗∗P < .01; ∗∗∗P < .001; ∗∗∗∗P < .0001.
Figure 6.
Figure 6.
Hypusination-induced OXPHOS is required for the erythroid commitment of hematopoietic progenitors. (A) Mitochondrial complexes (CI to CV) were monitored on progenitors treated with GC7 or after transduction with shCTRL or shDHPS vectors (day 3) using the OXPHOS monoclonal antibody cocktail (left). Quantification relative to control conditions was determined (n = 4 for GC7 and n = 3 for shRNA-transduced progenitors; middle and right, respectively). (B) Oxygen consumption rate (OCR), a measure of OXPHOS, was monitored on day 1 of erythroid differentiation in the absence or presence of GC7 (5 μM) on a Seahorse XFe96 analyzer after sequential injection of oligomycin, carbonyl cyanide 4-(trifluoromethoxy) phenylhydrazone (FCCP), and Rotenone/Antimycin A (Rot/AntA; arrows, left). Mean basal OCR and SRC levels ± standard error of the mean (SEM) are presented (middle, n = 4). Representative energy plots of basal OCR and extracellular acidification rate (ECAR), a measure of glycolysis, are presented (right). (C) OCR was monitored on fluorescence-activated cell sorter–sorted shCTRL- and shDHPS-transduced progenitors at day 1 of differentiation (left). Basal OCR and SRC levels ± SEM were evaluated in 4 independent experiments (middle) and a representative OCR/ECAR energy plot is presented (right). (D) OCR was monitored on CD34+ progenitors differentiated with EPO for 24 hours in the absence or presence of GC7 (5 μM) and succinate (SUC, 5 mM) and representative graphs are shown (left). Basal OCR and SRC levels in 6 independent experiments are presented (right). (E) Erythroid differentiation in progenitors treated with EPO in the absence or presence of GC7 or succinate was evaluated at day 7 as a function of GlyA expression and representative histograms are shown (left). Quantification of the percentages of GlyA+ cells relative to control conditions are presented (right, n = 9). ∗P < .05; ∗∗P < .01; ∗∗∗P < .001, ∗∗∗∗P < .0001.
Figure 7.
Figure 7.
Haploinsufficiency in RP genes is coupled to an attenuated hypusination in erythroid progenitors. (A) CD34+ BM progenitors from a healthy control and a patient with del(5q)-MDS were expanded ex vivo. Immunoblots showing hypusinated and total eIF5A levels at days 0 and 3 of EPO-induced differentiation are presented (left). Hypusination in CD34+ BM progenitors from a second patient with del(5q)-MDS was compared with progenitors from a patient with refractory anemia, after a 3-day differentiation in the absence (−) or presence (+) of EPO and blots are shown (middle). Quantification of the ratios of eIF5A/actin and eIF5AH/eIF5A for progenitors from 3 patients with del(5q)-MDS are presented (n = 3). (B) CD34+ BM progenitors from a RPL11-haploinsufficient patient with DBA [c.27_28 delGA (p.N10FS)] were evaluated for hypusinated and total eIF5A levels at isolation (day 0) and then expanded for 4 days followed by 3 days of EPO-induced differentiation (left). The change in eIF5AH/eIF5A after differentiation is shown. Peripheral blood (PB) CD34+ progenitors from a second RPL11-haploinsufficient patient (c.164dup; p.Tyr55Ter) were evaluated after ex vivo differentiation with a 4-day expansion followed by a 3 day EPO stimulation. eIF5AH immunoblots are shown (middle). Quantifications of the ratios of eIF5A/actin and eIF5AH/eIF5A for the 2 patients with DBA and 2 controls at day 3 of EPO-induced differentiation are presented (right). (C) The differentiation of shCTRL- and shRPL11-transduced progenitors to a vs n erythroid (GlyA+) vs myeloid (CD11b+) fate was evaluated by flow cytometry at day 3 of rEPO-induced differentiation. Representative CD11b/GlyA dot plots (left) and quantifications are presented (right, n = 10). (D) Hypusination was evaluated in human progenitors transduced with shCTRL and shRPL11 vectors at day 3 of differentiation. Representative immunoblots of eIF5AH and total eIF5A levels in shCTRL- and shRPL11-transduced progenitors (left) and quantifications ± SEM of eIF5AH/eIF5A and eIF5A/actin are presented (right, n = 6). Levels in control cells are set at “1.” (E) OCRs of shCTRL- and shRPL11-transduced progenitors were evaluated at day 1 of differentiation and representative data (left, n = 3-6 technical replicates) and mean basal OCR levels ± SEM are presented (right, n = 3 independent experiments). ∗P < .05; ∗∗P < .01; ∗∗∗P < .001; ∗∗∗P < .0001.

References

    1. Hu J, Liu J, Xue F, et al. Isolation and functional characterization of human erythroblasts at distinct stages: implications for understanding of normal and disordered erythropoiesis in vivo. Blood. 2013;121(16):3246–3253. - PMC - PubMed
    1. An X, Schulz VP, Li J, et al. Global transcriptome analyses of human and murine terminal erythroid differentiation. Blood. 2014;123(22):3466–3477. - PMC - PubMed
    1. Li J, Hale J, Bhagia P, et al. Isolation and transcriptome analyses of human erythroid progenitors: BFU-E and CFU-E. Blood. 2014;124(24):3636–3645. - PMC - PubMed
    1. Ludwig LS, Lareau CA, Bao EL, et al. Transcriptional states and chromatin accessibility underlying human erythropoiesis. Cell Rep. 2019;27(11):3228–3240.e7. - PMC - PubMed
    1. Schulz VP, Yan H, Lezon-Geyda K, et al. A unique epigenomic landscape defines human erythropoiesis. Cell Rep. 2019;28(11):2996–3009.e7. - PMC - PubMed

Publication types