. 2023 Apr 1;34(4):554-571.
doi: 10.1681/ASN.0000000000000057. Epub 2023 Jan 13.

Lineage Tracing and Single-Nucleus Multiomics Reveal Novel Features of Adaptive and Maladaptive Repair after Acute Kidney Injury

Affiliations

Lineage Tracing and Single-Nucleus Multiomics Reveal Novel Features of Adaptive and Maladaptive Repair after Acute Kidney Injury

Louisa M S Gerhardt et al. J Am Soc Nephrol. .

Abstract

Significance statement: Understanding the mechanisms underlying adaptive and maladaptive renal repair after AKI and their long-term consequences is critical to kidney health. The authors used lineage tracing of cycling cells and single-nucleus multiomics (profiling transcriptome and chromatin accessibility) after AKI. They demonstrated that AKI triggers a cell-cycle response in most epithelial and nonepithelial kidney cell types. They also showed that maladaptive proinflammatory proximal tubule cells (PTCs) persist until 6 months post-AKI, although they decreased in abundance over time, in part, through cell death. Single-nucleus multiomics of lineage-traced cells revealed regulatory features of adaptive and maladaptive repair. These included activation of cell state-specific transcription factors and cis-regulatory elements, and effects in PTCs even after adaptive repair, weeks after the injury event.

Background: AKI triggers a proliferative response as part of an intrinsic cellular repair program, which can lead to adaptive renal repair, restoring kidney structure and function, or maladaptive repair with the persistence of injured proximal tubule cells (PTCs) and an altered kidney structure. However, the cellular and molecular understanding of these repair programs is limited.

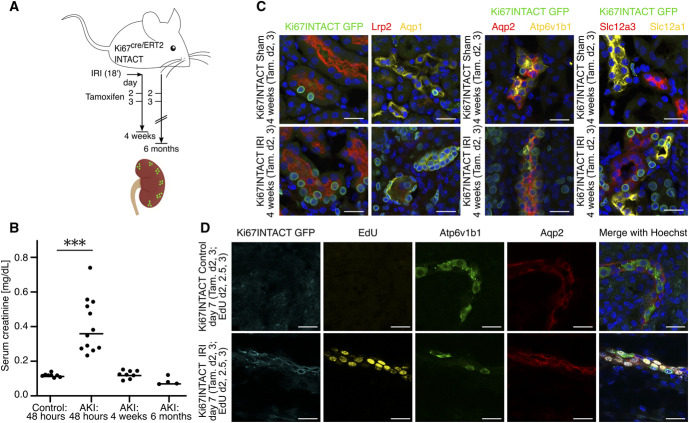
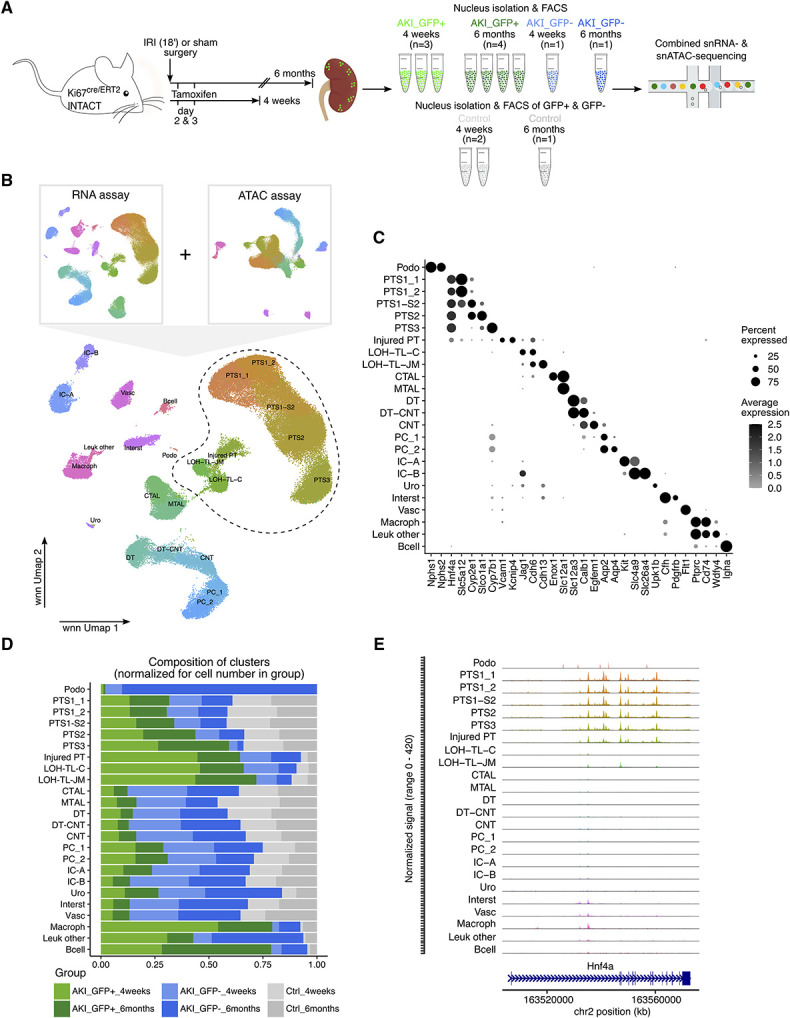
Methods: To examine chromatin and transcriptional responses in the same cell upon ischemia-reperfusion injury (IRI), we combined genetic fate mapping of cycling ( Ki67+ ) cells labeled early after IRI with single-nucleus multiomics-profiling transcriptome and chromatin accessibility in the same nucleus-and generated a dataset of 83,315 nuclei.

Results: AKI triggered a broad cell cycle response preceded by cell type-specific and global transcriptional changes in the nephron, the collecting and vascular systems, and stromal and immune cell types. We observed a heterogeneous population of maladaptive PTCs throughout proximal tubule segments 6 months post-AKI, with a marked loss of maladaptive cells from 4 weeks to 6 months. Gene expression and chromatin accessibility profiling in the same nuclei highlighted differences between adaptive and maladaptive PTCs in the activity of cis-regulatory elements and transcription factors, accompanied by corresponding changes in target gene expression. Adaptive repair was associated with reduced expression of genes encoding transmembrane transport proteins essential to kidney function.

Conclusions: Analysis of genome organization and gene activity with single-cell resolution using lineage tracing and single-nucleus multiomics offers new insight into the regulation of renal injury repair. Weeks to months after mild-to-moderate IRI, maladaptive PTCs persist with an aberrant epigenetic landscape, and PTCs exhibit an altered transcriptional profile even following adaptive repair.


Conflict of interest statement

B.D.H. is a consultant Chinook Therapeutics, Janssen Research & Development, LLC, and Pfizer; holds equity in Chinook Therapeutics; and has had grant support from Chinook Therapeutics, Janssen and Pfizer (within last 3 years). B. Humphreys also reports Patents or Royalties: Evotec, AG; Advisory or Leadership Role: American Journal of Physiology Renal Physiology Editorial Board, ASCI President-elect, Board of Scientific Advisors, Chinook Therapeutics SAB, JCI Insight Editorial Board, Kidney International Editorial Board, Regenerative Medicine Crossing Borders SAB, RegMed XB, and Seminars in Nephrology Editorial Board.

A.P.M. receives consulting fees or stock options for his scientific advisory role for eGENESIS, IVIVA Medical, Novartis, and TRESTLE BioTherapeutics. A. McMahon also reports research funding: Amgen; Patents or Royalties: Hedgehog technology licenses through Harvard to Curis, received license/royalty payments from Curis; Advisory or Leadership Role: California Institute of Technology—Jacobs Institute, Max Planck Institute Molecular Genetics Berlin; and Other Interests or Relationships: Committee of University Kidney Research Organization (UKRO). J. van Gestel reports Employer: EMBL. All remaining authors have nothing to disclose.

Figures

None
Graphical abstract
Figure 1
Figure 1
Ki67-lineage tracing shows broad cell-cycle response to AKI. (A) Experimental setup. (B) Serum creatinine values in control mice, 48 hours, 4 weeks, and 6 months after ischemia-reperfusion injury (IRI). The horizontal line indicates the median. ***P<0.001. (C) Colocalization of GFP reporter with markers for proximal tubule (Lrp2), thin descending limb of the loop of Henle (Aqp1), thick ascending limb of the loop of Henle (Slc12a1), distal tubule (Slc12a3), principal cells (Aqp2), and intercalated cells (Atp6v1b1). (D) Mice were injected with Tamoxifen at day 2 and 3 post-IRI to induce nuclear membrane GFP-labeling of Ki67-expressing cells. 5-ethynyl-2′-deoxyuridine (EdU) was injected at day 2, 2.5 and 3 post-IRI to label cells in the S-phase of the cell cycle. Kidneys were collected at day 7 post-IRI for immunofluorescence staining. Colocalization of GFP reporter with EdU, Atp6v1b1, and Aqp2. All scale bars 25 μm. Tam., Tamoxifen.
Figure 2
Figure 2
The immediate-early transcriptional response to AKI is partially conserved across kidney cell types. (A) Heatmaps showing downregulated (left) and upregulated (right) genes identified in a per cell type comparison of 12 hours post-IRI kidney snRNA-seq with control data from Kirita et al. Genes are arranged in the gene modules identified by weighted correlation network analysis. Control samples are shown in the upper, 12 hours post-IRI samples in the lower part of the heatmap. The black box highlights the module containing genes upregulated across most kidney cell types (Module 4). CNT, connecting tubule; CTAL, tick ascending limb of the loop of Henle in cortex; DCT, distal convoluted tubule; DTL-ATL, thin descending and thin ascending limb of the loop of Henle; EC, endothelial cells; Fib, fibroblasts; ICA, type A intercalated cell; ICB, type B intercalated cell; Mø, macrophages; MTAL, tick ascending limb of the loop of Henle in medulla; NewPT1, Havcr1+ injured proximal tubule cluster; NewPT2, Vcam1+ injured proximal tubule cluster; PC, principal cell; PEC, parietal epithelial cells; Per, pericytes; Pod, podocytes; PTS1, proximal tubule segment 1; PTS2, proximal tubule segment 2; PTS3, proximal tubule segment 3; Uro, urothelium. (B) Bar plot showing gene set enrichment analysis of cell type–specific marker genes among genes that are downregulated at 12 hours post-IRI (Figure 2, panel A). Marker genes are defined as the top 20 differentially expressed genes between cell types in the control samples. (C) and (D) IRI was performed on Six2GFP-cre; Rosa26tdTomato; tgHoxb7-Venus mice, in which cells of nephron progenitor origin are labeled with Tdt and all cells of ureteric progenitor origin are labeled with Venus. Kidneys were collected 12 hours post-IRI. Immunofluorescence staining showing colocalization of Sox9 and pStat3 (Tyr705) with Tdt and Venus, respectively. Scale bar 50 μm.
Figure 3
Figure 3
Single-nucleus multiomics (RNA+ATAC) of Ki67-lineage-traced cells to profile the long-term response to AKI. (A) Experimental setup. FACS, fluorescence-activated cell sorting. (B) Umap plots of the integrated AKI_GFP+, AKI_GFP, and control samples showing the unsupervised clustering on the basis of RNA data only, ATAC data only, and both RNA and ATAC data combined using a weighted nearest neighbor (wnn) analysis. DT, distal tubule; injured PT, injured proximal tubule; Interst, interstitital cells; Leuk, leukocytes; LOH-TL-C, loop of Henle thin limb of cortical nephron; LOH-TL-JM, loop of Henle thin limb of juxtamedullary nephron; Macroph, macrophages; Podo, podocytes; Vasc, vascular cells, remaining abbreviations as in Figure 2A. (C) Dot plot of marker genes arranged by cell type. (D) Stacked bar plot showing the composition of clusters by group normalized for the total cell number in each group. (E) Coverage plots of the Hnf4a gene body are shown for all cell types identified in panel (B).
Figure 4
Figure 4
Ki67-lineage-traced injured PTCs are heterogeneous and decrease in abundance in time post-AKI. (A) Subclustering of the AKI_GFP+ proximal tubule and thin limb of the loop of Henle clusters highlighted in Figure 3B. FR-PTC, failed-repair PTCs, remaining abbreviations as in Figure 3B. (B) Dot plot of marker genes arranged by cell type and stacked bar plot showing the composition of clusters by group normalized for the total cell number in each group. (C) Colocalization of GFP reporter with the proximal tubule marker Megalin only, indicating adaptive repair, or the injury markers Vcam1 and Havcr1, indicating failed repair at 4 weeks and 6 months post-IRI. Scale bar 10 μm. (D) Experimental setup to assess, if cell death contributes to the decrease of FR-PTCs in time post-AKI. (E) Colocalization of the Krt20INTACT GFP reporter with the injury marker Vcam1 in PTCs that have lower Megalin expression than surrounding cells at 4 weeks and 6 months post-IRI. At 6 months post-IRI some Krt20INTACT GFP+/Vcam1-PTCs are found. Scale bar 50 μm. (F) Quantification of the number of Krt20INTACT GFP+, Vcam1+ nuclei at 4 weeks (n=5) and 6 months (n=4) post-IRI. Bar plot shows the mean, error bars indicate the standard deviation. **P<0.001. PTCs, proximal tubule cells.
Figure 5
Figure 5
Chromatin accessibility and TF activity define adaptive and maladaptive proximal tubule cell states. (A) Heatmaps of average fragment counts within DAR in promotor regions (defined as transcription start site [TSS] ±1000 bp) or distal intergenic regions. Clusters correspond to Figure 4A. (B) Coverage plots around the Vcam1 locus are shown. DARs between the clusters identified in Figure 4A are highlighted in gray. DARs that correlate with Vcam1 gene expression in the same cluster are shown as arcs linking the DAR to the TSS of Vcam1. The intensity of the blue indicates the correlation coefficient (score). (C) Heatmap showing the average chromVAR motif activity per cluster. Only the top TF motifs with differential activity on the basis of the chromVAR analysis and differential expression on the basis of the RNA assay are shown. (D) Heatmap showing the average expression of the genes encoding the TFs for which differential motif activity was found between clusters (shown in panel C). DARs, differentially accessible regions; TF, transcription factor.
Figure 6
Figure 6
Validation of identified transcription factors in adaptive and maladaptive proximal tubule cells. (A–C) RNAscope (Slc34a1, Maf, Pou3f3) and immunofluorescence staining (Hnf4a) show strong expression of Maf in PT segment 1 and 2 (Hnf4a+, Slc34a1+), whereas Pou3f3 is increasingly activated distal of PT segment 1. ISOM, inner stripe of outer medulla; OSOM, outer stripe of outer medulla. (D) Maf and Hnf4a are downregulated in maladaptive PTCs (Ki67INTACT-GFP+, Vcam1+, red arrowhead) compared to adjacent adaptive PTCs (Ki67INTACT-GFP+, Vcam1, white arrowhead). RNAscope (Klf6) and immunofluorescence show upregulation of Creb5 (E) and Klf6 (F) in maladaptive (Ki67INTACT-GFP+, Vcam1+, red arrowhead) compared to adjacent adaptive (Ki67INTACT-GFP+, Vcam1, white arrowhead) PTCs. Scale bar in (A) 50 μm and in (B–F) 25 μm.
Figure 7
Figure 7
AKI alters the transcriptional state of adaptive proximal tubule cells long-term. (A) Schematic of the analysis performed: gene expression profile of AKI_GFP+ and control samples was compared per cell type to identify differentially expressed genes (DEG) using a Wilcoxon Rank Sum test. (B) Upset plot showing the number of DEG between AKI_GFP+ and control samples per cell type as identified in Figure 3B. The total number of DEG per cell type is shown by the bar plots on the right of the graph. The bar plots on the top of the graph show gene sets that are shared between clusters as indicated by the connected dots or unique to a cell type. Only sets with a minimum of 10 genes are shown. (C) Violin plots showing the average expression of selected genes in AKI_GFP+ and control samples in the different segments of the proximal tubule. The clusters PTS1_1 and PTS1_2 were pooled for this visualization. (D) Volcano plot showing all DEG (padj.<0.01) between AKI_GFP+ proximal tubule segment 3 (PTS3) and control PTS3. Genes with a log2FC ≥0.25 are shown in red, genes with a log2FC ≤−0.25 are shown in blue. (E) and (F) Top 10 enriched gene ontology (GO) terms of the up- and downregulated genes shown in panel (D). (G) Violin plots showing the chromVAR motif activity of the Stat5a::Stat5b and the NR3C1 motif in AKI_GFP+ and control PTS3 cluster. Horizontal lines indicate the median.

References

    1. Mehta RL, Cerdá J, Burdmann EA, et al. International Society of Nephrology’s 0by25 initiative for acute kidney injury (zero preventable deaths by 2025): a human rights case for nephrology. Lancet. 2015;385(9987):2616-2643. doi:10.1016/s0140-6736(15)60126-x - DOI - PubMed
    1. Grams ME, Yang W, Rebholz CM, et al. Risks of adverse events in advanced CKD: the Chronic Renal Insufficiency Cohort (CRIC) study. Am J Kidney Dis. 2017;70(3):337-346. doi:10.1053/j.ajkd.2017.01.050 - DOI - PMC - PubMed
    1. Humphreys BD, Valerius MT, Kobayashi A, et al. Intrinsic epithelial cells repair the kidney after injury. Cell Stem Cell. 2008;2(3):284-291. doi:10.1016/j.stem.2008.01.014 - DOI - PubMed
    1. Humphreys BD, Czerniak S, DiRocco DP, Hasnain W, Cheema R, Bonventre JV. Repair of injured proximal tubule does not involve specialized progenitors. Proc Natl Acad Sci U S A. 2011;108(22):9226-9231. doi:10.1073/pnas.1100629108 - DOI - PMC - PubMed
    1. Rinkevich Y, Montoro DT, Contreras-Trujillo H, et al. In vivo clonal analysis reveals lineage-restricted progenitor characteristics in mammalian kidney development, maintenance and regeneration. Cell Rep. 2014;7(4):1270-1283. doi:10.1016/j.celrep.2014.04.018 - DOI - PMC - PubMed

Publication types