Review
. 2023 Mar:93:101168.
doi: 10.1016/j.preteyeres.2023.101168. Epub 2023 Feb 1.

Amblyopia and the whole child

Affiliations
Review

Amblyopia and the whole child

Eileen E Birch et al. Prog Retin Eye Res. 2023 Mar.

Abstract

Amblyopia is a disorder of neurodevelopment that occurs when there is discordant binocular visual experience during the first years of life. While treatments are effective in improving visual acuity, there are significant individual differences in response to treatment that cannot be attributed solely to difference in adherence. In this considerable variability in response to treatment, we argue that treatment outcomes might be optimized by utilizing deep phenotyping of amblyopic deficits to guide alternative treatment choices. In addition, an understanding of the broader knock-on effects of amblyopia on developing visually-guided skills, self-perception, and quality of life will facilitate a whole person healthcare approach to amblyopia.

Keywords: Amblyopia; Child development; Deep phenotyping; Whole person health.


Conflict of interest statement

Declaration of competing interest None of the authors has a financial conflict of interest with the material presented in this manuscript.

Figures

Fig. 1.
Fig. 1.
Objectively monitored dose-response for (A) patching (Stewart et al., 2004a) and (B) binocular game treatment (Birch et al., 2020b) to illustrate the dose-response relationships. Note that, even within a group of children who achieved approximately the same number of hours of a treatment, there were considerable individual differences in the amount of visual acuity improvement. The horizontal line within each box represents the median improvement in amblyopic eye best corrected visual acuity (AE BCVA, logMAR), the boxes correspond to the 25th to 75th percentiles, and the whiskers correspond to the fifth and 95th percentiles.
Fig. 2.
Fig. 2.
Bar graphs showing mean standard scores for fine motor tasks of the Movement ABC-2 among children ages 3–13 years. Amblyopic children (purple, n = 98) had lower standard scores (i.e., performed worse) compared to control children (green, n = 38) for unimanual dexterity, bimanual dexterity, drawing trail, and catching, but not for aiming. Based on data from (Kelly et al., 2020). Error bars represent ± SEM. Dashed lines represent 50th percentile (standard score of 10). *Significantly different from controls.
Fig. 3.
Fig. 3.
Eye-hand coordination during visually-guided reaching in strabismic children with amblyopia (purple, n = 19) and controls (green, n = 35) aged 7–12 years while completing a point to touch task. (A) Bar graphs showing mean total reach duration, acceleration duration, deceleration duration, and touch accuracy for the amblyopic group (purple) and control group (green). Amblyopic children took longer to touch the dot, due to longer deceleration duration, and had poorer touch accuracy than controls. Errors bars represent ± SEM. *significantly different from controls. (B) Examples of a typical visually-guided reaching trial for an amblyopic child (top) and a control child (bottom). Children were asked to reach out and touch a dot on a screen 35 cm away while their eye and index finger movements were being simultaneously recorded. The right panel shows velocity for the reach to the dot (right y-axis, blue) and for the saccade to the dot (left y-axis, red). The dotted line indicates primary saccade latency (SL). For the amblyopic child, saccade latency was prolonged and a reach-related saccade (RRS) was present. The left panel shows reduced saccade precision (i.e., more variability in saccade landing position) in the amblyopic child compared to the control child. Based on data from (Kelly et al., 2021 and Kelly et al., 2022).
Fig. 4.
Fig. 4.
Bar graphs showing mean standard scores for gross motor subtasks of the Movement ABC-2 in children ages 3–13 years. Amblyopic children (purple, n = 98) had lower mean standard scores (i.e., performed worse) for static balance, walking, and jumping compared to controls (green, n = 38). Based on data from (Kelly et al., 2020). Error bars represent ± SEM. Dashed lines represent 50th percentile (standard score of 10). *Significantly different from controls.
Fig. 5.
Fig. 5.
Factors associated with gross motor skills from the Movement ABC-2 in amblyopic children, including amblyopia severity (mild 0.2 logMAR; moderate/severe >0.2 logMAR), stereoacuity present (yes, stereo +; no, stereo −), and fusion at distance (3 m) evaluated with the Worth 4-dot test (yes, fusion +; no, fusion −). Based on data from (Kelly et al., 2020). The horizontal line within each box represents the median amblyopic eye (AE) visual acuity, the boxes correspond to the 25th to 75th percentiles, and the whiskers correspond to the fifth and 95th percentiles. *Significantly different from controls (green).
Fig. 6.
Fig. 6.
Preliminary data showing postural stability measured by the Standing Balance Task from the Motor Domain of the NIH ToolboxR. Children age 7–11 years were asked to hold their balance for 50 s while completing 5 different balance positions; 1) eyes open, both feet on the floor, 2) eyes closed, both feet on the floor, 3) eyes open, both feet on a foam mat, 4) eyes closed, both feet on a foam mat, and 5) eyes open, feet tandem (heel touching toe) on the floor. An iPod attached to the child’s waist measured anterior-posterior sway using the built-in accelerometer. An age corrected standard score is calculated combining the sway data from all 5 balance positions. Amblyopic children (purple, n = 13) had lower mean age-corrected standard scores (i.e., poorer balance) than control children (green, n = 13). Error bars represent ± SEM. *Significantly different from controls.
Fig. 7.
Fig. 7.
A) Bar graph for amblyopic children who completed grades 1–6 (ages 7–12 years) showing no difference in the Readalzyer mean reading rate (words per minute, WPM) based on amblyopic eye best corrected visual acuity (BCVA; mild, 0.2 logMAR, n = 29, dark purple bar; moderate, 0.3–0.6 logMAR, n = 97, light purple bar; severe, ≥0.7 logMAR, n = 20, white bar). All three amblyopic categories read significantly slower (i.e. lower reading rate) than controls (n = 72, green bar). Error bars represent SEM. *Significantly different from controls. B) Scatterplots showing no relationship of reading rate (words per minute, WPM) with amblyopic eye BCVA, stereoacuity, or suppression in children with amblyopia. Based on data from (Kelly et al., 2015; Kelly et al., 2017).
Fig. 8.
Fig. 8.
Bar graphs for children who completed grades 1–6 (ages 7–12 years) showing no difference in Readalyzer mean reading rate (words per minute, WPM) between binocular reading (striped bars) and fellow eye reading (dotted bars) in amblyopic children (purple, n = 38), but slower binocular and fellow eye reading (i.e. lower reading rate) than controls (green, n = 36). Based on data from (Kelly et al. 2023). Error bars represent ± SEM. *Significantly different from controls.
Fig. 9.
Fig. 9.
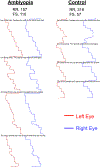
Left eye (red line) and right eye (blue line) horizontal eye movements as an amblyopic child and a control child read through a grade 6 paragraph. The amblyopic child reads slower (157 vs 318 words per minute) and makes more forward saccades (110 vs 57). RR, reading rate; FS, forward saccades.
Fig. 10.
Fig. 10.
The relationship between slow reading and eye movements in children with amblyopia who completed grades 1–6 (ages 7–12 years). (A) Bar graphs showing an increase in the number of forward saccades (per 100 words) during binocular reading for amblyopic children (purple, n = 25) compared to controls (green, n = 25). Adapted from (Kelly et al., 2015). (B) Scatterplots showing significant correlations of binocular reading rate (words per minute, WPM) with the number of forward saccades (per 100 words) produced during binocular reading and with fellow eye fixation instability for children with anisometropic amblyopia. Adapted from Kelly et al., 2017). (C) Bar graphs showing no difference in the number of forward saccades (per 100 words) during binocular reading (purple stripes) and fellow eye reading (purple dots) in amblyopic children (n = 38). *Significantly different from controls. Adapted from (correction for current Kelly citation with no date). Error bars represent ± SEM.
Fig. 11.
Fig. 11.
A) Time course of one trial of rapid serial visual presentation (RSVP) reading. Each word of one sentence is presented centrally one at a time for a fixed exposure time, which varies during the experiment to determine the fastest exposure time (i.e., threshold) that the child can read. B) Log mean RSVP reading rate (words per minute, WPM) for children with amblyopia who completed grades 1–6 (ages 7–12 years; purple, n = 18) was slower than the control group (green, n = 15) (Adapted from Mir Norouzi et al., 2022 Vision Sciences Society Meeting). Error bars represent ±SEM. *Significantly different from controls.
Fig. 12.
Fig. 12.
Line graph showing significantly slower reading rate (words per minute, WPM) for amblyopic children (purple line, triangle, n = 140) compared with controls (green line, circle, n = 67) who have completed grades 3 and 4 but not for children who have completed grades 1 or 2. Approximate age equivalents for children who have completed grade 1 (7.7 ± 0.5 years), grade 2 (8.7 ± 0.4 years), grade 3 (age 9.6 ± 0.4 years, and grade 4 (10.6 ± 0.4 years). Error bars represent ±SEM. *Significantly different from controls.
Fig. 13.
Fig. 13.
Line graph showing no difference in reading rate (words per minute, WPM) between amblyopic children who have recovered normal visual acuity (purple line, triangle, n = 31) and controls (green line, circle, n = 67). Approximate age equivalents for children who have completed grade 1 (7.7 ± 0.5 years), grade 2 (8.7 ± 0.4 years), grade 3 (age 9.6 ± 0.4 years, and grade 4 (10.6 ± 0.4 years). Error bars represent ± SEM.
Fig. 14.
Fig. 14.
Sample items from the Preschool-Kindergarten Pictorial Scale of Perceived Competence and Social Acceptance for Young Children (Harter and Pike, 1984). These items were chosen from the version designed for use with girls in preschool.
Fig. 15.
Fig. 15.
Self-perception domain scores from the Preschool-Kindergarten Pictorial Scale of Perceived Competence and Social Acceptance for Young Children (Harter and Pike, 1984) for amblyopic children aged 3–7 years at baseline (purple, n = 60; reported in (Birch et al., 2019a) and following recovery of normal visual acuity with treatment (n = 82). Data from age-similar controls (green, n = 20) are shown for comparison. Self-perception was lower (i.e., poorer) for amblyopic children than controls for physical competence and peer acceptance. Despite recovery of normal visual acuity with treatment, physical competence domain scores for children remained significantly lower than controls, even among those who also had improvement of stereoacuity (striped purple, n = 40). Peer acceptance domain scores improved for amblyopic children who recovered visual acuity and had improved stereoacuity while those who failed to make gains in stereoacuity (dotted, n = 42) remained significantly lower than controls. Error bars represent ±SEM. *Significantly different from controls.
Fig. 16.
Fig. 16.
Self-perception domain scores from the Self-Perception Profile for Children Survey (Harter, 1982) for amblyopic children in aged 8–13 years at baseline (purple, n = 50, reported in (Birch et al., 2018) and following recovery of normal visual acuity with treatment (n = 38). Data from age-similar controls (green, n = 18) are shown for comparison. Self-perception was lower (i.e., poorer) for amblyopic children than controls for scholastic competence, social acceptance, and athletic competence. Despite recovery of normal visual acuity with treatment, scholastic competence and social acceptance domain scores for children remained significantly lower than control, even among those who also had improvement of stereoacuity (striped purple, n = 17). Athletic competence domain scores improved for amblyopic children who recovered visual acuity and had improved stereoacuity while those who failed to make gains in stereoacuity (dotted, n = 21) remained significantly lower than control. Error bars represent ±SEM. *Significantly different from controls.

References

    1. Abbott J, Shah P, 2020. Amblyopia, deprivation and health disparities research: challenges in 2020. Eye 34, 1491–1493. 10.1038/s41433-020-0823-2. - DOI - PMC - PubMed
    1. Abrahamsson M, Sjostrand J, 1988. Contrast sensitivity and acuity relationship in strabismic and anisometropic amblyopia. Br. J. Ophthalmol 72, 44–49. 10.1136/bjo.72.1.44. - DOI - PMC - PubMed
    1. Aljohani S, Bailey J, Perno L, et al., 2020. The feasibility of an educational cartoon video to improve compliance with patching in amblyopic children. Invest. Ophthalmol. Vis. Sci 61, 506.
    1. Alramis F, Roy E, Christian L, Niechwiej-Szwedo E, 2016. Contribution of binocular vision to the performance of complex manipulation tasks in 5–13 years old visually-normal children. Hum. Mov. Sci 46, 52–62. 10.1016/j.humov.2015.12.006. - DOI - PubMed
    1. Alsaqr AM, Masmali AM, 2019. The awareness of amblyopia among parents in Saudi Arabia. Ther Adv Ophthalmol 11, 2515841419868103. 10.1177/2515841419868103. - DOI - PMC - PubMed

Publication types