. 2023 Feb 2;186(3):621-645.e33.
doi: 10.1016/j.cell.2022.12.038.

Human IRF1 governs macrophagic IFN-γ immunity to mycobacteria

Jérémie Rosain  1 Anna-Lena Neehus  2 Jérémy Manry  3 Rui Yang  4 Jérémie Le Pen  5 Wassim Daher  6 Zhiyong Liu  4 Yi-Hao Chan  4 Natalia Tahuil  7 Özden Türel  8 Mathieu Bourgey  9 Masato Ogishi  4 Jean-Marc Doisne  10 Helena M Izquierdo  11 Takayoshi Shirasaki  12 Tom Le Voyer  13 Antoine Guérin  14 Paul Bastard  15 Marcela Moncada-Vélez  4 Ji Eun Han  4 Taushif Khan  16 Franck Rapaport  4 Seon-Hui Hong  5 Andrew Cheung  5 Kathrin Haake  17 Barbara C Mindt  18 Laura Pérez  19 Quentin Philippot  13 Danyel Lee  20 Peng Zhang  4 Darawan Rinchai  4 Fatima Al Ali  16 Manar Mahmoud Ahmad Ata  16 Mahbuba Rahman  16 Jessica N Peel  4 Søren Heissel  21 Henrik Molina  21 Yasemin Kendir-Demirkol  22 Rasheed Bailey  4 Shuxiang Zhao  4 Jonathan Bohlen  13 Mathieu Mancini  23 Yoann Seeleuthner  13 Marie Roelens  24 Lazaro Lorenzo  13 Camille Soudée  13 María Elvira Josefina Paz  25 María Laura González  26 Mohamed Jeljeli  27 Jean Soulier  28 Serge Romana  29 Anne-Sophie L'Honneur  30 Marie Materna  13 Rubén Martínez-Barricarte  31 Mathieu Pochon  13 Carmen Oleaga-Quintas  13 Alexandre Michev  13 Mélanie Migaud  13 Romain Lévy  32 Marie-Alexandra Alyanakian  33 Flore Rozenberg  30 Carys A Croft  34 Guillaume Vogt  35 Jean-François Emile  36 Laurent Kremer  6 Cindy S Ma  14 Jörg H Fritz  37 Stanley M Lemon  12 András N Spaan  38 Nicolas Manel  11 Laurent Abel  20 Margaret R MacDonald  5 Stéphanie Boisson-Dupuis  20 Nico Marr  39 Stuart G Tangye  14 James P Di Santo  10 Qian Zhang  20 Shen-Ying Zhang  20 Charles M Rice  5 Vivien Béziat  20 Nico Lachmann  40 David Langlais  41 Jean-Laurent Casanova  42 Philippe Gros  43 Jacinta Bustamante  44
Affiliations

Human IRF1 governs macrophagic IFN-γ immunity to mycobacteria

Jérémie Rosain et al. Cell. .

Abstract

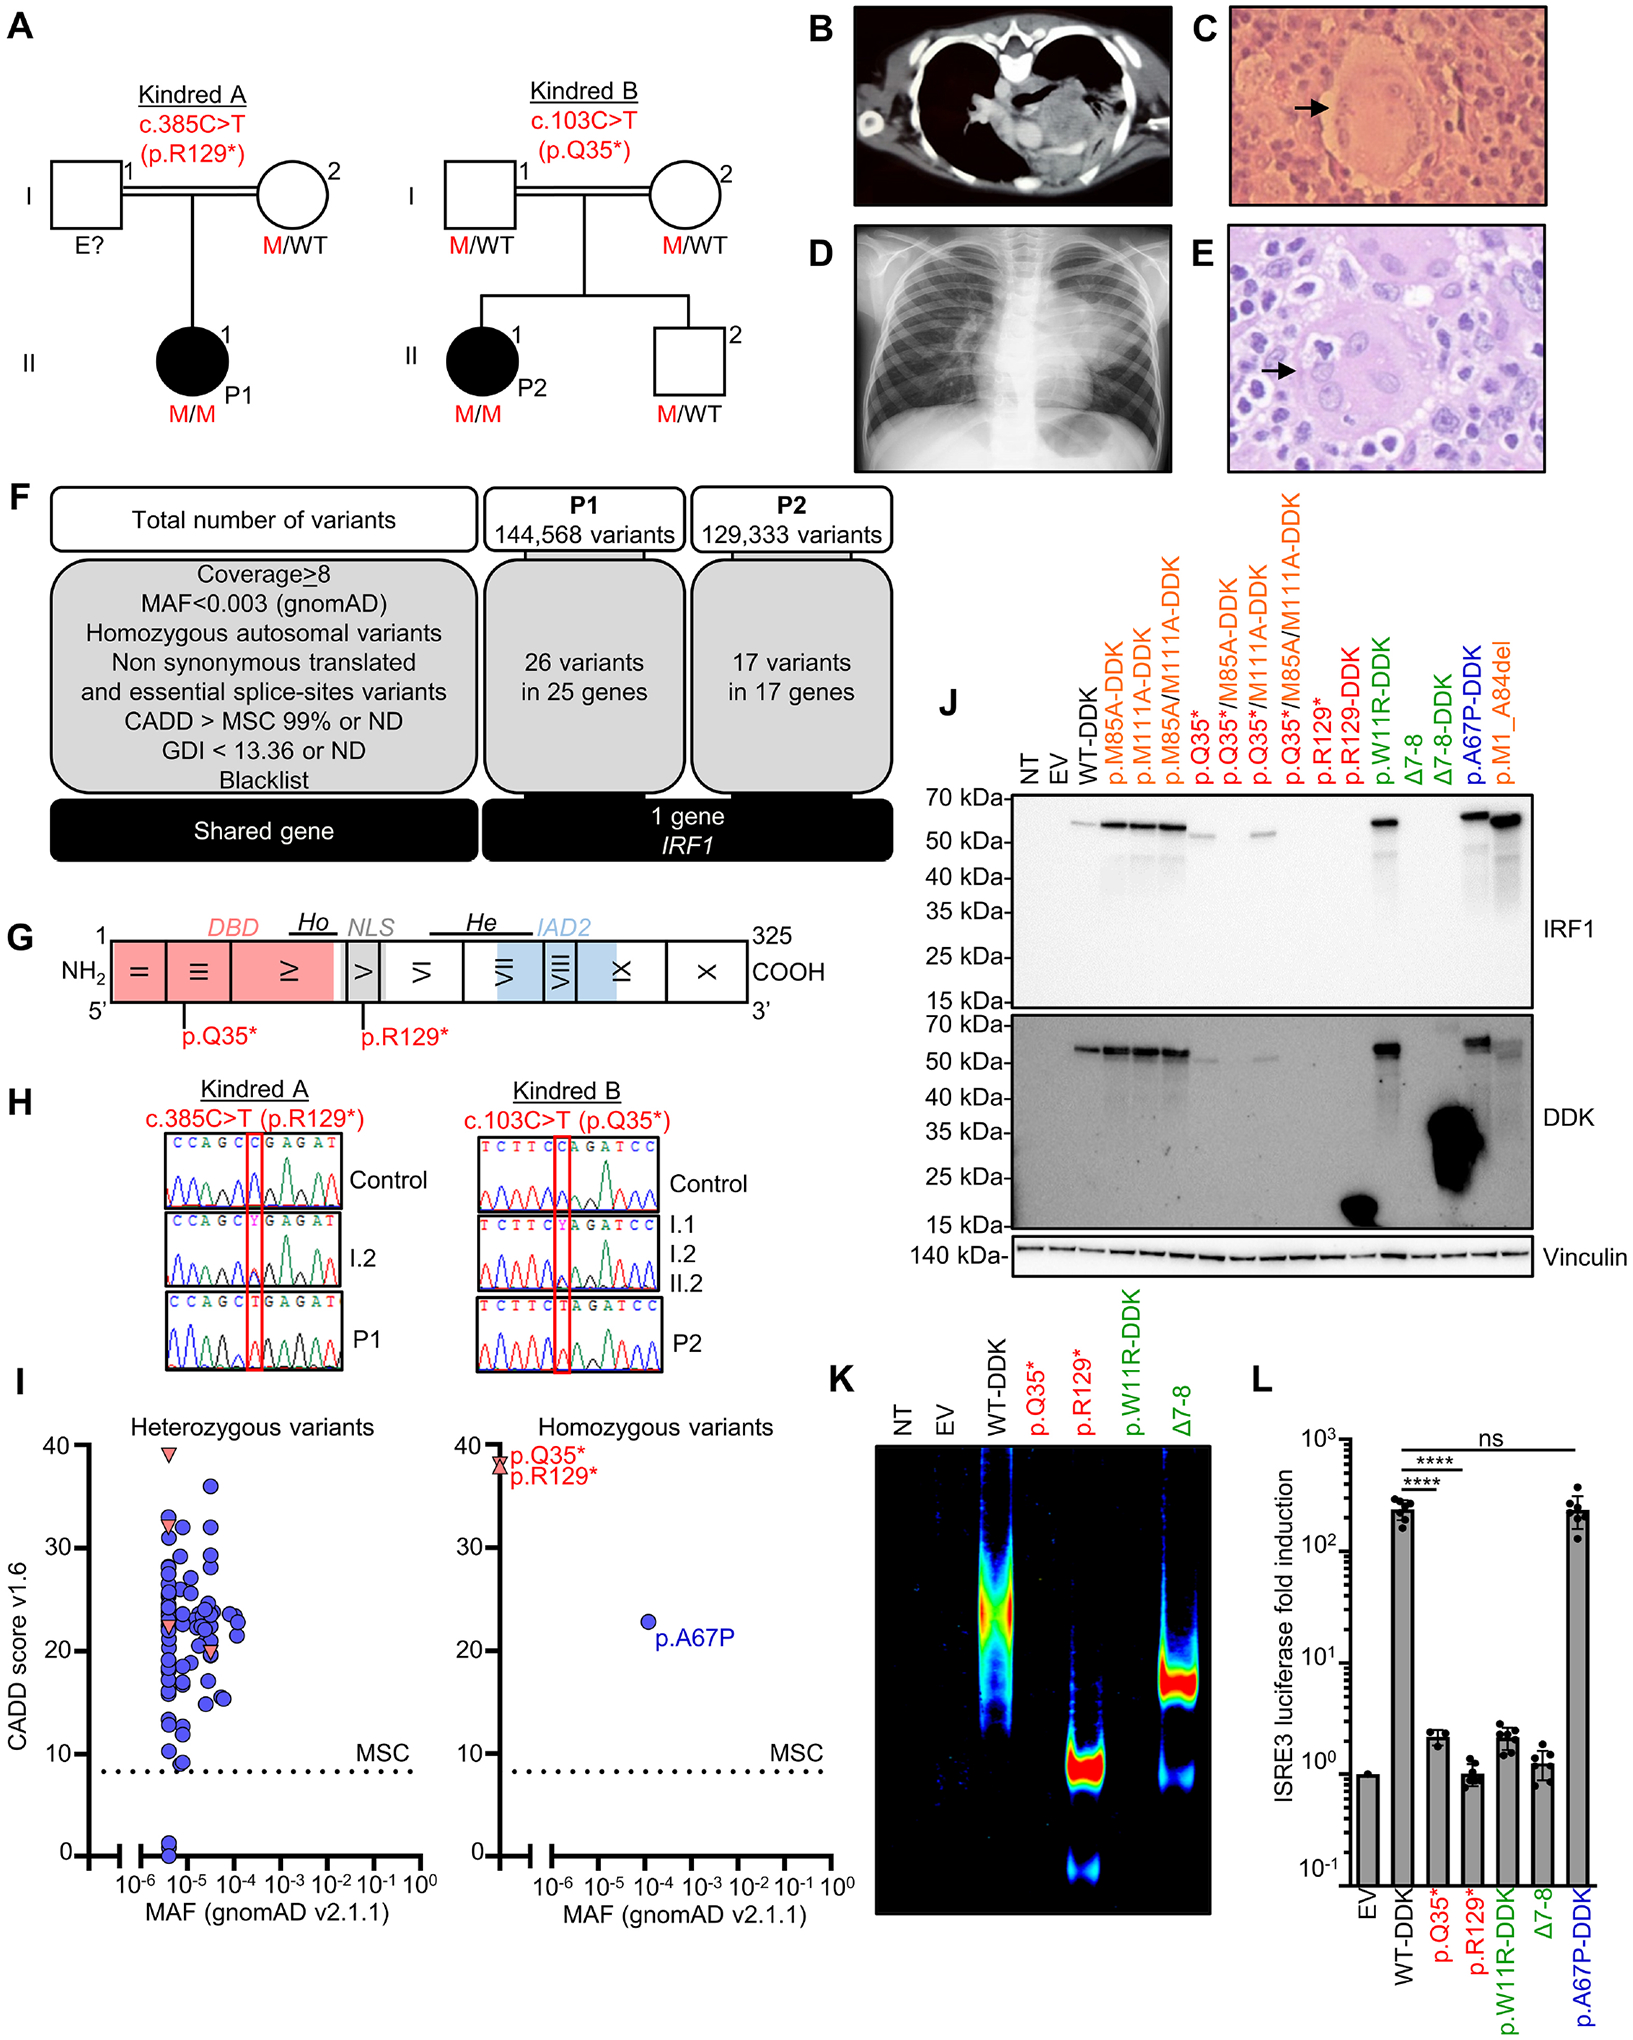
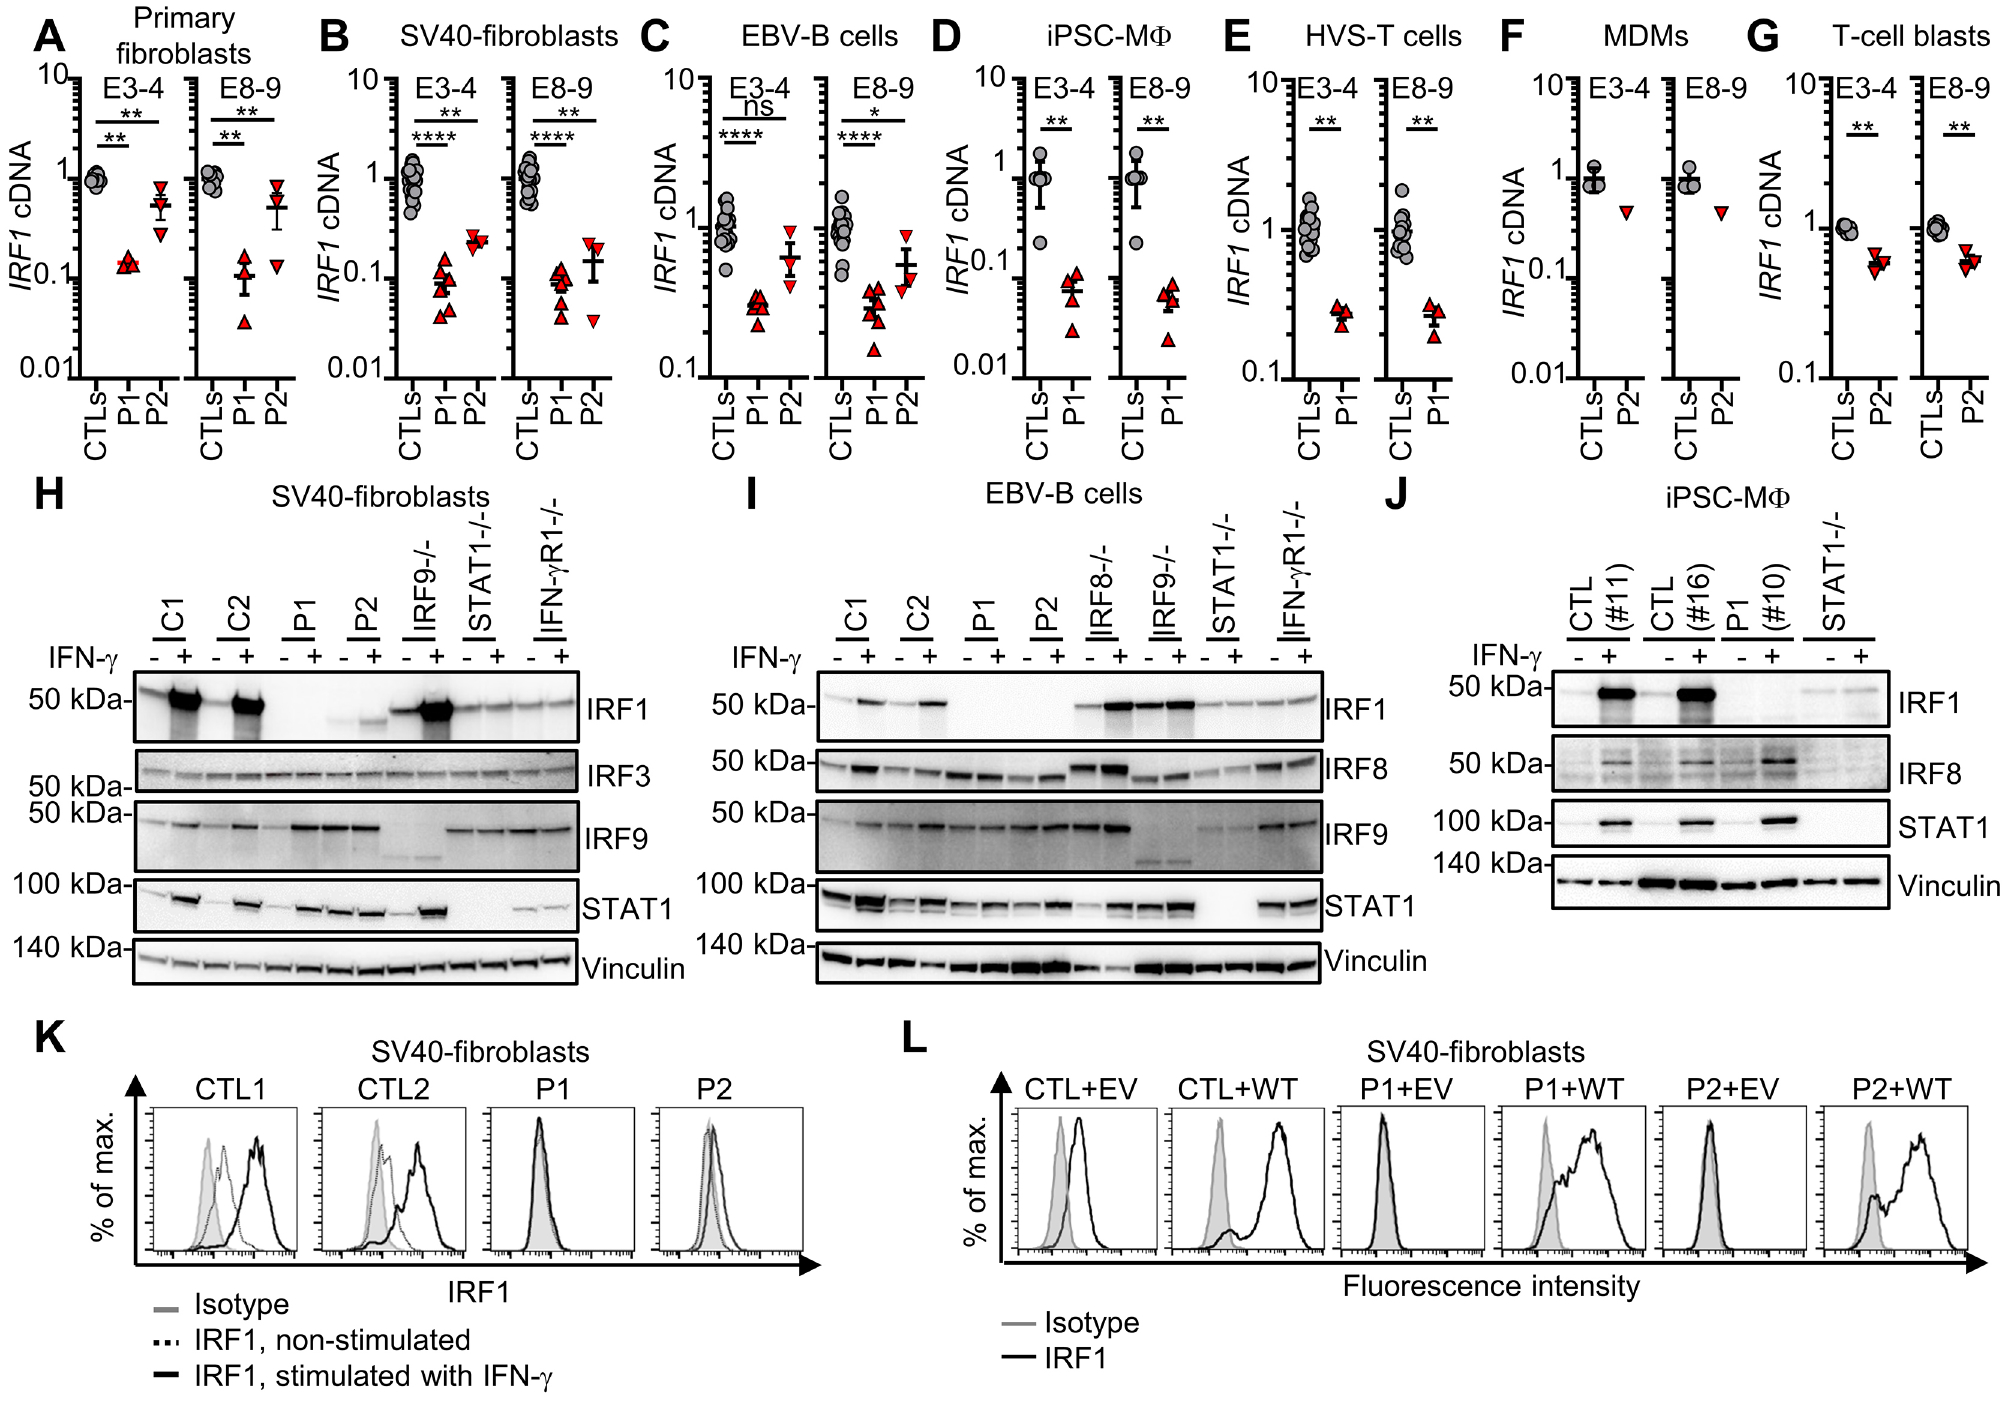
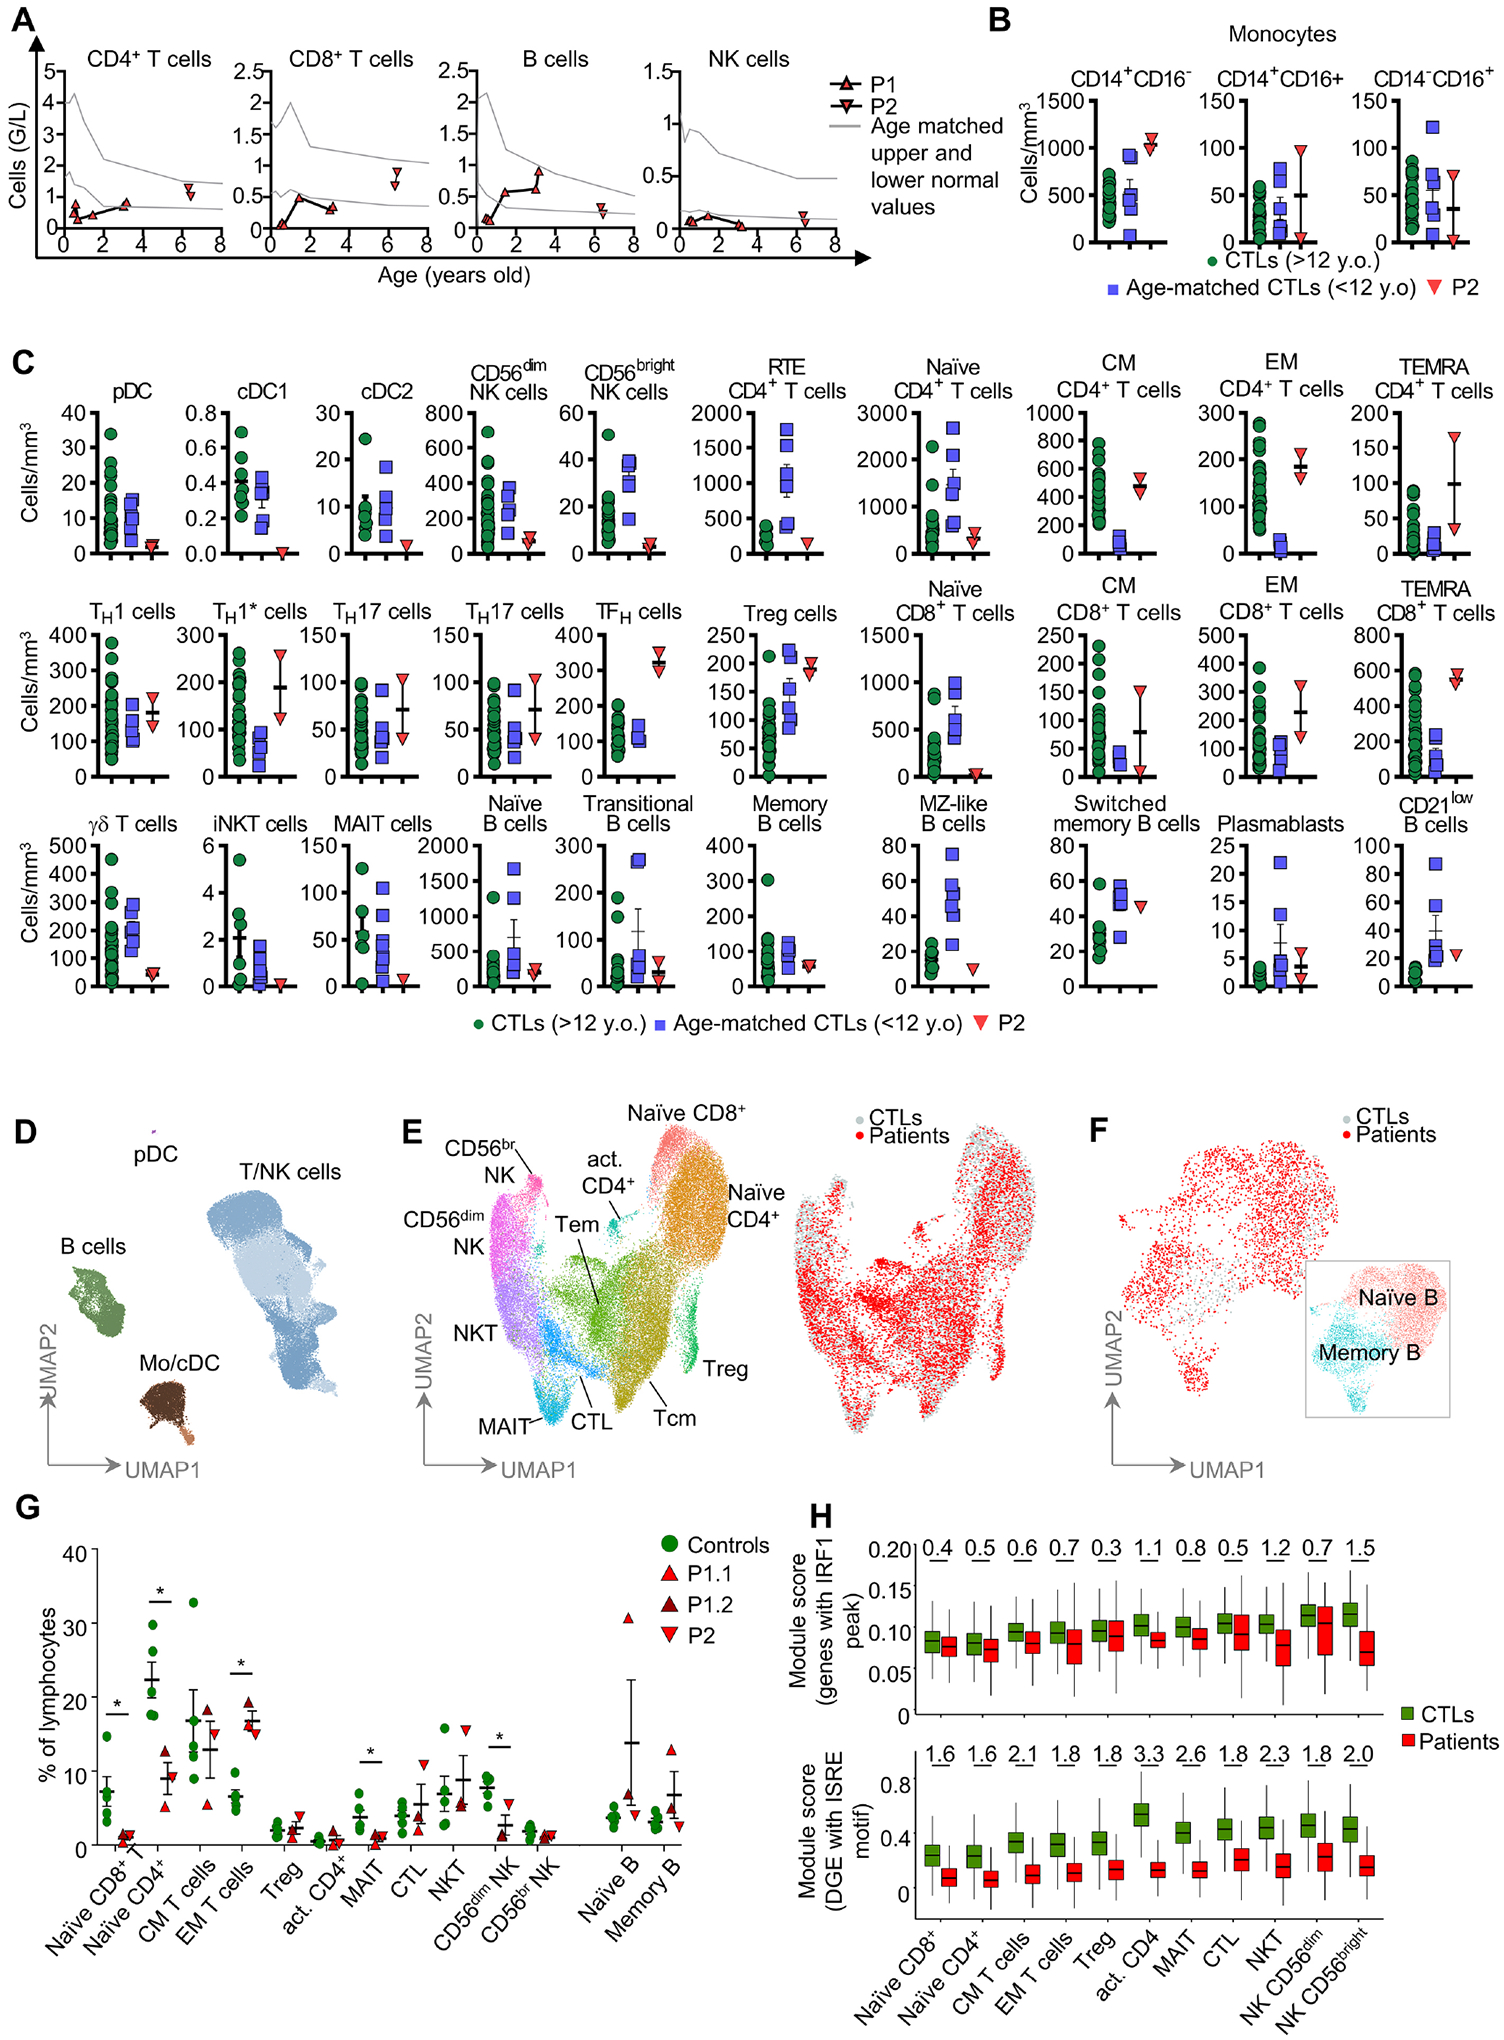
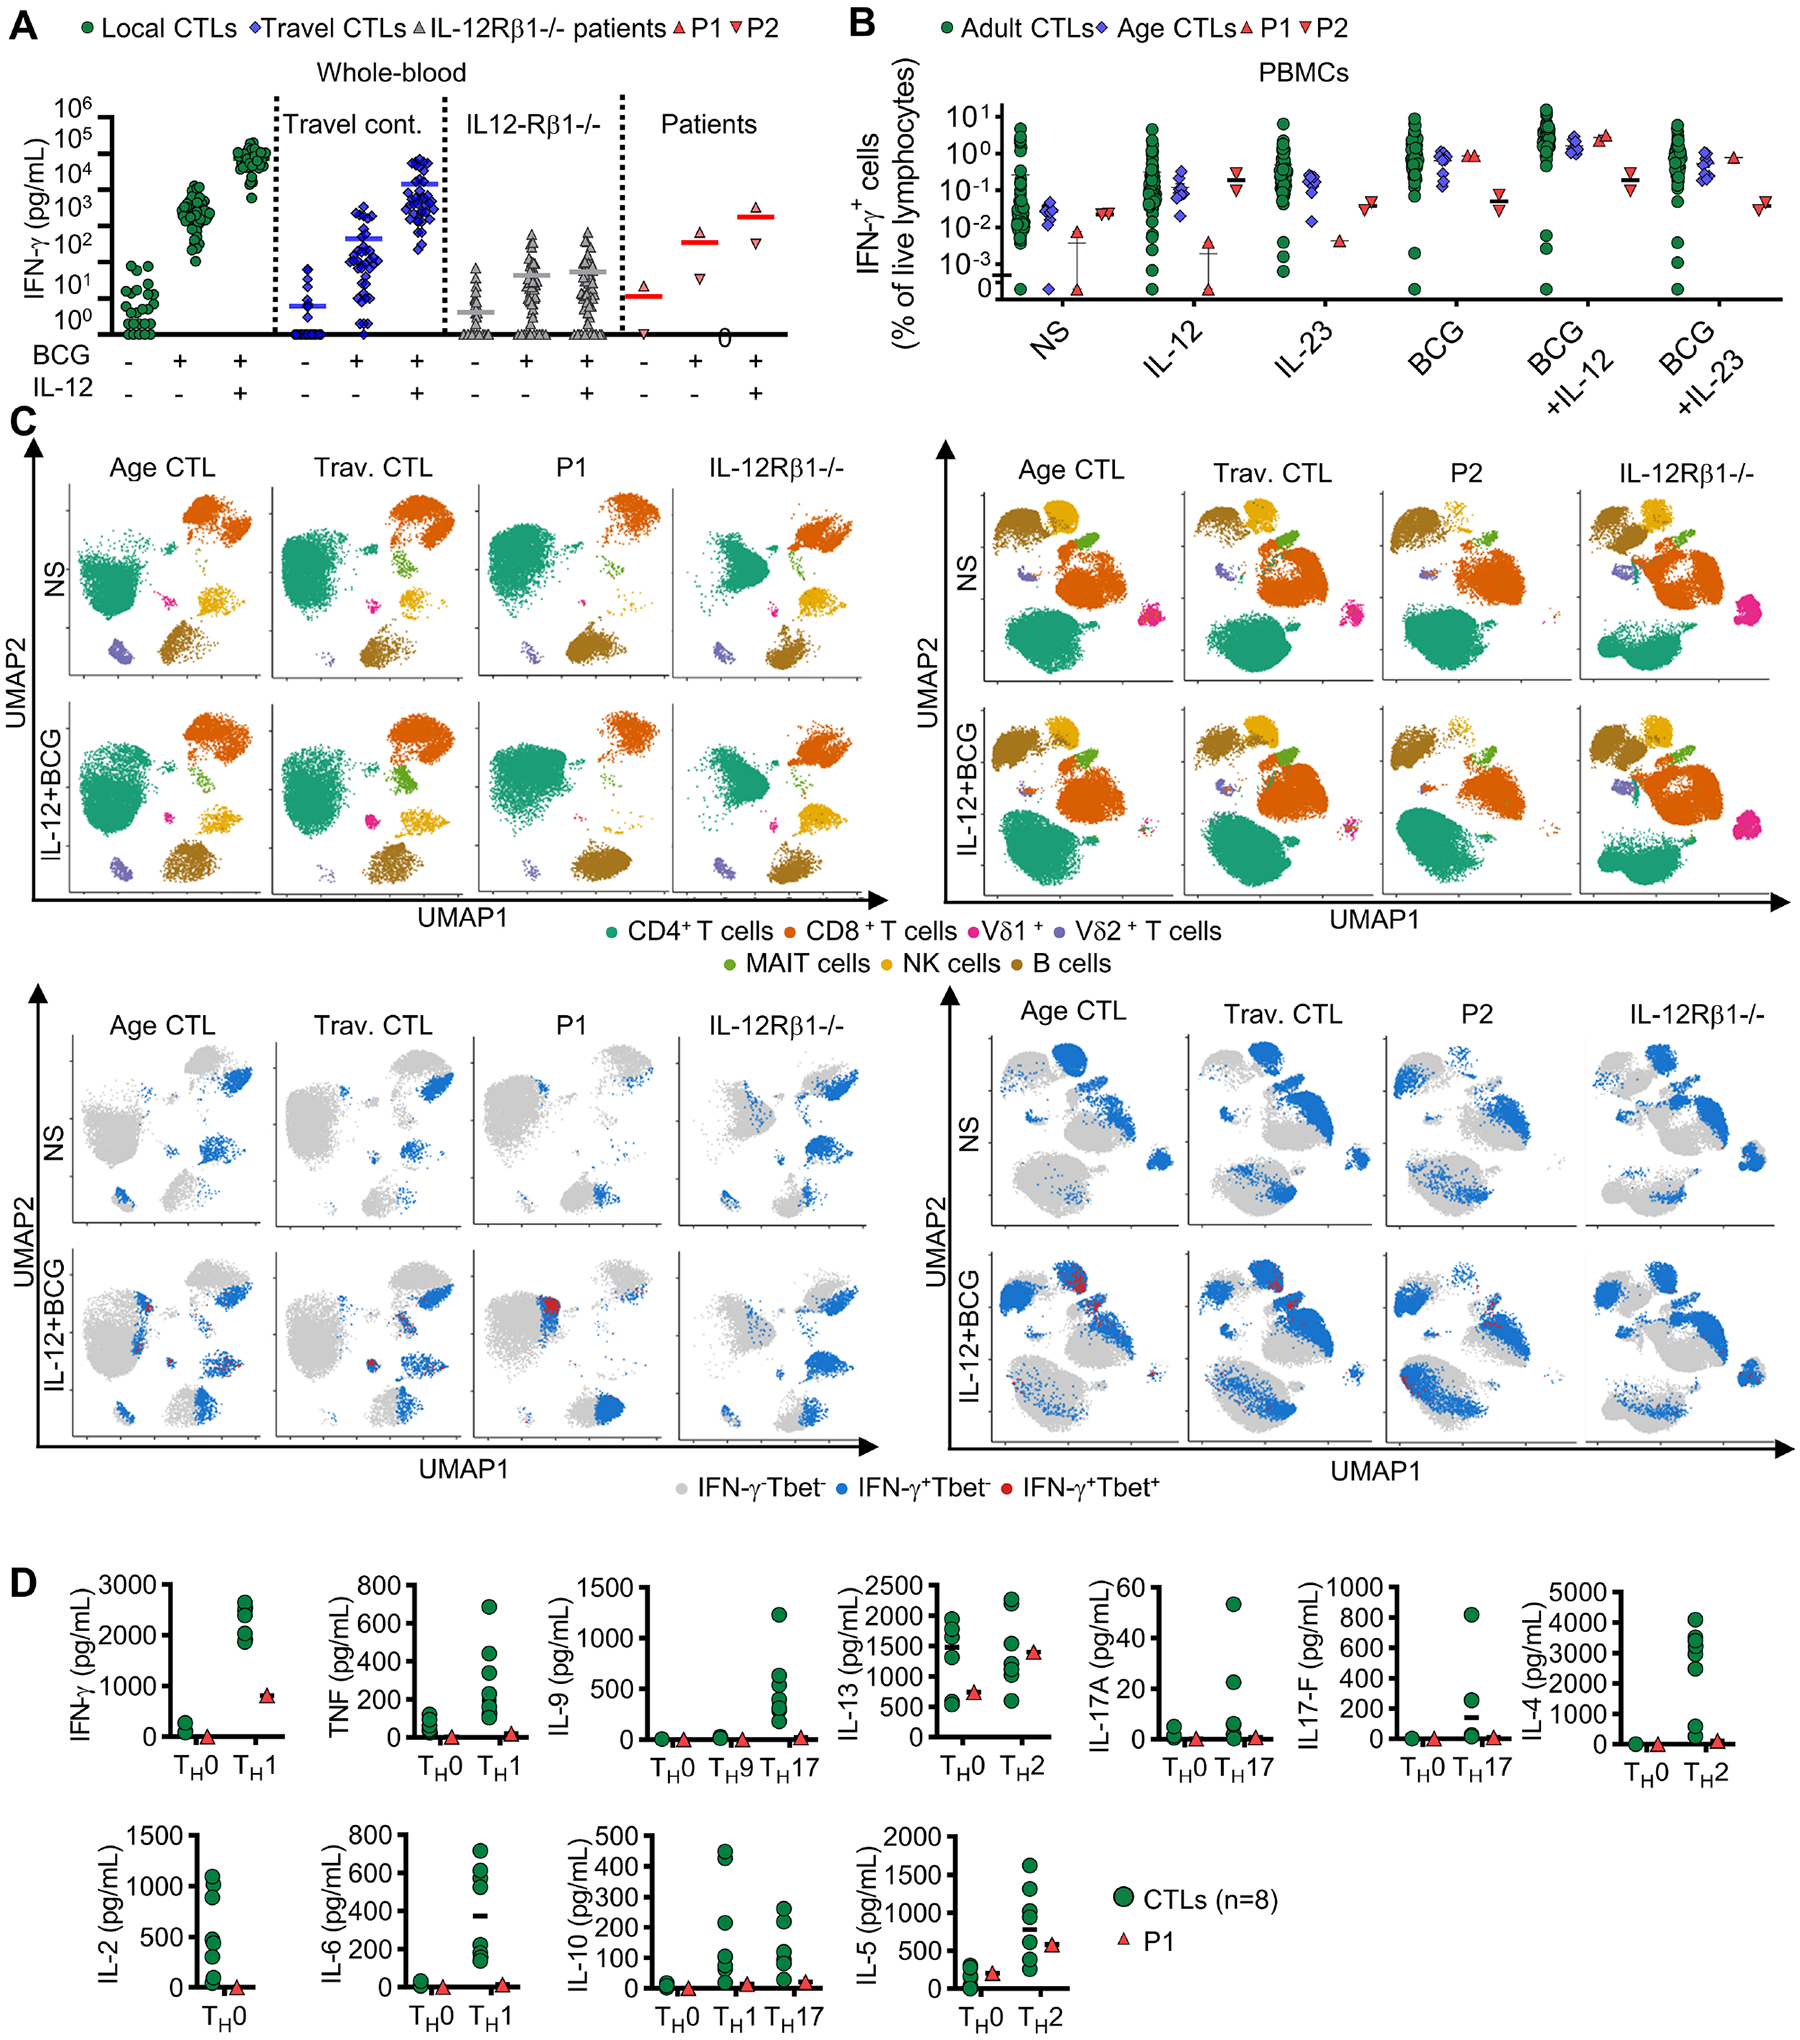
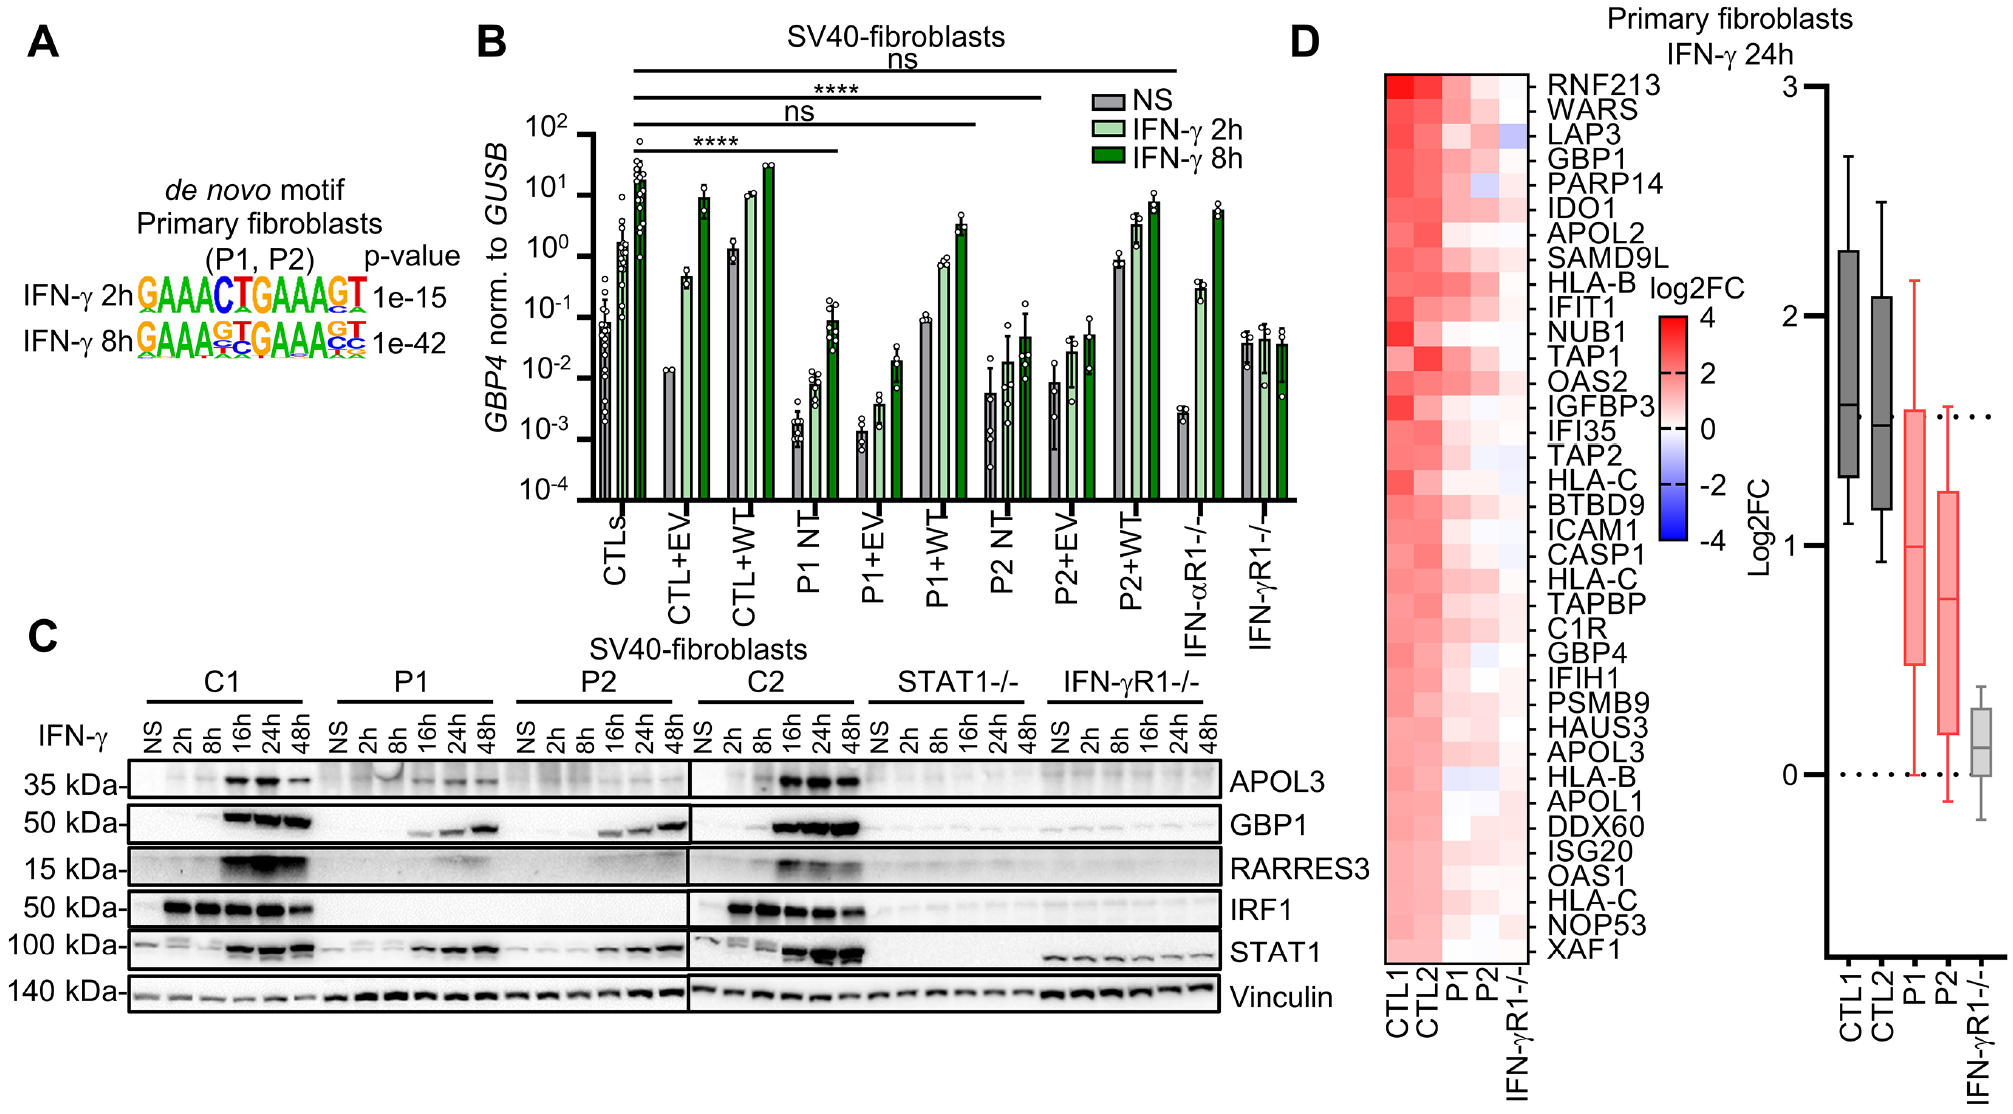
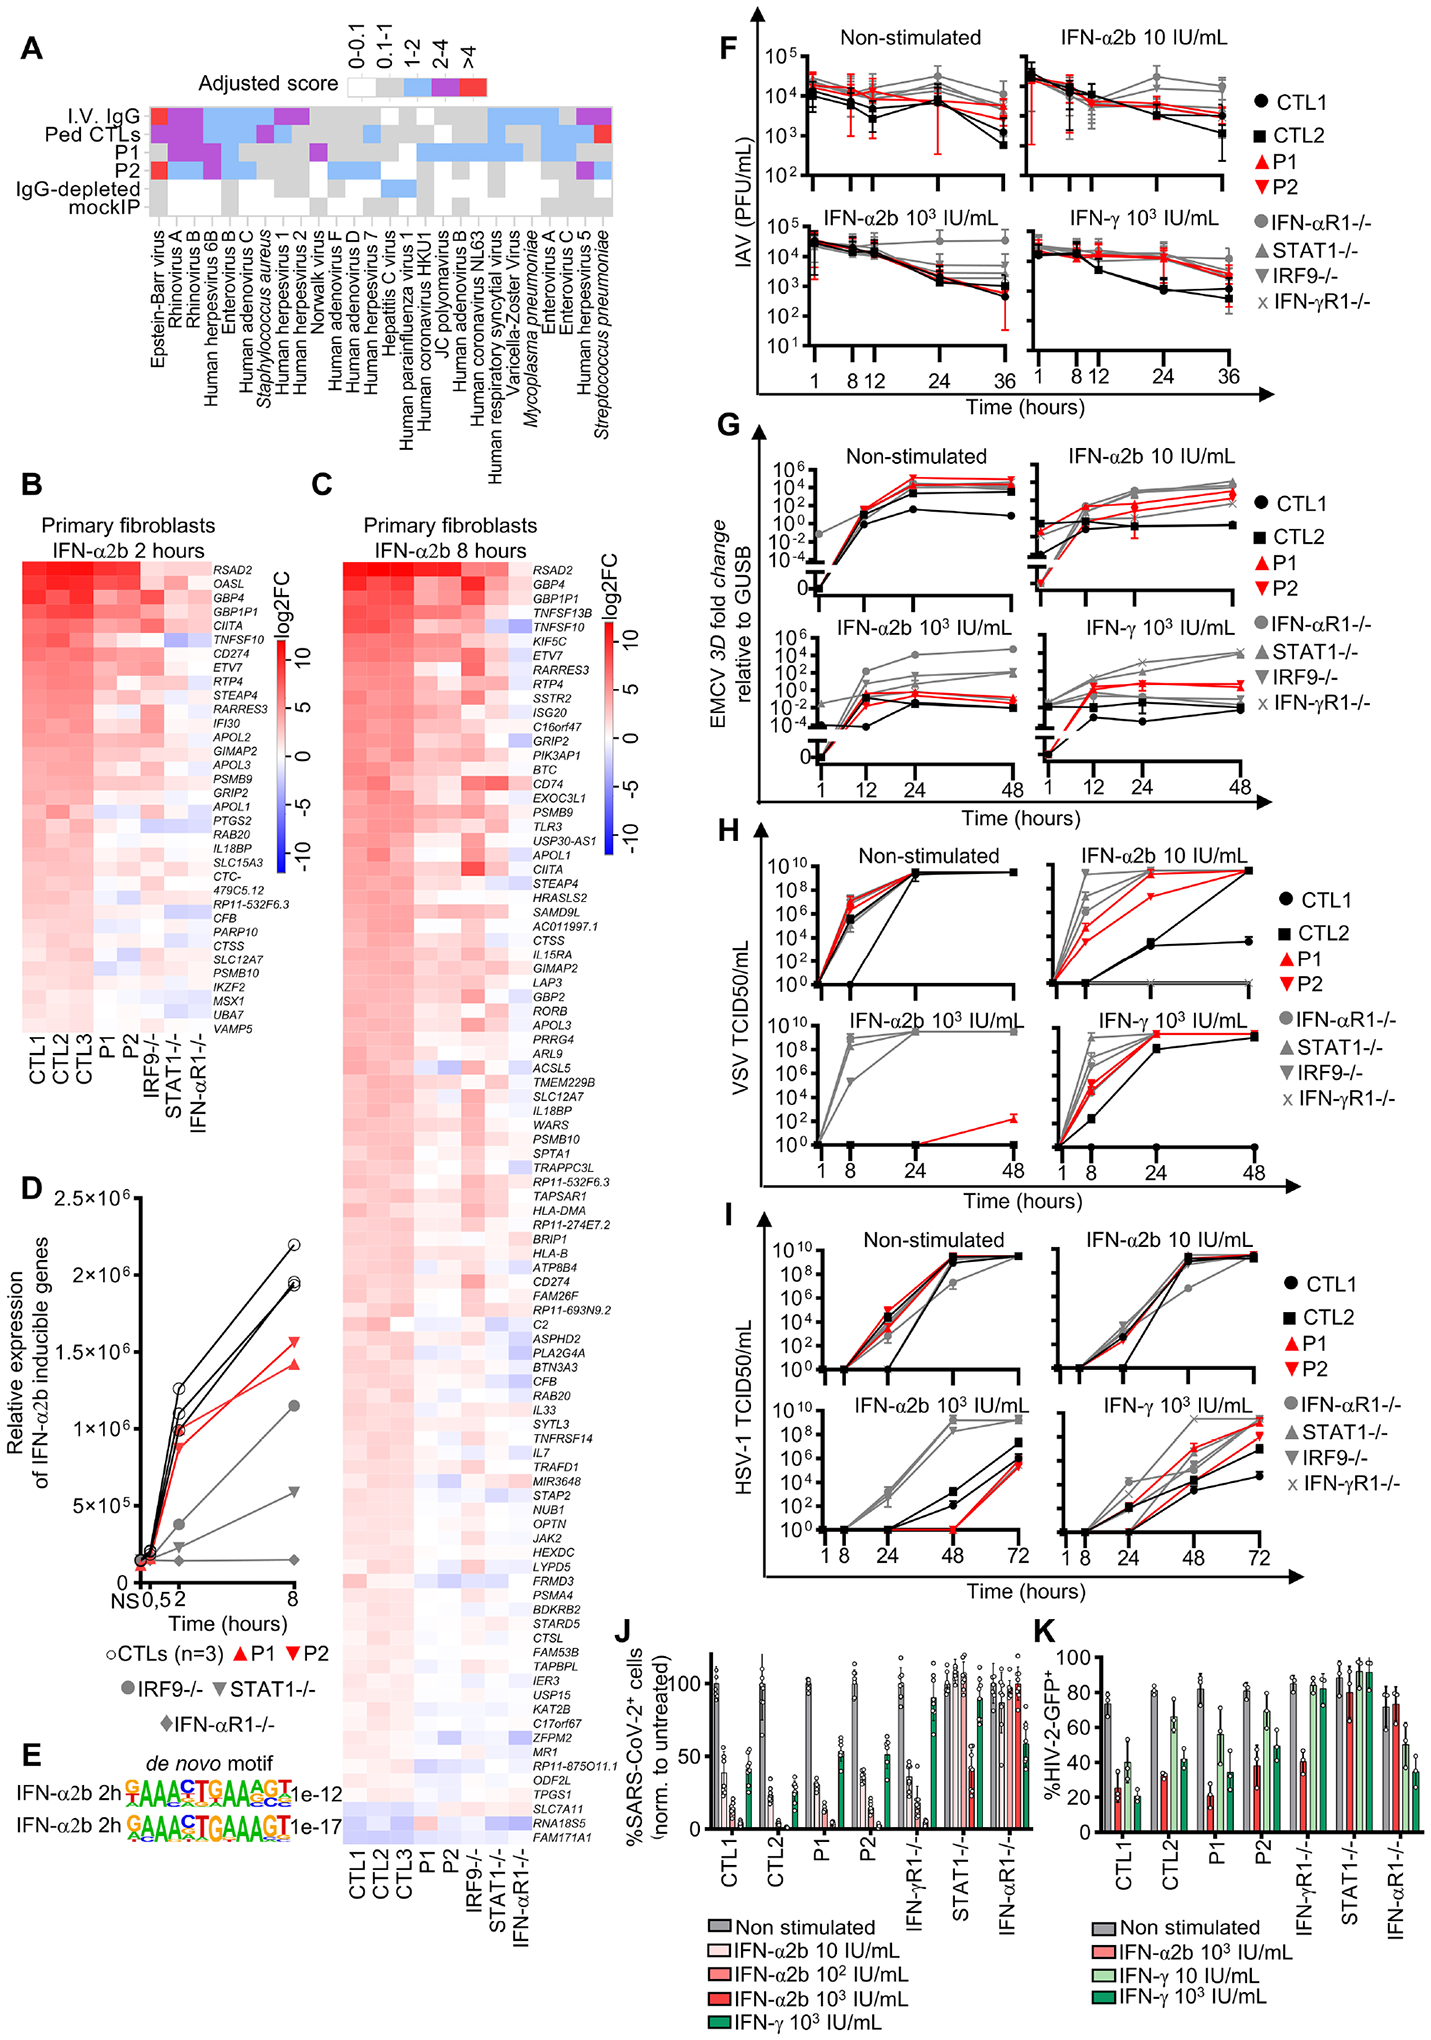
Inborn errors of human IFN-γ-dependent macrophagic immunity underlie mycobacterial diseases, whereas inborn errors of IFN-α/β-dependent intrinsic immunity underlie viral diseases. Both types of IFNs induce the transcription factor IRF1. We describe unrelated children with inherited complete IRF1 deficiency and early-onset, multiple, life-threatening diseases caused by weakly virulent mycobacteria and related intramacrophagic pathogens. These children have no history of severe viral disease, despite exposure to many viruses, including SARS-CoV-2, which is life-threatening in individuals with impaired IFN-α/β immunity. In leukocytes or fibroblasts stimulated in vitro, IRF1-dependent responses to IFN-γ are, both quantitatively and qualitatively, much stronger than those to IFN-α/β. Moreover, IRF1-deficient mononuclear phagocytes do not control mycobacteria and related pathogens normally when stimulated with IFN-γ. By contrast, IFN-α/β-dependent intrinsic immunity to nine viruses, including SARS-CoV-2, is almost normal in IRF1-deficient fibroblasts. Human IRF1 is essential for IFN-γ-dependent macrophagic immunity to mycobacteria, but largely redundant for IFN-α/β-dependent antiviral immunity.

Keywords: IRF1; Mycobacterium; inborn errors of immunity; interferon-stimulated gene; interferon-γ; macrophages; viruses.


Conflict of interest statement

Declaration of interests J.-L.C. serves on the scientific advisory boards of ADMA Biologics Inc., Kymera Therapeutics, and Elixiron Immunotherapeutics.

Figures

Figure 1 –
Figure 1 –. Homozygous complete loss-of-function IRF1 variant in patients with severe MSMD.
(A) Pedigrees of the two consanguineous kindreds. M=mutated; WT= wild-type; (B) Chest CT scan (P1) showing pulmonary infection. (C) Hematoxylin and eosin staining of a lymph node (P1) during M. avium and H. capsulatum infections, showing a multinucleated giant cell. (D) Chest X ray for P2 showing pulmonary M. avium infection. (E) Hematoxylin-eosin-saffron stain of a lung biopsy (P2) showing a giant cell engulfing another cell by phagocytosis (arrow). (F) WES analysis of P1 and P2. (G) IRF1 protein with the DNA-binding domain (DBD), nuclear localization sequence (NLS), and IRF-associated domain type 2 in blue (IAD2). Ho = homodimerization domain; He = heterodimerization domain. (H) Electropherograms of representative IRF1 nucleotide sequences. (I) CADD score vs. minor allele frequency (MAF) for the heterozygous state in gnomAD for variants IRF1 (left), and (right) for a homozygous variant from BRAVO/TOPmed (p.A67P), and the variants present in patients. Missense variants are indicated by blue circles and predicted loss-of-function variants are indicated by red triangles. (J) Western blotof total lysate from HEK293T cells with and without transfection with various C-DDK-tagged IRF1 cDNAs or with empty vector (EV). NT = not transfected. Representative data from two independent experiments. (K) EMSA on nuclear extract of HEK293T cells transfected with EV, WT or mutant IRF1 cDNAs, incubated with an ISRE probe. Representative data from two independent experiments. (L) Dual luciferase ISRE3 reporter activity of HEK293T cells transfected with EV or mutant IRF1 cDNAs. Data from 3–7 independent experiments performed in triplicate. Bars represent the mean and standard deviation (SD). Statistical analysis by Student’s t-test. ns = not significant, p > 0.05; ****p < 0.0001.
Figure 2 –
Figure 2 –. IRF1 mRNA and protein levels in cells from the two patients.
Quantitative PCR for IRF1 normalized against GUSB and the mean value for controls (CTLs) for cDNA from (A) primary fibroblasts, (B) SV40-fibroblasts, (C) EBV-B cells, (D) iPSC-derived macrophages (iPSC-MΦ cells;), (E) HSV-T cells, (F) Monocytes-derived macrophages (MDMs), and (G) T-cell blasts. Bars represent the mean and SD. Western blot for indicated protein in total lysate from (H) SV40-fibroblasts, (I) EBV-B cells, or (J) iPSC-derived MΦ, with and without IFN-γ stimulation. Data from 2–3 independent experiments are shown. (K) IRF1 staining and intracellular flow cytometry on SV40-fibroblasts with and without IFN-γ stimulation. (L) Flow cytometry with intracellular IRF1 staining on SV40-fibroblasts retrotransduced with an empty vector (EV) or WT) -IRF1 cDNA. The data shown are representative of 2–3 independent experiments. Statistical analysis by Mann-Whitney tests. ns = not significant, p > 0.05; *p < 0.05; **p < 0.01; ****p < 0.0001.
Figure 3 –
Figure 3 –. Phenotyping of peripheral blood leukocytes and single-cell PBMCs from IRF1-deficient patients.
(A) Monitoring of lymphoid cell numbers in the whole blood or PBMCs of patients. (B) Counts for monocyte subsets by mass cytometry on fresh whole-blood cells. (C) Counts of myeloid and lymphoid subsets in fresh whole blood. (D) UMAP clustering for CTLs and samples from the IRF1-deficient patients (2x P1 and 1x P2) profiled by scRNA-seq or CITE-seq. General lineage populations are annotated. (E) Subclustering of T and NK cells to define cell subtypes. Overlay of 10,000 PBMCs from CTLs (gray) and 10,000 PBMCs from an IRF1-deficient patient (red) (F) As in (E), B-cell subclustering and cell-type annotation, together with an overlay of the patients’ and CTLs cells. (G) Proportions of each cell type expressed as a percentage of total lymphocytes. P1.1 corresponds to the first scRNA-seq analysis for P1 and P1.2 corresponds to the CITE-seq performed later on. (H) Module score analysis comparing the expression of genes with IRF1-binding sites within 10 kb of their TSS (top panel), and genes differentially expressed between patients and controls and predicted to have ISRE motifs in their promoters (bottom panel). Cohen’s d effect size estimates are shown for every significant variation of module expression. They were obtained by comparing the module score distribution in every cell subset in Wilcoxon signed-rank tests (q-value <= 0.05).
Figure 4 –
Figure 4 –. Production of IFN-γ by the lymphoid cells of IRF1-deficient patients.
(A) Induction of IFN-γ secretion in a whole-blood assay, for controls (CTLs), IL-12Rβ1-deficient patients and patients. Bars represent the mean. (B) Intracellular flow cytometry on IFN-γ+ PBMCs after stimulation with IL-12, IL-23, or BCG. Bars represent the mean. Technical duplicates of the same experiment are shown for P1 and P2. (C) UMAP analysis of intracellular T-bet and IFN-γ expression by intracellular spectral flow cytometry across various PBMC subsets. Lymphoid subsets based on surface marker expression (upper panel), and their levels of IFN-γ and T-bet expression (lower panel). (D) Cytokine levels in the supernatant of naïve CD4+ T cells in polarizing conditions.
Figure 5 –
Figure 5 –. Response to IFN-γ of IRF1-deficient fibroblasts.
(A) HOMER de novo motif analysis of the genes differentially expressed in the primary fibroblasts after IFN-γ stimulation. (B) RT-qPCR for GBP4 (normalized against GUSB) in SV40-fibroblasts with or without retrotransduction with EV or WT IRF1 cDNA and with or without stimulation IFN-γ. Data from 2–6 independent experiments are shown. Bars represent the mean and SD. (C) Immunoblots in SV40-fibroblasts with and without stimulation with IFN-γ. (D) Mass spectrometry on lysates of primary fibroblasts with and without IFN-γ stimulation. On the right, heatmaps for proteins (i) positively induced after stimulation with a log2FC>1 over the mean in the non-stimulated state for controls (ii) and a log2FC<0.5 over the mean in the non-stimulated state for patients. On the left, 10th-90th percentiles for all proteins positively induced after stimulation with a log2FC>1 over the mean value in the non-stimulated state for controls.
Figure 6 –
Figure 6 –. IFN-γ immunity in IRF1-deficient macrophages.
(A) Heatmaps showing genes differentially expressed (|log2(FC)| > 1 and adj. p-value < 0.05) in CTL cells after 8 hours of stimulation with 103 IU/mL IFN-γ, and differentially expressed in iPSC-MΦ (P1) and MDMs (P2) (|log2(FC)| > 1 and adj. p-value < 0.05). (B) HOMER de novo motif analysis of the genes differentially expressed in the iPSC-MΦ (P1), and in MDMs (P2); after IFN-γ stimulation. (C) Western blot of protein extracts in iPSC-MΦ, and MDMs, with and without stimulation with IFN-γ. (D) Extracellular H2O2 release for MDMs from CTLs and P2 (technical duplicates ± SD). (E) HLA-DR expression by flow cytometry, using THP1-Ф with and without IFN-γ stimulation. (F) Gentamicin protection assay performed on PMA-differentiated THP1-Ф with and without IFN-γ pretreatment and Salmonella Typhimurium-GFP (Stm-GFP) infection. Results are expressed as the proportion of Salmonella Typhimuriumhigh on Salmonella Typhi+. Representative results from 2–3 independent experiments. (G) CFU assays on PMA-differenciated THP1-Ф with and without IFN-γ pretreatment, following infection by Mycobacterium abscessus. All replicates from n=3 independent experiments are displayed. (H) Flow cytometry analyses on MDMs with and without IFN-γ pretreatment, following infection for 24 hours with M. abscessus-tdTomato.
Figure 7 –
Figure 7 –. IFN-α and IFN-γ-driven antiviral immunity in the cells of IRF1-deficient patients.
(A) Antiviral antibody responses to species for which at least one sample tested seropositive by PhIP-Seq. “IVIG” correspond to the mean response for samples from pooled patients on IVIGs and “pediatric CTLs” to pediatric controls. A hierarchical clustering of samples based on antiviral antibody levels is shown at the top. Heatmap showing genes differentially expressed (|log2(FC)| > 1 and adj. p-value < 0.05) in CTL cells after 2 hours (B) or 8 hours (C) of IFN-α2b stimulation, and differentially expressed in primary fibroblasts from P1 (|log2(FC)| > 1 and adj. p-value < 0.05) relative to CTLs. Genes differentially expressed in P1 and P2 relative to the control group at 2 and 8 hours from among those differentially expressed at both timepoints relative to non-stimulated fibroblasts in the control group, i.e., with a |log2(FC)| > 1 and adj. p-value < 0.05 after Benjamini-Hochberg correction in controls, and with a |log2(FC)| > 1 and adj. p-value < 0.05 after correction in patients relative to controls. (D) RNA-sequencing of IFN-α2b-inducible genes (logFC>2 in controls) in primary fibroblasts with and without IFN-α2b stimulation. (E) HOMER de novo motif analysis of genes differentially expressed in primary fibroblasts with IFN-α2b stimulation. (F) Influenza A virus (IAV), (G) encephalomyocarditis virus (EMCV), (H) vesicular stomatitis Indiana virus (VSV), (I) HSV-1, (J) SARS-CoV-2, and (K) HIV-2 infection of SV40-fibroblasts after pretreatment with IFN-α2b or IFN-γ. All viral infections were performed in 2–3 independent experiments.

References

    1. Casanova J-L, and Abel L (2021). Lethal Infectious Diseases as Inborn Errors of Immunity: Toward a Synthesis of the Germ and Genetic Theories. Annu. Rev. Pathol 16, 23–50. 10.1146/annurev-pathol-031920-101429. - DOI - PMC - PubMed
    1. Casanova J-L, and Abel L (2021). Mechanisms of viral inflammation and disease in humans. Science 374, 1080–1086. 10.1126/science.abj7965. - DOI - PMC - PubMed
    1. Zhang Q, Bastard P, COVID Human Genetic Effort, Cobat A, and Casanova J-L (2022). Human genetic and immunological determinants of critical COVID-19 pneumonia. Nature 10.1038/s41586-022-04447-0. - DOI - PMC - PubMed
    1. Bustamante J (2020). Mendelian susceptibility to mycobacterial disease: recent discoveries. Hum. Genet 139, 993–1000. 10.1007/s00439-020-02120-y. - DOI - PMC - PubMed
    1. Kerner G, Rosain J, Guerin A, Al-Khabaz A, Oleaga-Quintas C, Rapaport F, Massaad MJ, Ding JY, Khan T, Ali FA, et al. (2020). Inherited human IFN-gamma deficiency underlies mycobacterial disease. J. Clin. Invest 130, 3158–3171. 10.1172/JCI135460. - DOI - PMC - PubMed

Publication types