. 2023 Feb 14;56(2):353-368.e6.
doi: 10.1016/j.immuni.2023.01.007. Epub 2023 Feb 2.

Ambient oxygen levels regulate intestinal dysbiosis and GVHD severity after allogeneic stem cell transplantation

Affiliations

Ambient oxygen levels regulate intestinal dysbiosis and GVHD severity after allogeneic stem cell transplantation

Keisuke Seike et al. Immunity. .

Abstract

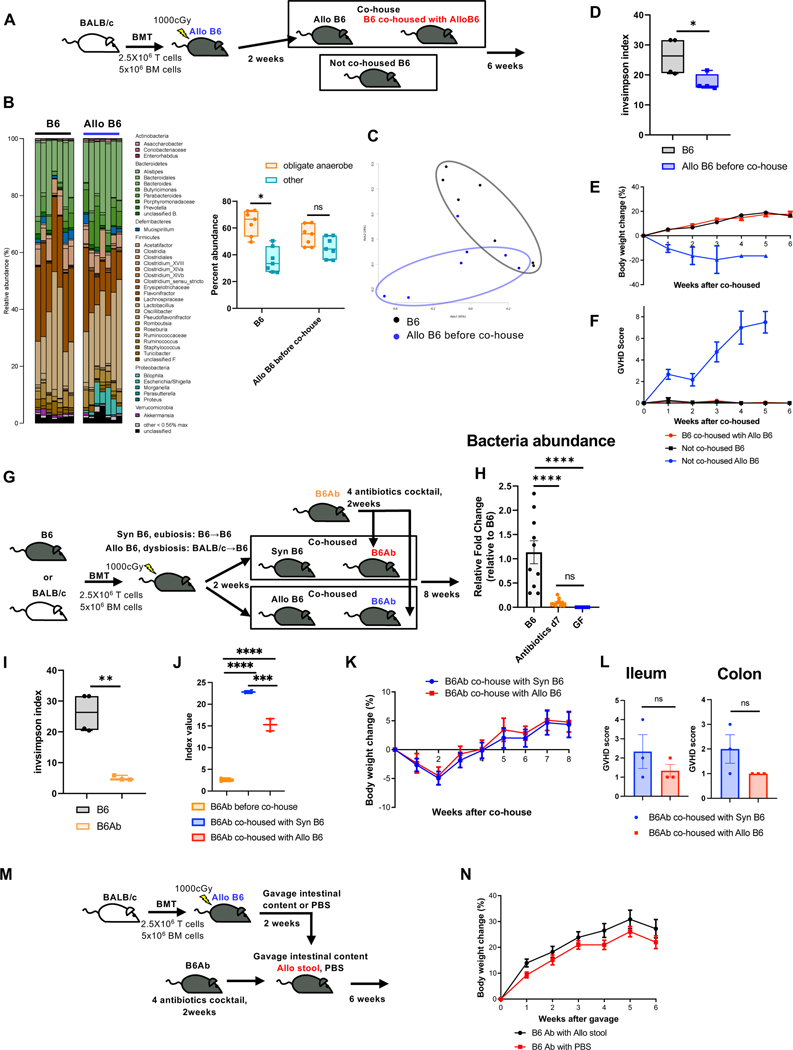
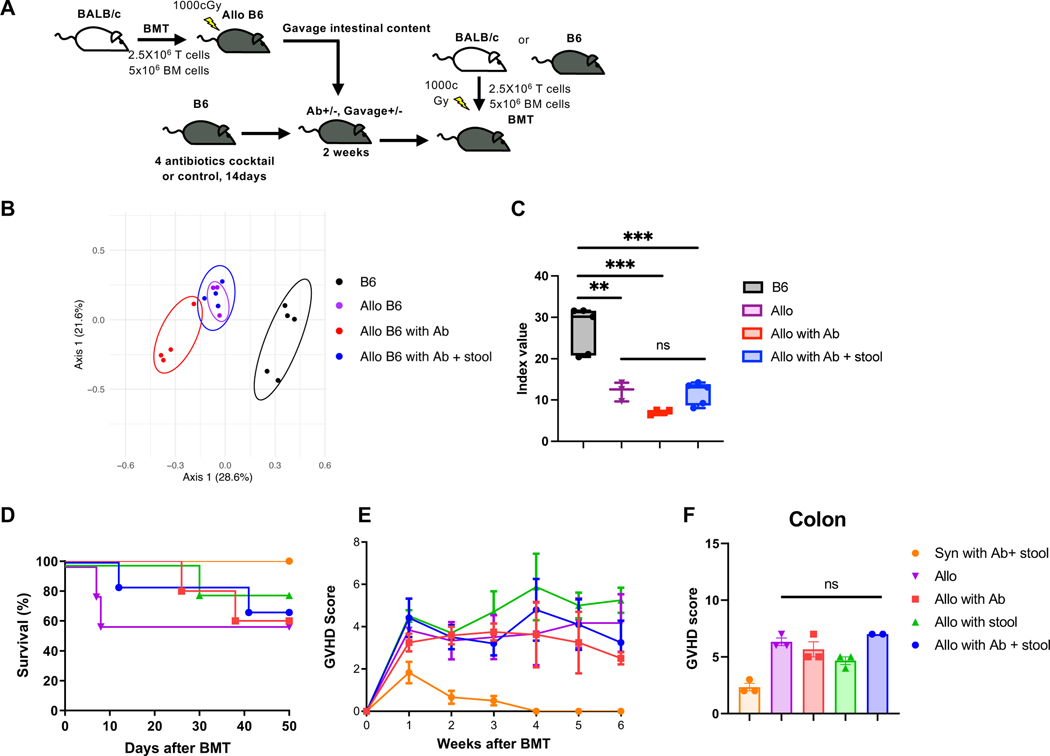
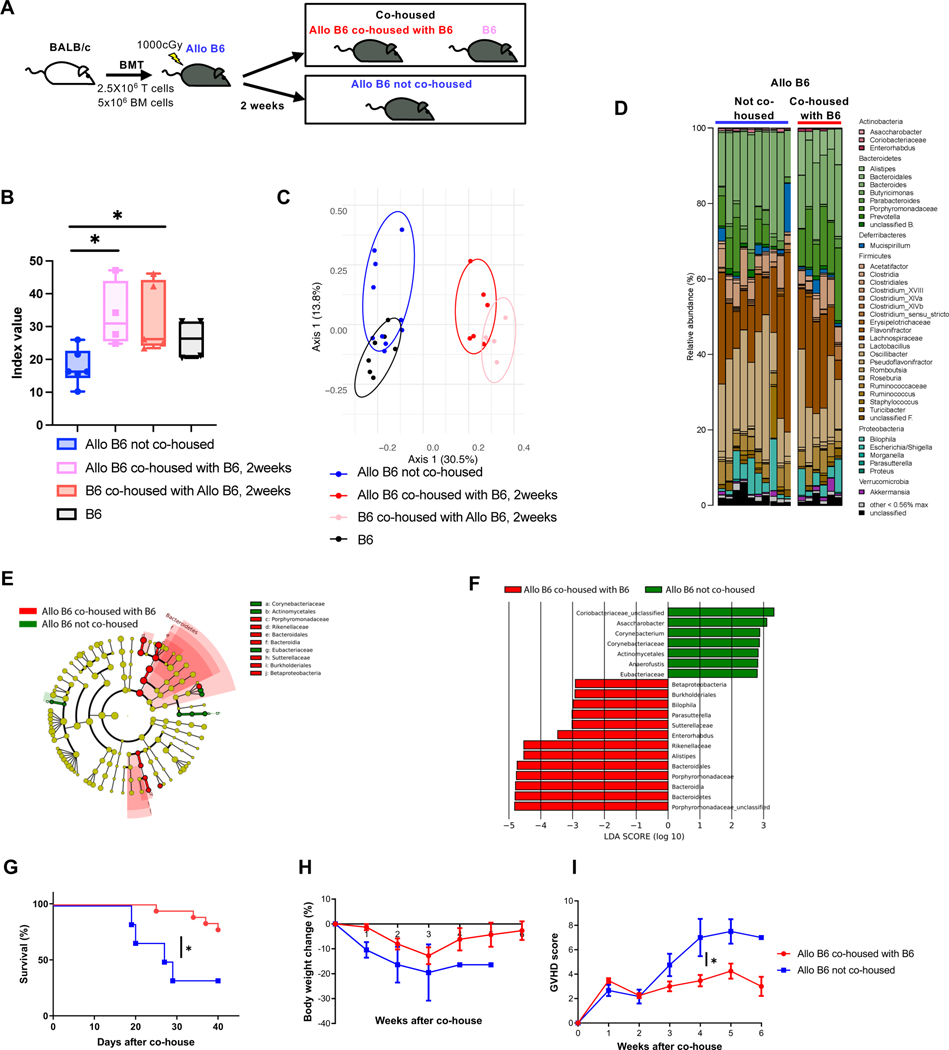
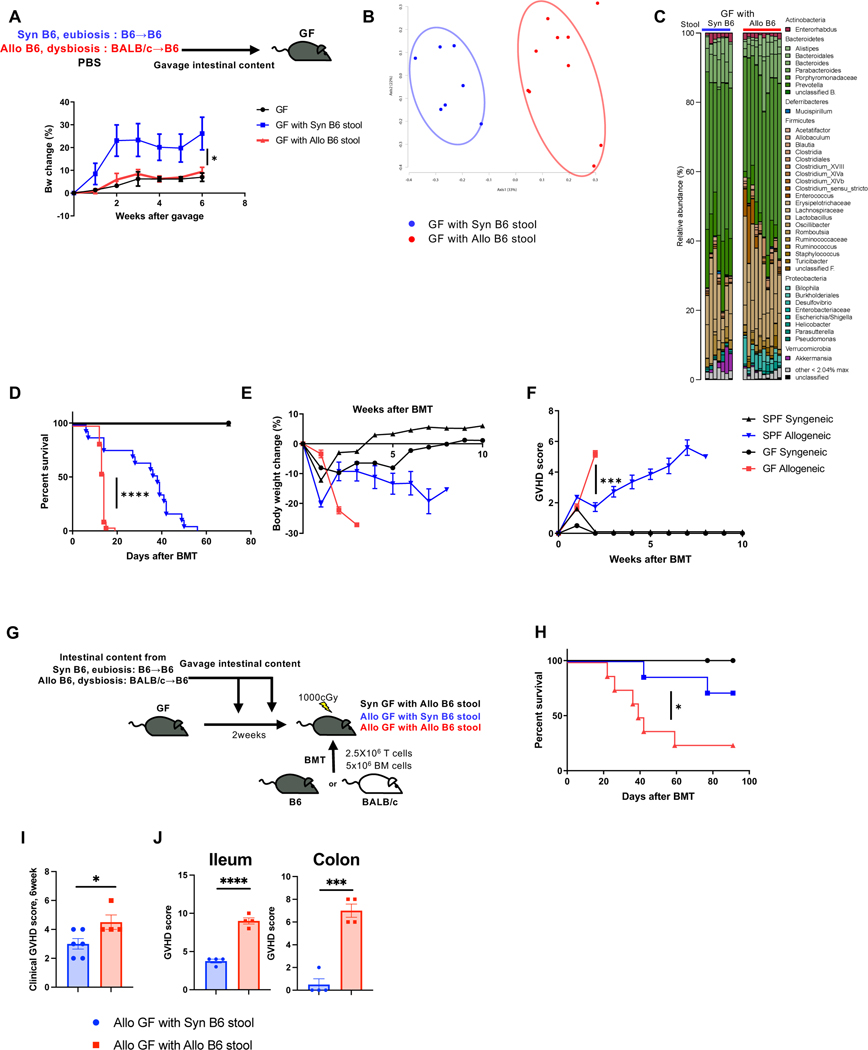
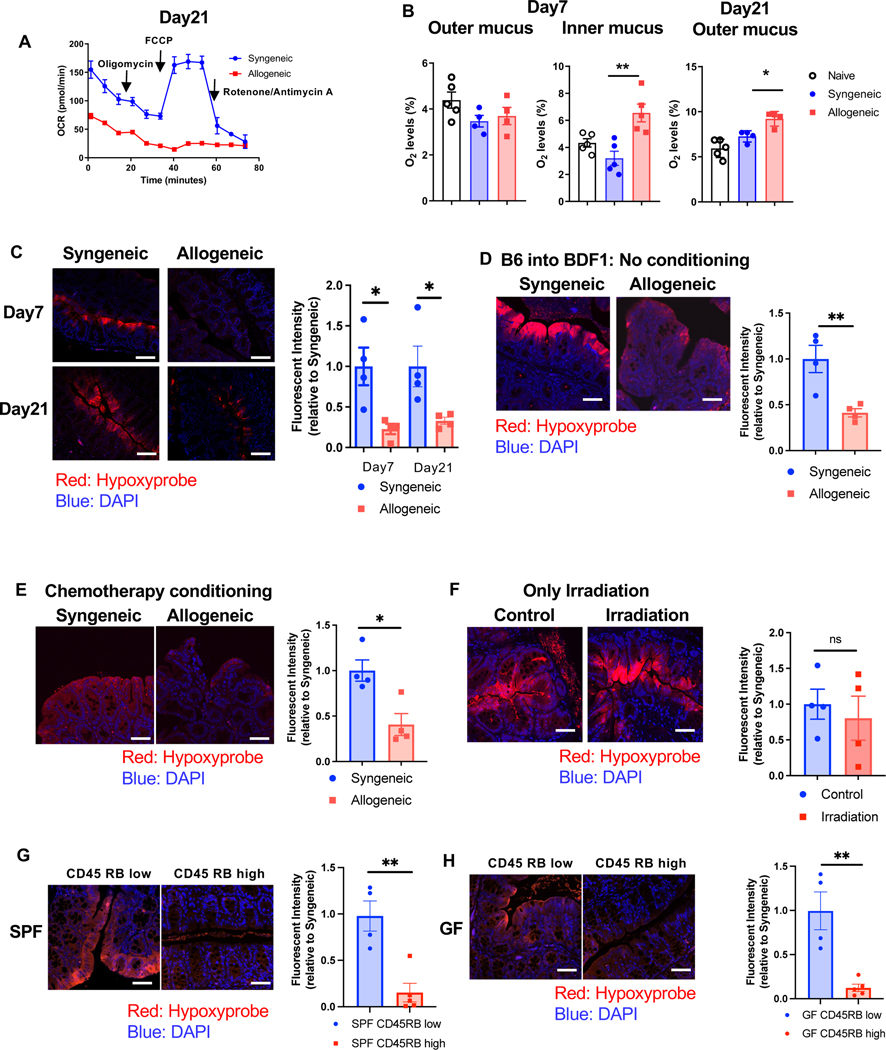
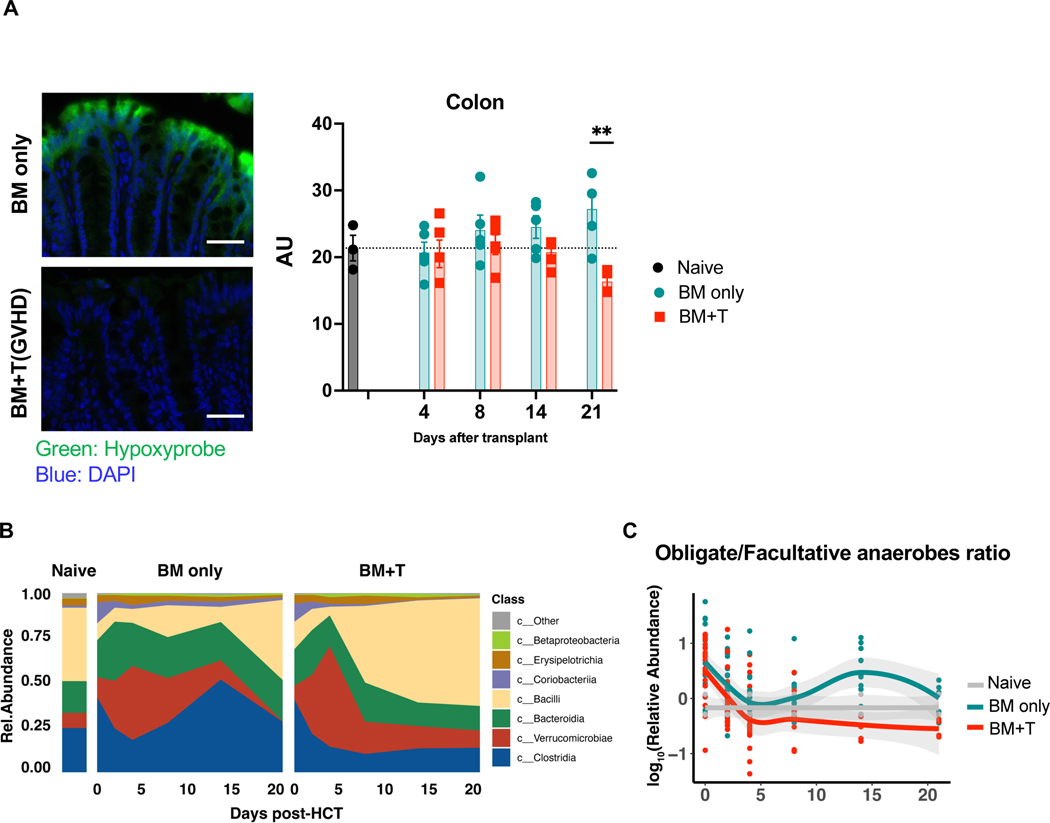
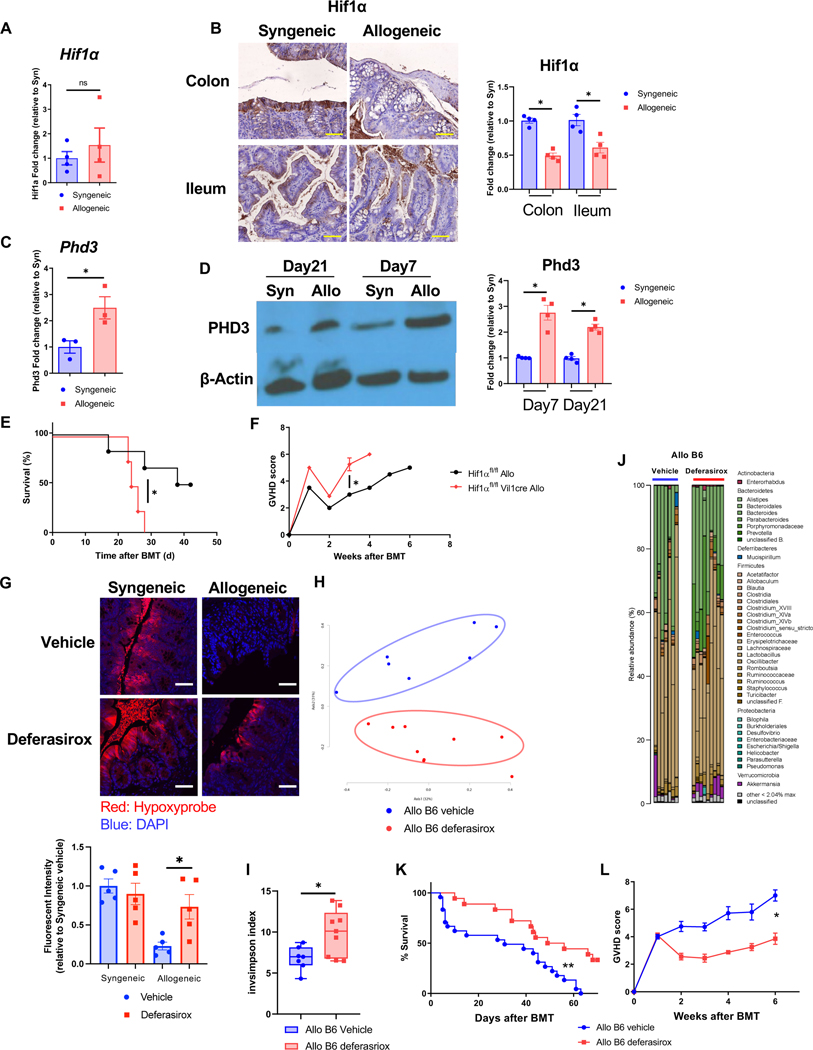
The severity of T cell-mediated gastrointestinal (GI) diseases such as graft-versus-host disease (GVHD) and inflammatory bowel diseases correlates with a decrease in the diversity of the host gut microbiome composition characterized by loss of obligate anaerobic commensals. The mechanisms underpinning these changes in the microbial structure remain unknown. Here, we show in multiple specific pathogen-free (SPF), gnotobiotic, and germ-free murine models of GI GVHD that the initiation of the intestinal damage by the pathogenic T cells altered ambient oxygen levels in the GI tract and caused dysbiosis. The change in oxygen levels contributed to the severity of intestinal pathology in a host intestinal HIF-1α- and a microbiome-dependent manner. Regulation of intestinal ambient oxygen levels with oral iron chelation mitigated dysbiosis and reduced the severity of the GI GVHD. Thus, targeting ambient intestinal oxygen levels may represent a novel, non-immunosuppressive strategy to mitigate T cell-driven intestinal diseases.

Keywords: T cell-mediated gastrointestinal (GI) diseases; allogeneic; germ-free; graft-versus-host host disease; hypoxia; iron chelation; microbiome; oxygen; tissue tolerance; transplantation.


Conflict of interest statement

Declaration of interests The authors declare no competing interests.

Figures

Figure 1.
Figure 1.. Allogeneic dysbiosis is not pathogenic to naïve animals.
(A to F), naïve C57BL/6 mice (B6) 7–8 weeks old were co-housed with allogeneic recipient mice (Allo B6) two weeks after post-transplant. Mice were co-housed in a ratio of 1:1 naïve mice to BMT mice respectively (A). Data are from 3 independent experiments (N=9). Stool from from Allo B6 before co-house or B6 were analyzed by 16S rRNA gene sequencing. (B to D) Microbiome composition (left) with the percent abundance of obligate anaerobes and other bacteria (right) (B), PCoA (C), and inverse Simpson alpha diversity index of microbiome (D) in stool were shown. (E and F) The body weigh change (H) and the clinical GVHD score (F) of B6 co-housed with Allo B6, not co-housed B6, and not co-housed Allo B6 are shown (co-housed with Allo B6 and not co-housed B6: N=9, not co-housed Allo B6; N=6). (G to L) B6 mice 6–8 weeks old were treated with 2 weeks of 4 antibiotics cocktail (ampicillin 1gr/L, kanamycin 1gr/L, metronidazole 1gr/L and vancomycin 0.5gr/L plus 3% stevia) in filtered double distillated drinking water. Antibiotics treated mice (B6Ab) were co-housed in ratio of 1:1 antibiotic treated mice to BMT mice respectively (G). Data are from 3 independent experiments. (H) Stool from B6Ab, B6 and Germ free (GF) mice were analyzed by qPCR. Relative quantification of bacteria in stool from B6, antibiotics treated B6 at day7, and GF mice were analyzed (B6: N=10, Antibiotics d7: N=10, GF: N=8). (I) Inverse Simpson alpha diversity index of microbiome of B6 and B6Ab are shown (B6N: N=4, B6Ab, N=3). (J) Inverse Simpson alpha diversity index of microbiome of B6Ab, B6Ab co-housed with Syn or Allo B6 at day14 after co-house were shown (B6Ab N=4, B6Ab co-housed with Syn or Allo B6 N=2). (K) The body weight changes of co-housed B6Ab mice are shown (Co-housed with Syn: N=14, Co-housed with Allo: N=15). (L) Ileal and colonic histopathological GVHD score of co-housed B6Ab mice are shown (N=3). (M and N) B6 mice were treated for 2 weeks with 4 antibiotics cocktail (ampicillin 1 mg/ml, neomycin 1mg/ml, metronidazole 1mg/ml and vancomycin 0.5mg/ml) in filtered double distillated drinking water, followed by 10 doses of intestinal content gavage from BMT recipient mice 2weeks after BMT. Each gavage day one BMT mouse whole gut content was collected. Stool solution was gavaged to each recipient mouse (M). Data are from 3 independent experiments (B6Ab with Allo stool: N=15, B6Ab with PBS: N=8). (N) The body weight change of gavaged B6Ab mice are shown. The horizontal line in box (B, D, I, J) represents the median with the box bounding the interquartile range. The ends of the whisker lines represent the minimum and maximum values. Two-tailed paired Wilcoxon test (B) and Two-tailed unpaired t-test (D, I, L), and one-way ANOVA analysis with Tukey post hoc test (H, J) were used to determine significance (mean ± s.e.m.). *P < 0.05, **P < 0.01, ***P < 0.001, ****P < 0.0001. See also Figure S1 and S2.
Figure 2.
Figure 2.. Pre-transplant dysbiosis or eubiosis does not have significant impact on GVHD.
(A) B6 mice were treated for 2 weeks with 4 antibiotics cocktail (Fig.1G) or PBS, followed by gavaged Allo B6 intestinal content or PBS. After antibiotics treatment and intestinal content gavage, mice received BMT. (B and C) Stool from BMT recipients and B6 mice were analyzed by 16S rRNA gene sequencing. PCoA (B) and inverse Simpson alpha diversity index of microbiome (C) are shown. (B6 N=5, Allo N=3, Allo with Ab N=4, Allo with Ab + stool N=4). Survival rate (D), clinical GVHD score (E), and pathological GVHD score of colon (F) are shown. (D) Allo: N=3, Allo with Ab: N=4, Allo with Ab+stool: N=4, B6: N=5. (E) Syn with Ab+stool: N=6, Allo: N=5, Allo with Ab: N=5, Allo with stool: N=5, Allo with Ab+stool: N=6. (F) Syn with Ab+stool: N=3, Allo: N=3, Allo with Ab: N=3, Allo with stool: N=3, Allo with Ab+stool: N=2. Two independent experiments were performed. One-way ANOVA analysis with Tukey post hoc test (C) and one-way ANOVA analysis with Dunn`s post hoc test (F) was used to determine significance (mean ± s.e.m.). **P < 0.01, ***P < 0.001. See also Figure S3.
Figure 3.
Figure 3.. Post-transplant eubiosis ameliorates the severity of GVHD.
Allo B6 were co-housed with B6 at ratio of Allo B6: B6 = 1:1 from day 14 after BMT (A). Data are from three independent experiments. (B-F) Stool from Allo B6 co-housed with B6 for 2weeks, B6 co-housed with Allo B6 for 2weeks, Allo B6 not co-housed, and B6 were analyzed by 16S rRNA gene sequencing. (B) Inverse Simpson alpha diversity index were shown. (Allo B6 not co-housed: N=6, Allo B6 co-housed with B6: N=4, B6 co-housed with Allo B6: N=5, B6: N=4). (C) PCoA were shown (Allo B6 not co-housed: N=9, Allo B6 co-housed with B6: N=6, B6 co-housed with Allo B6: N=5, B6: N=7). Microbiome composition (D) and taxa differentially abundant by LEfSe analysis (E & F) are shown. Survival rate (G), body weight change (H), and clinical GVHD score (I) of BMT recipients were shown. (Allo B6 were co-housed with B6: N=18, Allo B6 not co-housed: N=6). The horizontal line in box (B) represents the median with the box bounding the interquartile range. The ends of the whisker lines represent the minimum and maximum values. One-way ANOVA analysis with Tukey post hoc test (B), log-rank test (G), and two-tailed Mann-Whitney test (I) was used to determine (mean ± s.e.m.). *P < 0.05.
Figure 4.
Figure 4.. GF mice transplanted with healthy microbiome showed reduced GVHD
(A to C) Germ free B6 (GF) mice were gavaged intestinal content from Syn and Allo BMT recipient mice. (A) Body weight change is shown (GF: N=2, GF with Syn B6 stool: N=4, GF with Allo B6 stool: N=5). Stool from GF with Syn or Allo B6 stool 4weeks after stool gavage analyzed by 16S rRNA gene sequencing. PCoA (B) and microbiome composition (C) are shown (GF with Syn B6 stool: N=7, GF with Allo B6 stool: N=10). (D to F) SPF B6 and GF B6 mice received BMT from B6 or BALB/c donor. Survival rate (D), body weight change (E), and clinical GVHD score (F) are shown (GF Syngeneic: N=2, GF Allogeneic: N=18, SPF Syngeneic: N=2, SPF Allogeneic: N=17). (G to J) GF B6 mice received BMT from B6 or BALB/c donor. Then GF mice were gavaged intestinal content from SPF Syn and SPF Allo BMT recipient mice (G). Survival rate (H) and clinical GVHD score 6 weeks after BMT (I) are shown (Allo GF with Syn B6 stool N=6, Allo GF with Allo B6 stool N=4). (J) Ileum and colonic histopathological score at day7 after BMT are shown (n=4). Two-tailed unpaired t-test (A, I, J), log-rank test (D, H), and two-tailed Mann-Whitney test (F) was used to determine (mean ± s.e.m.). *P < 0.05, ***P<0.001, ****P<0.0001. See also Figure S4.
Figure 5.
Figure 5.. The defect in O2 utilization in IECs leading to a loss of intestinal luminal and cellular physiological hypoxia.
(A) Representative bio-energetic profiles of isolated colonic IECs from syngeneic and allogeneic mice (BALB/c→B6) under basal conditions and following treatment with mitochondrial inhibitors (oligomycin, FCCP, rotenone/antimycin A) by Seahorse analyzer. Oxygen consumption rate (OCR) of day21 after BMT is shown (N=4). Four independent experiments were performed. (B) Quantification of O2 levels in intestine from recipients 7days and 21days after BMT (BALB/c→B6). Naive: N=5, Syngeneic: N=4 (Day7 outer and Day21 outer), N=5(Day7 inner), Allogeneic: N=4 (Day7 outer and Day21 outer), N=5 (Day7 inner). (C) B6 received BMT from B6 or BALB/c donor. Representative images of Hypoxyprobe staining and relative fluorescent intensity in colon from recipients 21days after BMT (scale bar= 50μm). (D) Unirradiated B6D2F1 mice received 10 × 107 splenocytes from syngeneic B6D2F1 or allogeneic B6 donors. Representative images of Hypoxyprobe staining and relative fluorescent intensity in colon from recipients at 21days after BMT (scale bar= 50μm) (N=4). (E) B6 mice received chemotherapy and received 1x10⁷ T cells along with 1x10⁷ TCD-BM cells from either syngeneic B6 or allogeneic BALB/c donors. Representative images of Hypoxyprobe staining and relative fluorescent intensity in colon from recipients 21days after BMT (scale bar= 50μm) (N=4). (F) B6 mice received 10 Gy total body irradiation without T-cell and BM cells. Representative images of Hypoxyprobe staining relative fluorescent intensity in colon from recipients 7days after BMT (scale bar= 50μm) (N=4). (G and H) CD4++CD25-CD4+4-CD4+5RBhi (CD4+5RB high) T cells or CD4++CD25-CD4+4-CD4+5RBlow (CD4+5RB low) T cells from B6 mice were transferred to Rag1-/- SPF (G) or Rag1-/- GF mice (H). Hypoxyprobe staining and relative fluorescent intensity in colon from recipients 8weeks after T cell transferring (scale bar= 50μm) (SPF: N=4, GF CD4+5RB low: N=4, GF CD4+5RB high N=5). (C to H) At least, four independent experiments were performed. One-way ANOVA analysis with Tukey post hoc test (B) and two-tailed unpaired t-test (C to H) was used to determine significance (mean ± s.e.m.). *P < 0.05, **P < 0.01. See also Figure S5.
Figure 6.
Figure 6.. Loss of hypoxia in colon and dysbiosis are induced by GVHD with independent of the different institution and microbiome.
Lethally irradiated (1000cGy) 129 mice received bone marrow (5x10⁶ cells) and purified CD5+T cells (2x10⁶ cells) from C57BL/6J donors in different institution (Memorial Sloan Kettering Cancer Center). (A) Tissue hypoxia was determined with Pimonidazole (left, scale bar= 50μm). Quantification of intestinal O2 levels in intestine from recipients (right). Samples were collected 4, 8, 14, and 21days after BMT (Naïve: N=3, BM only: N=4, BM+T: day4, 8, 14 N=4, day21 N=3). (B) Stool microbial composition was determined by 16S rRNA gene sequencing. (C) The classification of obligate/facultative (O/F) anaerobe ratio was determined. Two-tailed unpaired t-test (A) was used to determine significance (mean ± s.e.m.). **P < 0.01.
Figure 7.
Figure 7.. O2 modulation after allo-HSCT improves intestinal physiologic hypoxia and GVHD.
(A to D) B6 received BMT from syngeneic B6 or allogeneic BALB/c donor. (A) Hif1α mRNA expression of isolated colonic IECs from BMT recipients 21days after BMT (N=4). (B) Representative image and the relative intensity of HIF1α immunohistochemical staining with intestinal tissue from BMT recipients 21days after BMT are shown (Scale bar=50μm, N=4). (C) Egln3 (Phd3) mRNA expression of isolated colonic IECs from BMT recipients on day21 after BMT (N=3). (D) Representative image of immunoblot and the relative protein density for PHD3 and β-Actin with colonic IECs from BMT recipients 21days after BMT are shown (N=4). (E and F) Hif1αfl/fl mice and Hif1αfl/fl Vil1cre mice received BMT from BALB/c donor. Survival rate (E) and clinical GVHD (F) score are shown (Hif1αfl/fl allogeneic: N=6, Hif1αfl/fl Vil1cre: N=4). (G to L) B6 received BMT from BALB/c donor mice. BMT recipients were orally treated with deferasirox (20mg/kg) and vehicle every day. (G) Hypoxyprobe staining and relative fluorescent intensity in colon from recipients 21days after BMT (scale bar= 50μm). Four independent experiments were performed. Stool from BMT recipients were analyzed by 16S rRNA gene sequencing. PCoA (H), inverse Simpson alpha diversity index of microbiome (I), and microbiome composition (J) in stool from recipients 21days after BMT were shown (Allo B6 vehicle: N=7, Allo B6 deferasirox: N=9). Survival rate (K) and clinical GVHD score (L) of BMT recipients (Allo B6 vehicle: N=24, Allo B6 deferasirox: N=10). Representative plots and a graph summarizing the results of at least two independent experiments are shown. Two-tailed unpaired t-test (A, C, G, I), two-tailed Mann-Whitney test (B, D, F, L), or log-rank test (E, K) (mean ± s.e.m.) were used to determine significance. *P < 0.05, **P<0.01. See also Figure S6.

References

    1. Litvak Y, Byndloss MX, and Baumler AJ. (2018). Colonocyte metabolism shapes the gut microbiota. Science 362. 10.1126/science.aat9076. - DOI - PMC - PubMed
    1. Byndloss MX, Pernitzsch SR, and Baumler AJ. (2018). Healthy hosts rule within: ecological forces shaping the gut microbiota. Mucosal Immunol 11, 1299–1305. 10.1038/s41385-018-0010-y. - DOI - PubMed
    1. Shono Y, Docampo MD, Peled JU, Perobelli SM, Velardi E, Tsai JJ, Slingerland AE, Smith OM, Young LF, Gupta J, et al. (2016). Increased GVHD-related mortality with broad-spectrum antibiotic use after allogeneic hematopoietic stem cell transplantation in human patients and mice. Sci Transl Med 8, 339ra371. 10.1126/scitranslmed.aaf2311. - DOI - PMC - PubMed
    1. Peled JU, Gomes ALC, Devlin SM, Littmann ER, Taur Y, Sung AD, Weber D, Hashimoto D, Slingerland AE, Slingerland JB, et al. (2020). Microbiota as Predictor of Mortality in Allogeneic Hematopoietic-Cell Transplantation. N Engl J Med 382, 822–834. 10.1056/NEJMoa1900623. - DOI - PMC - PubMed
    1. Caruso R, Lo BC, and Nunez G. (2020). Host-microbiota interactions in inflammatory bowel disease. Nat Rev Immunol 20, 411–426. 10.1038/s41577-019-0268-7. - DOI - PubMed

Publication types