. 2023 Feb 14;56(2):386-405.e10.
doi: 10.1016/j.immuni.2023.01.010. Epub 2023 Feb 2.

Tissue-specific abundance of interferon-gamma drives regulatory T cells to restrain DC1-mediated priming of cytotoxic T cells against lung cancer

Affiliations

Tissue-specific abundance of interferon-gamma drives regulatory T cells to restrain DC1-mediated priming of cytotoxic T cells against lung cancer

Maria Zagorulya et al. Immunity. .

Abstract

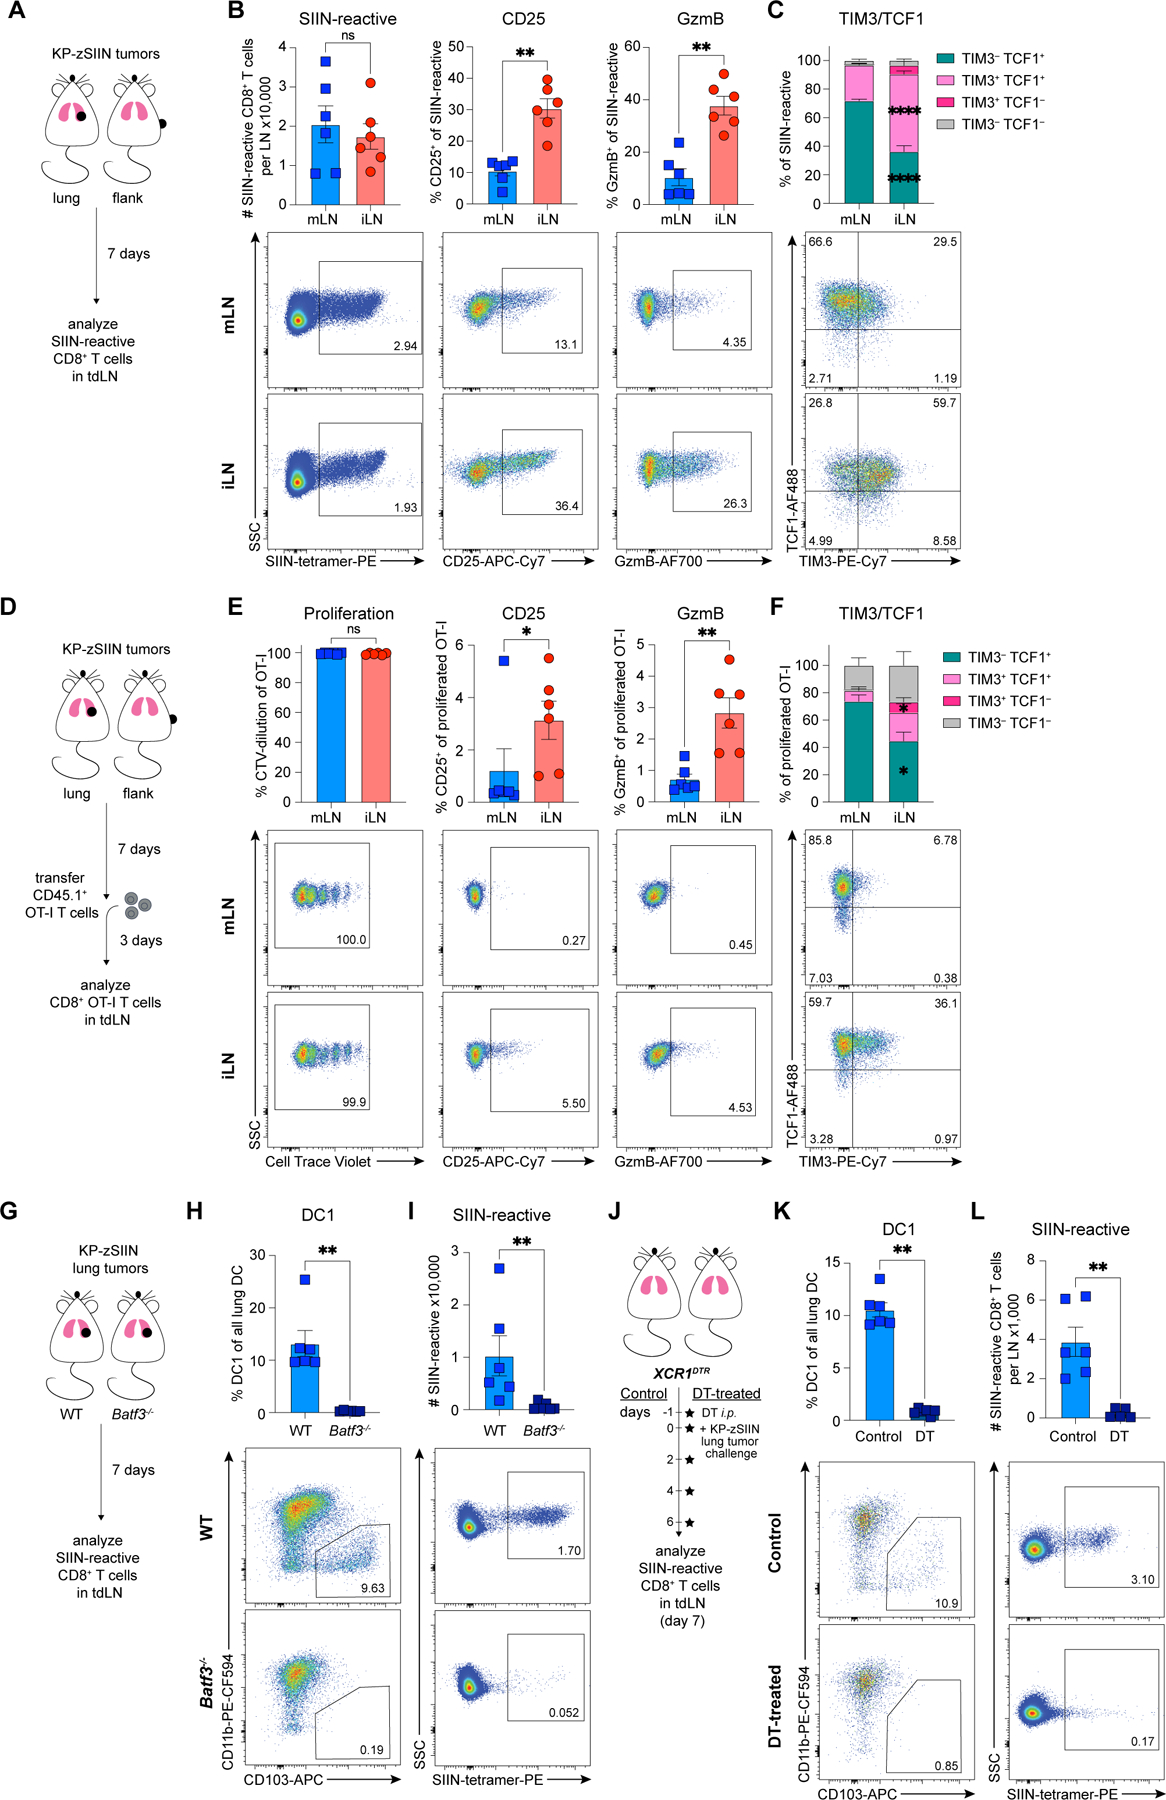
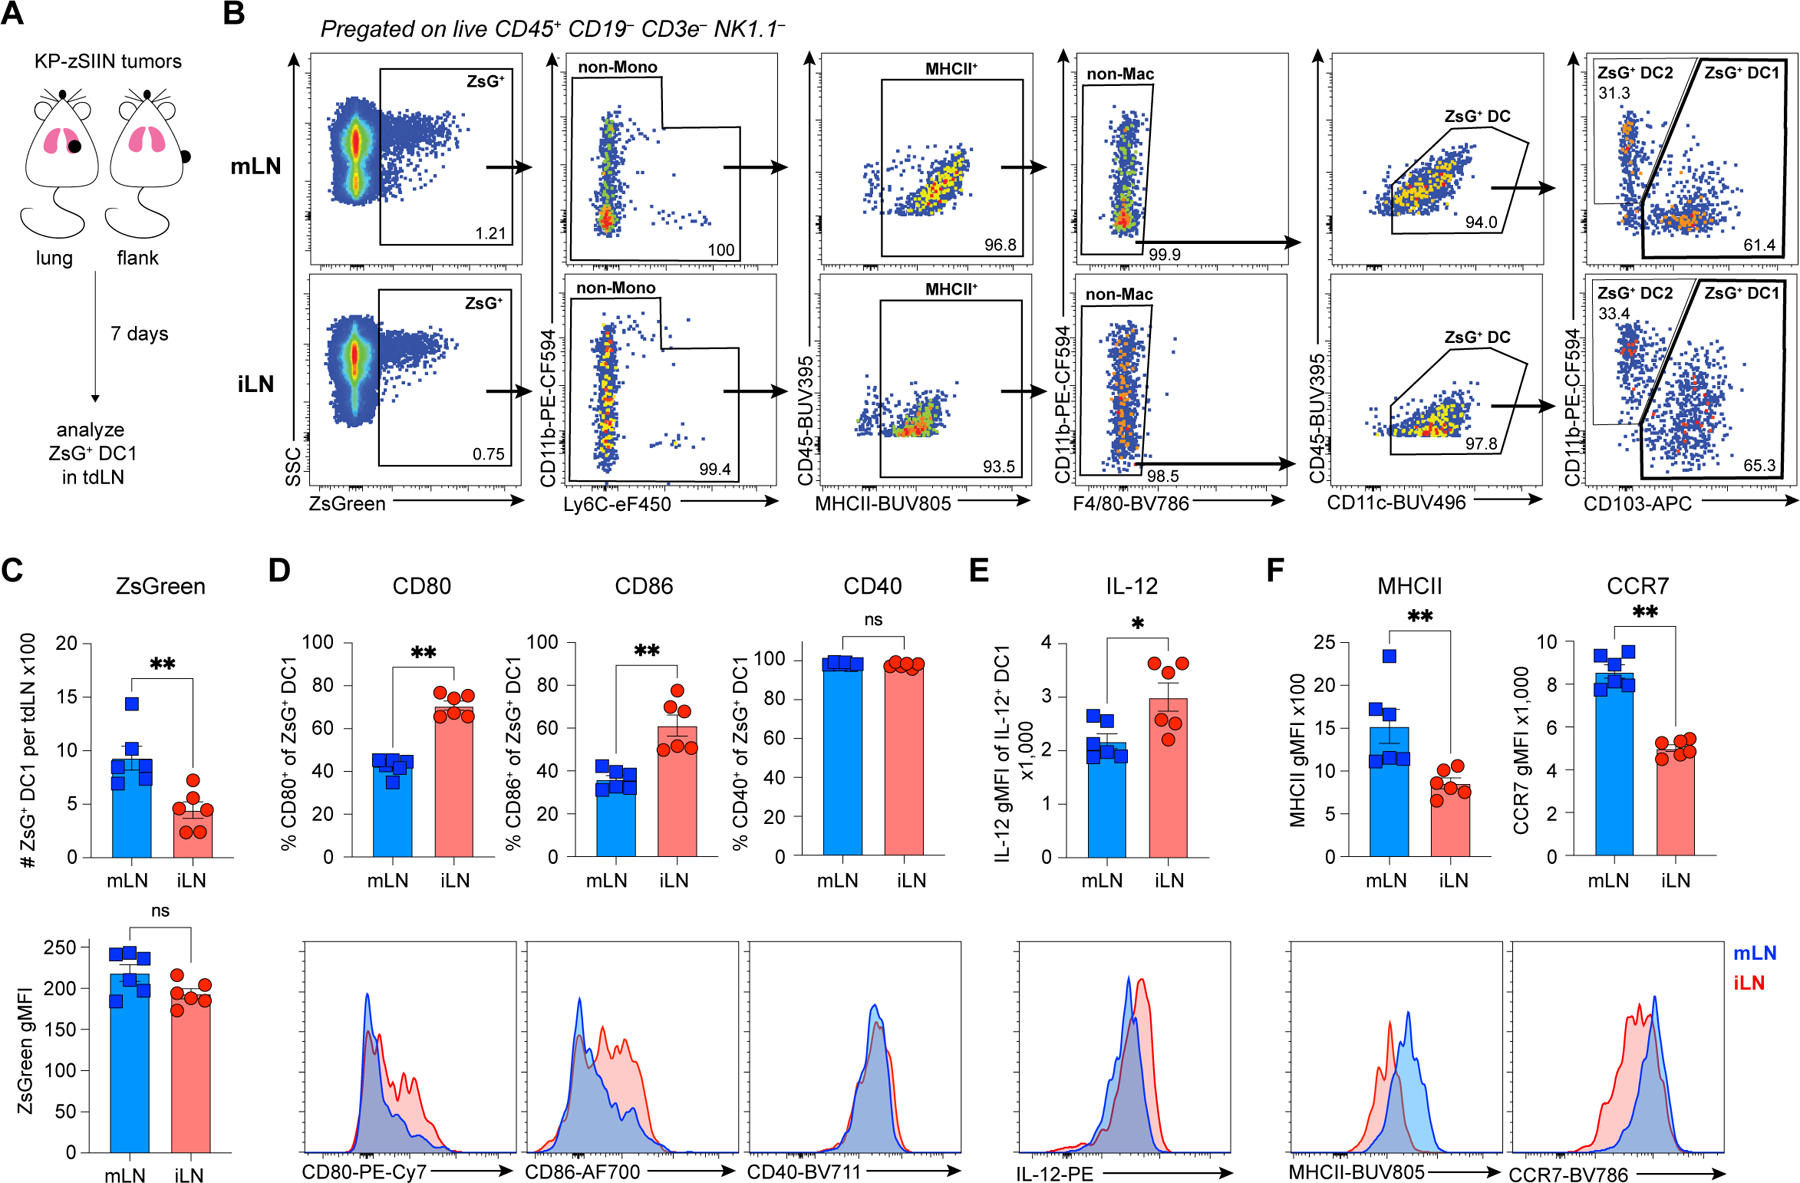
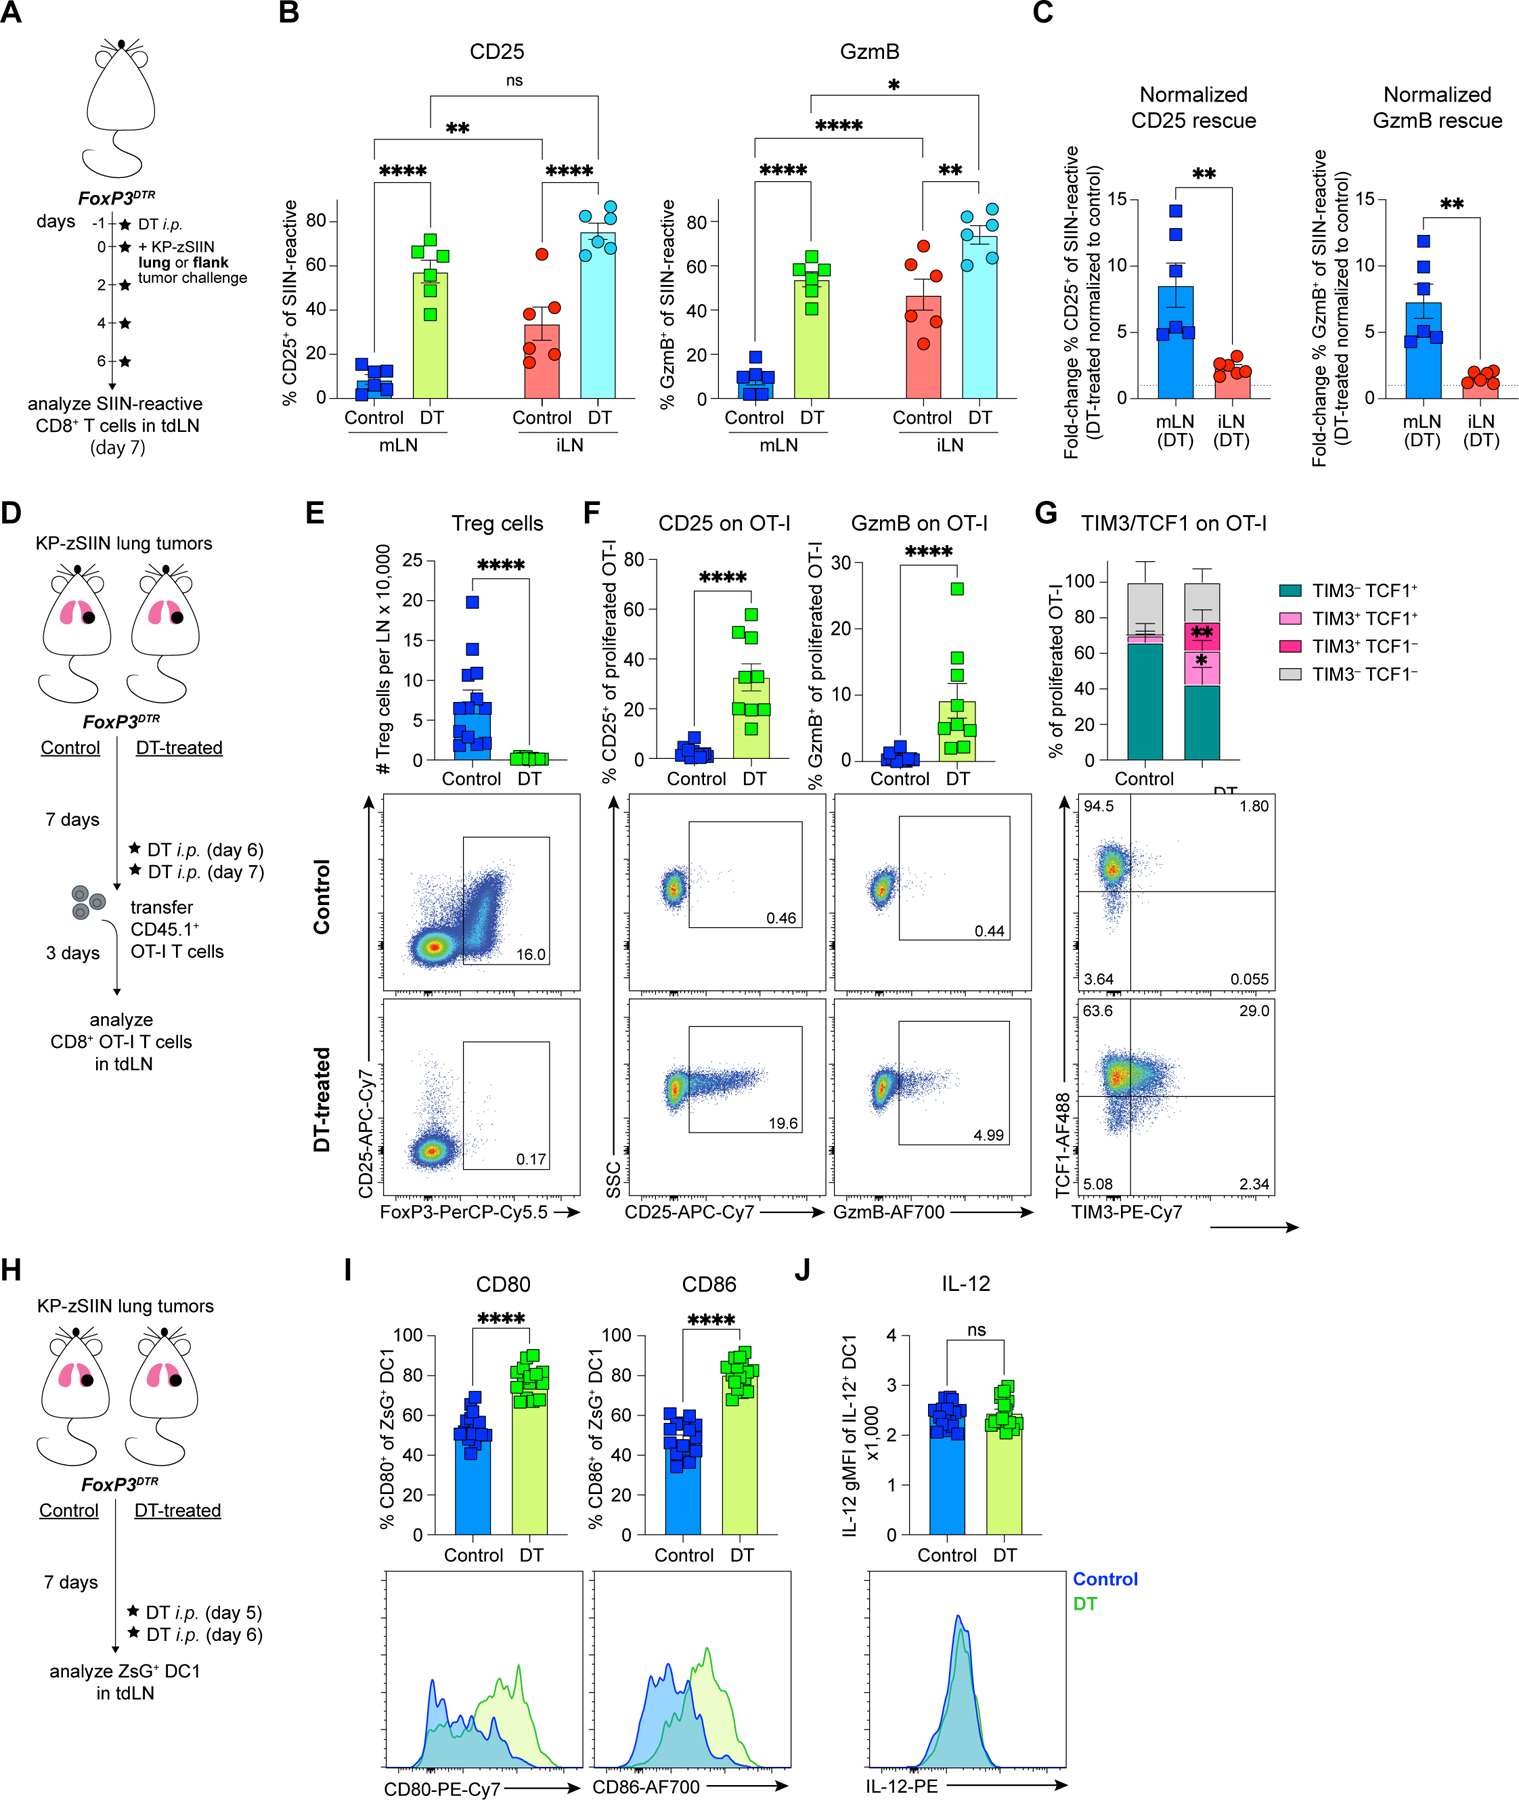
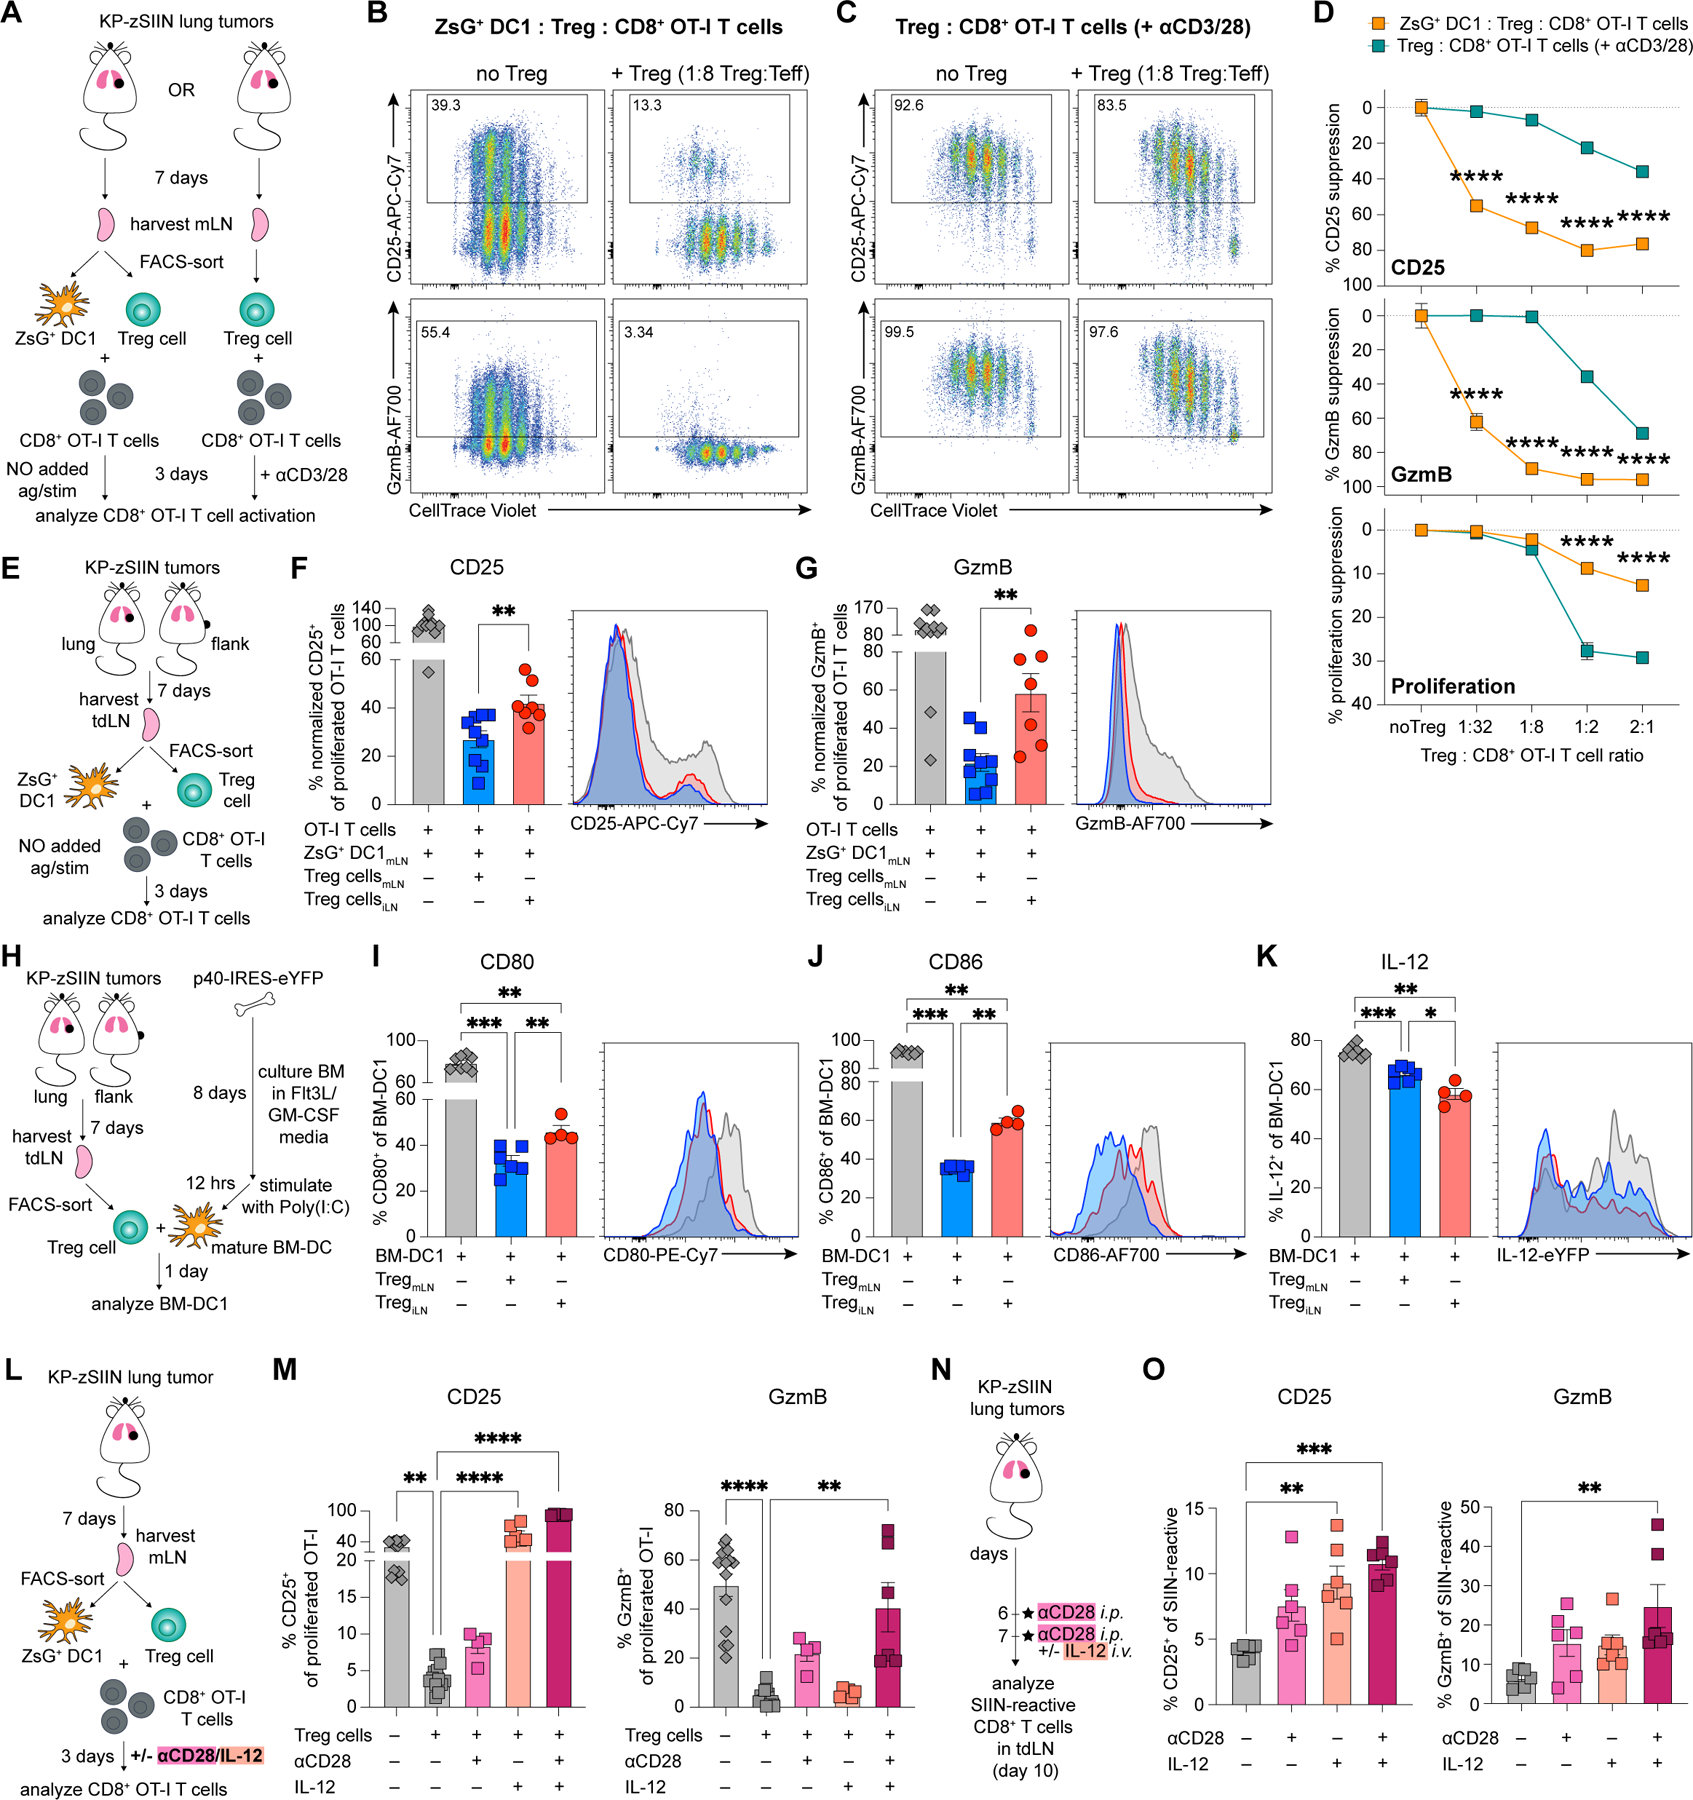
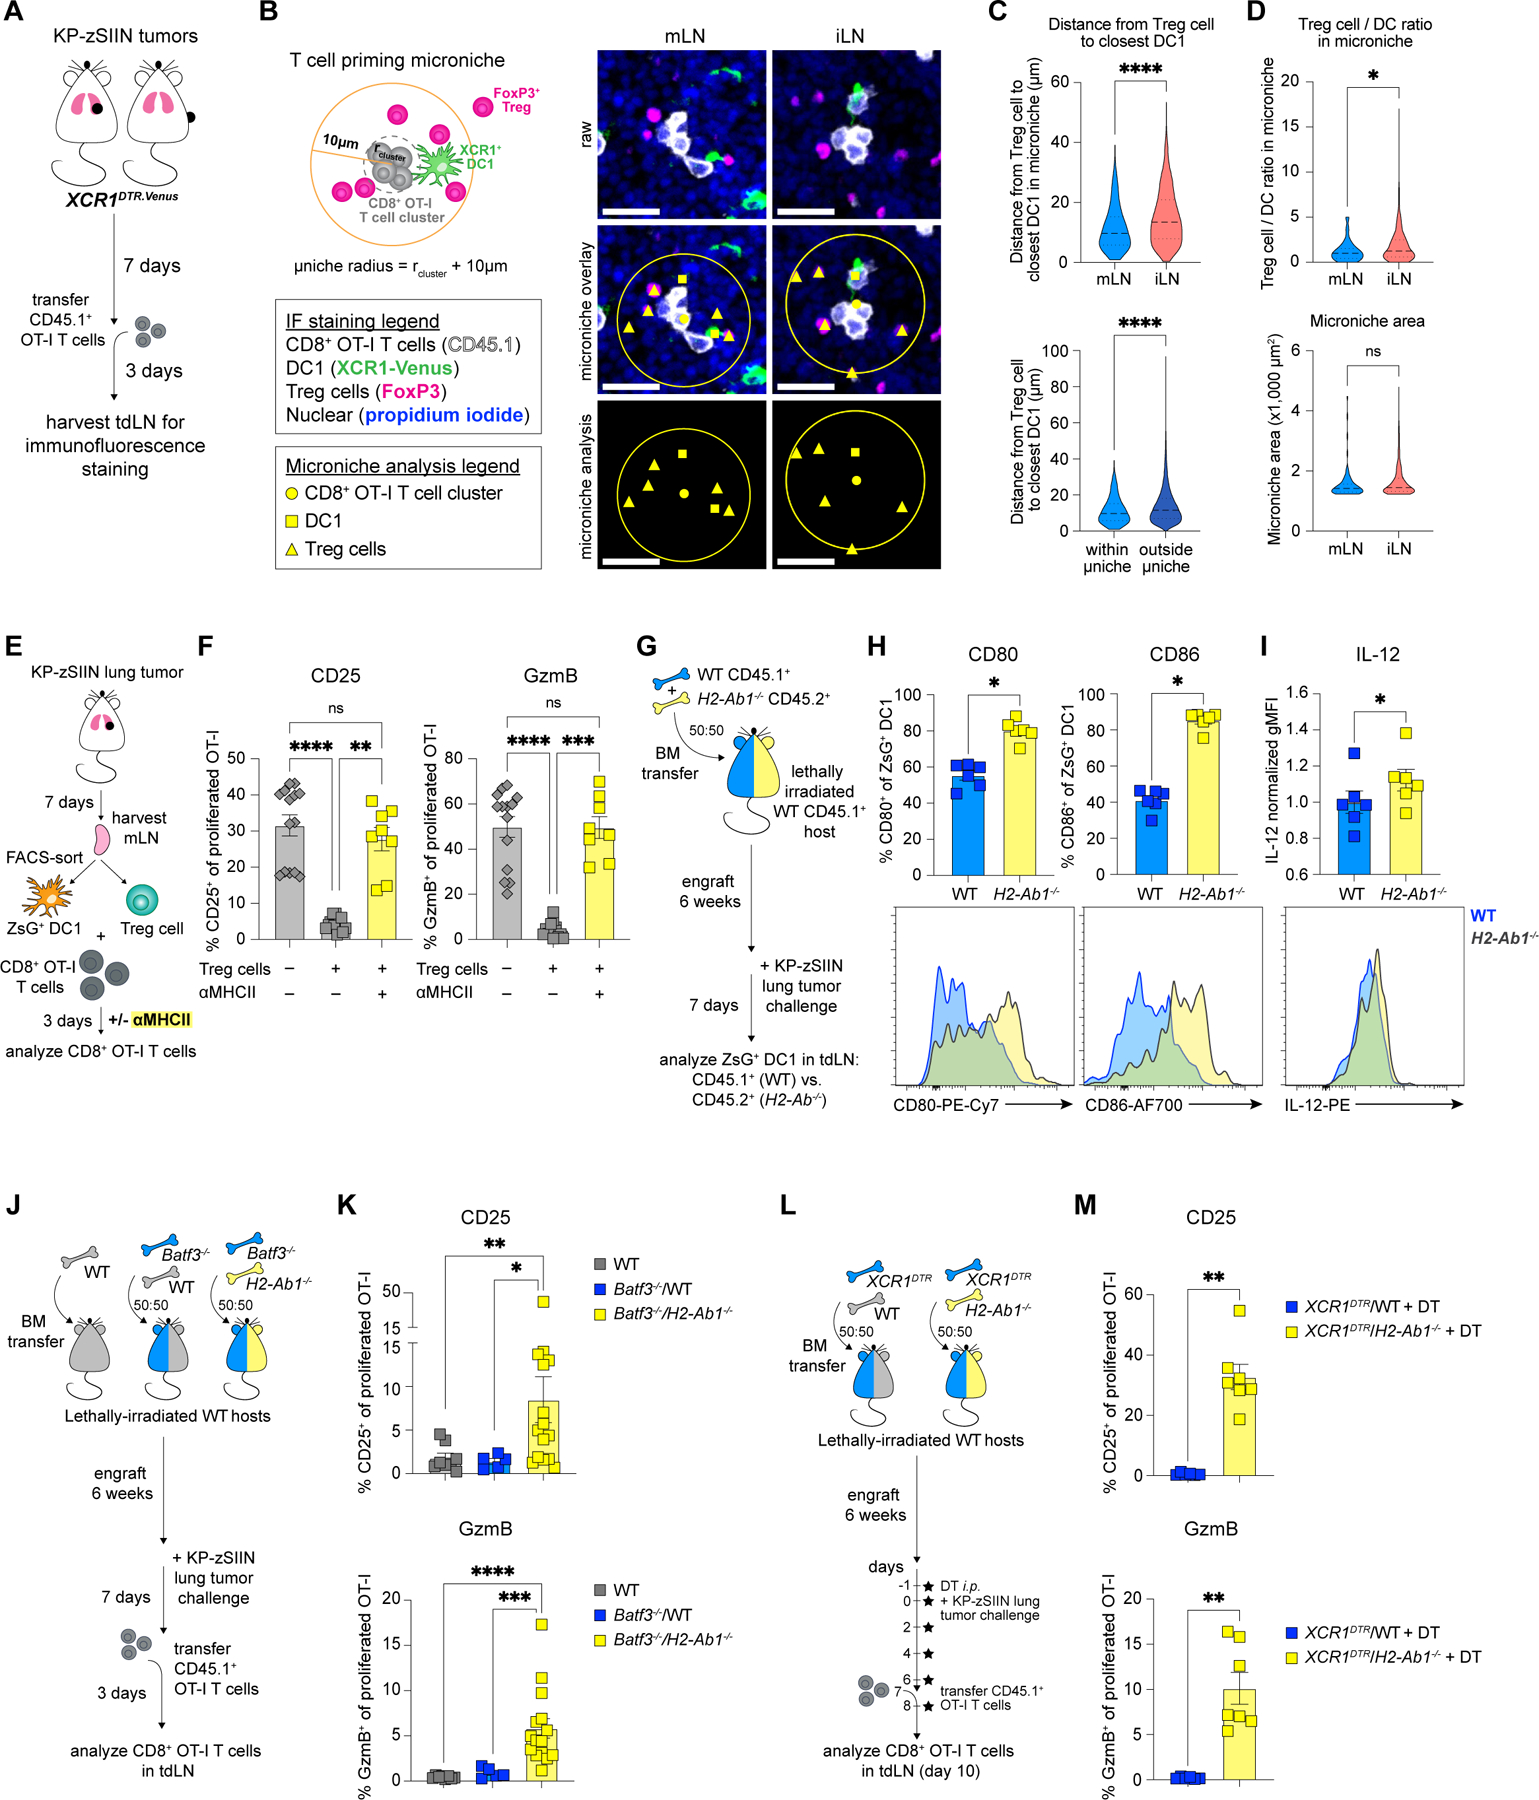
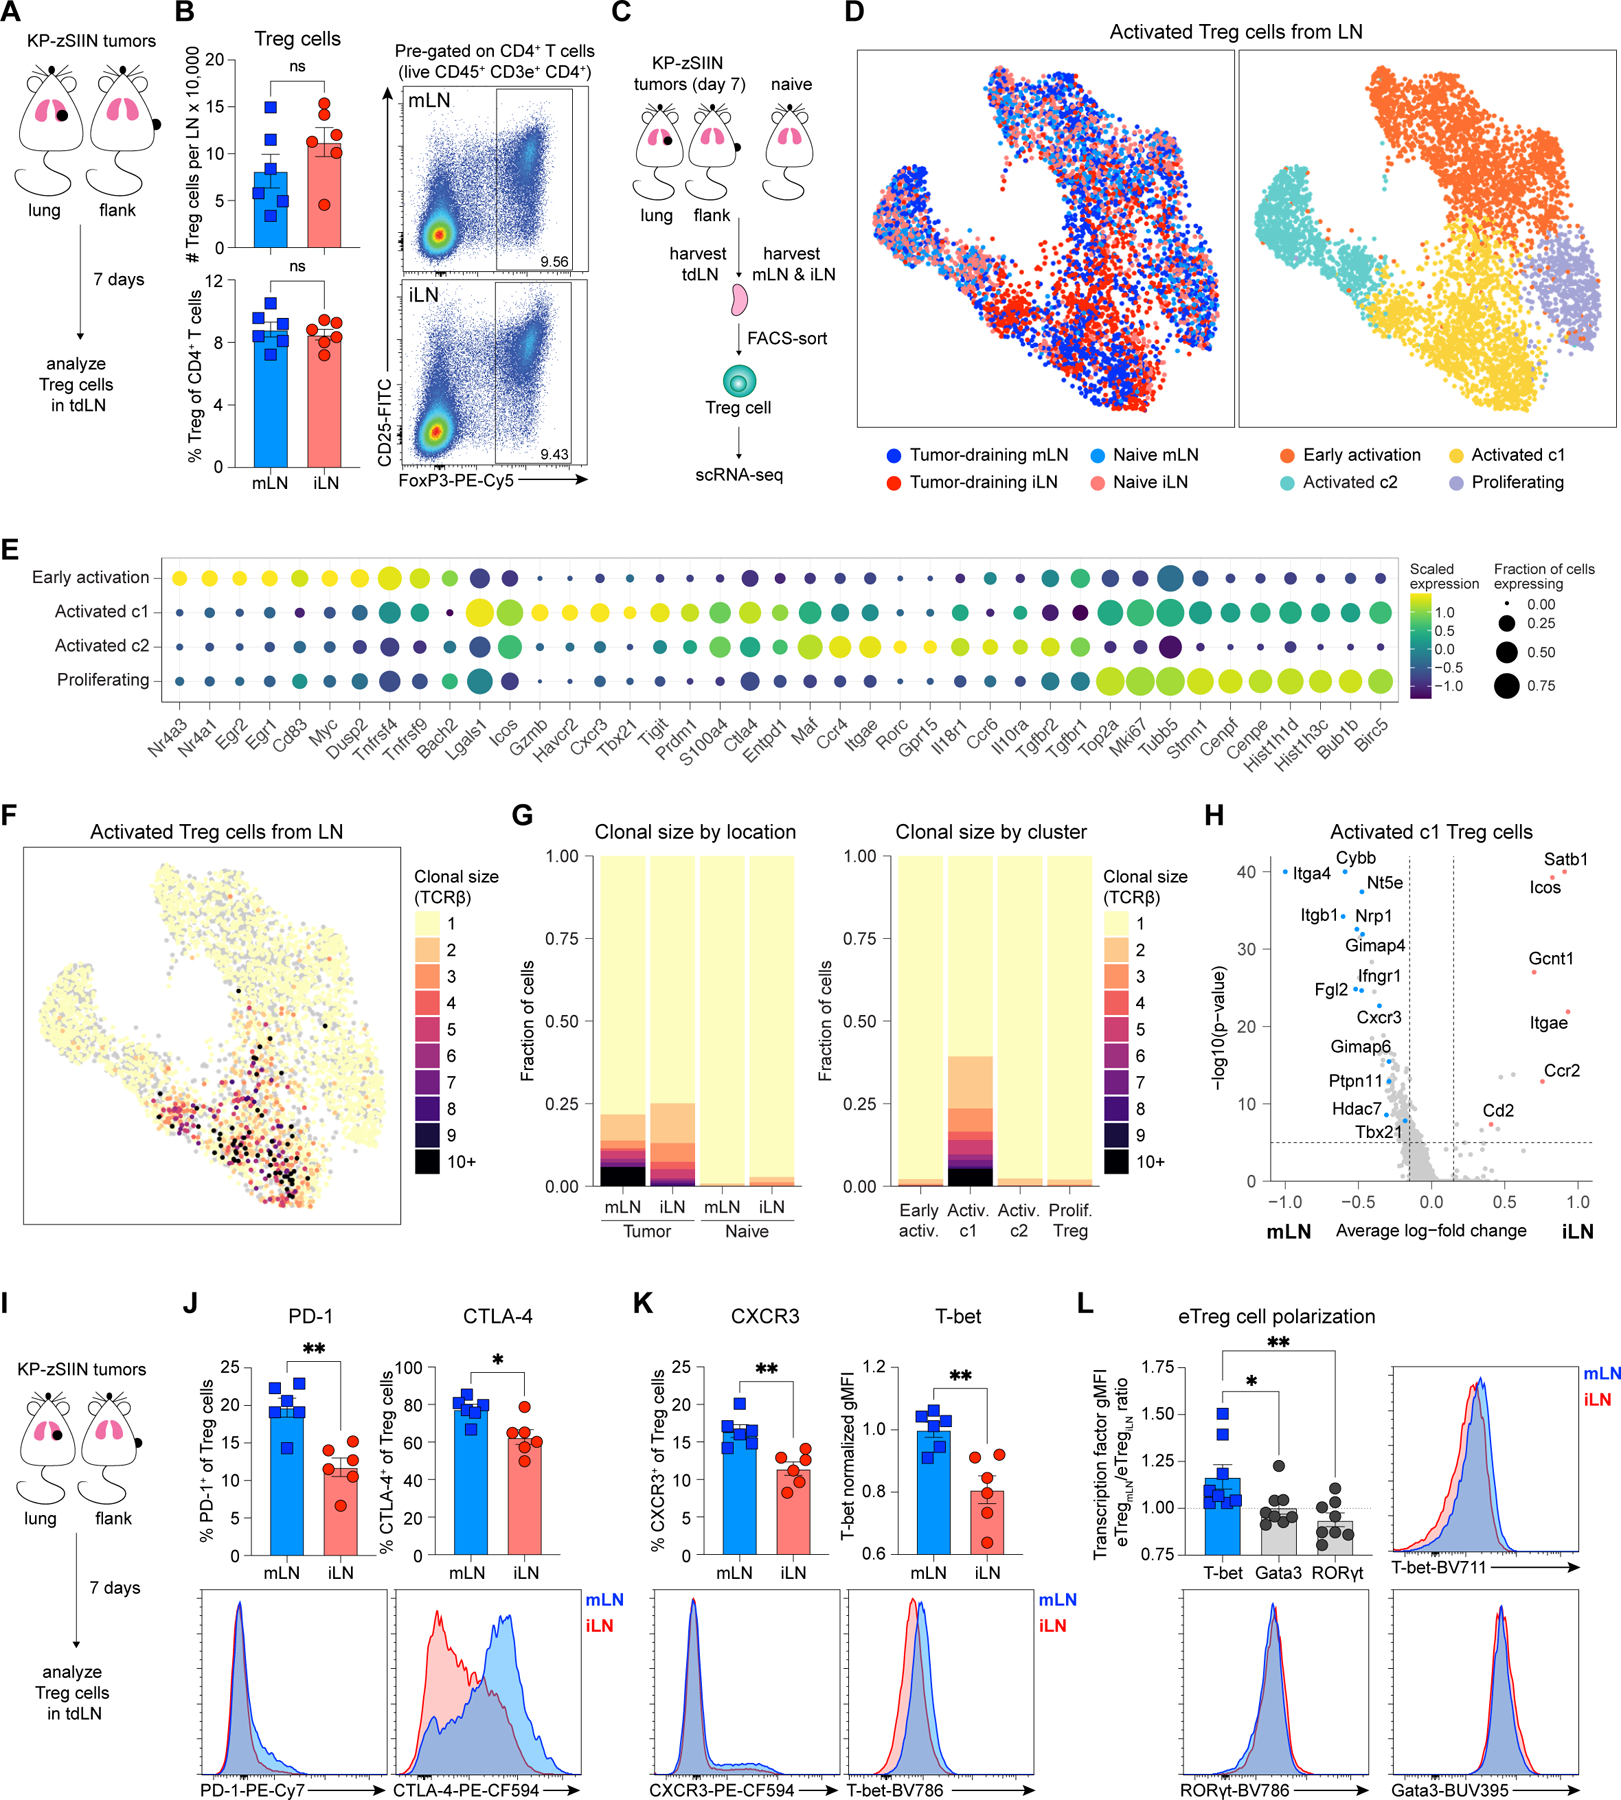
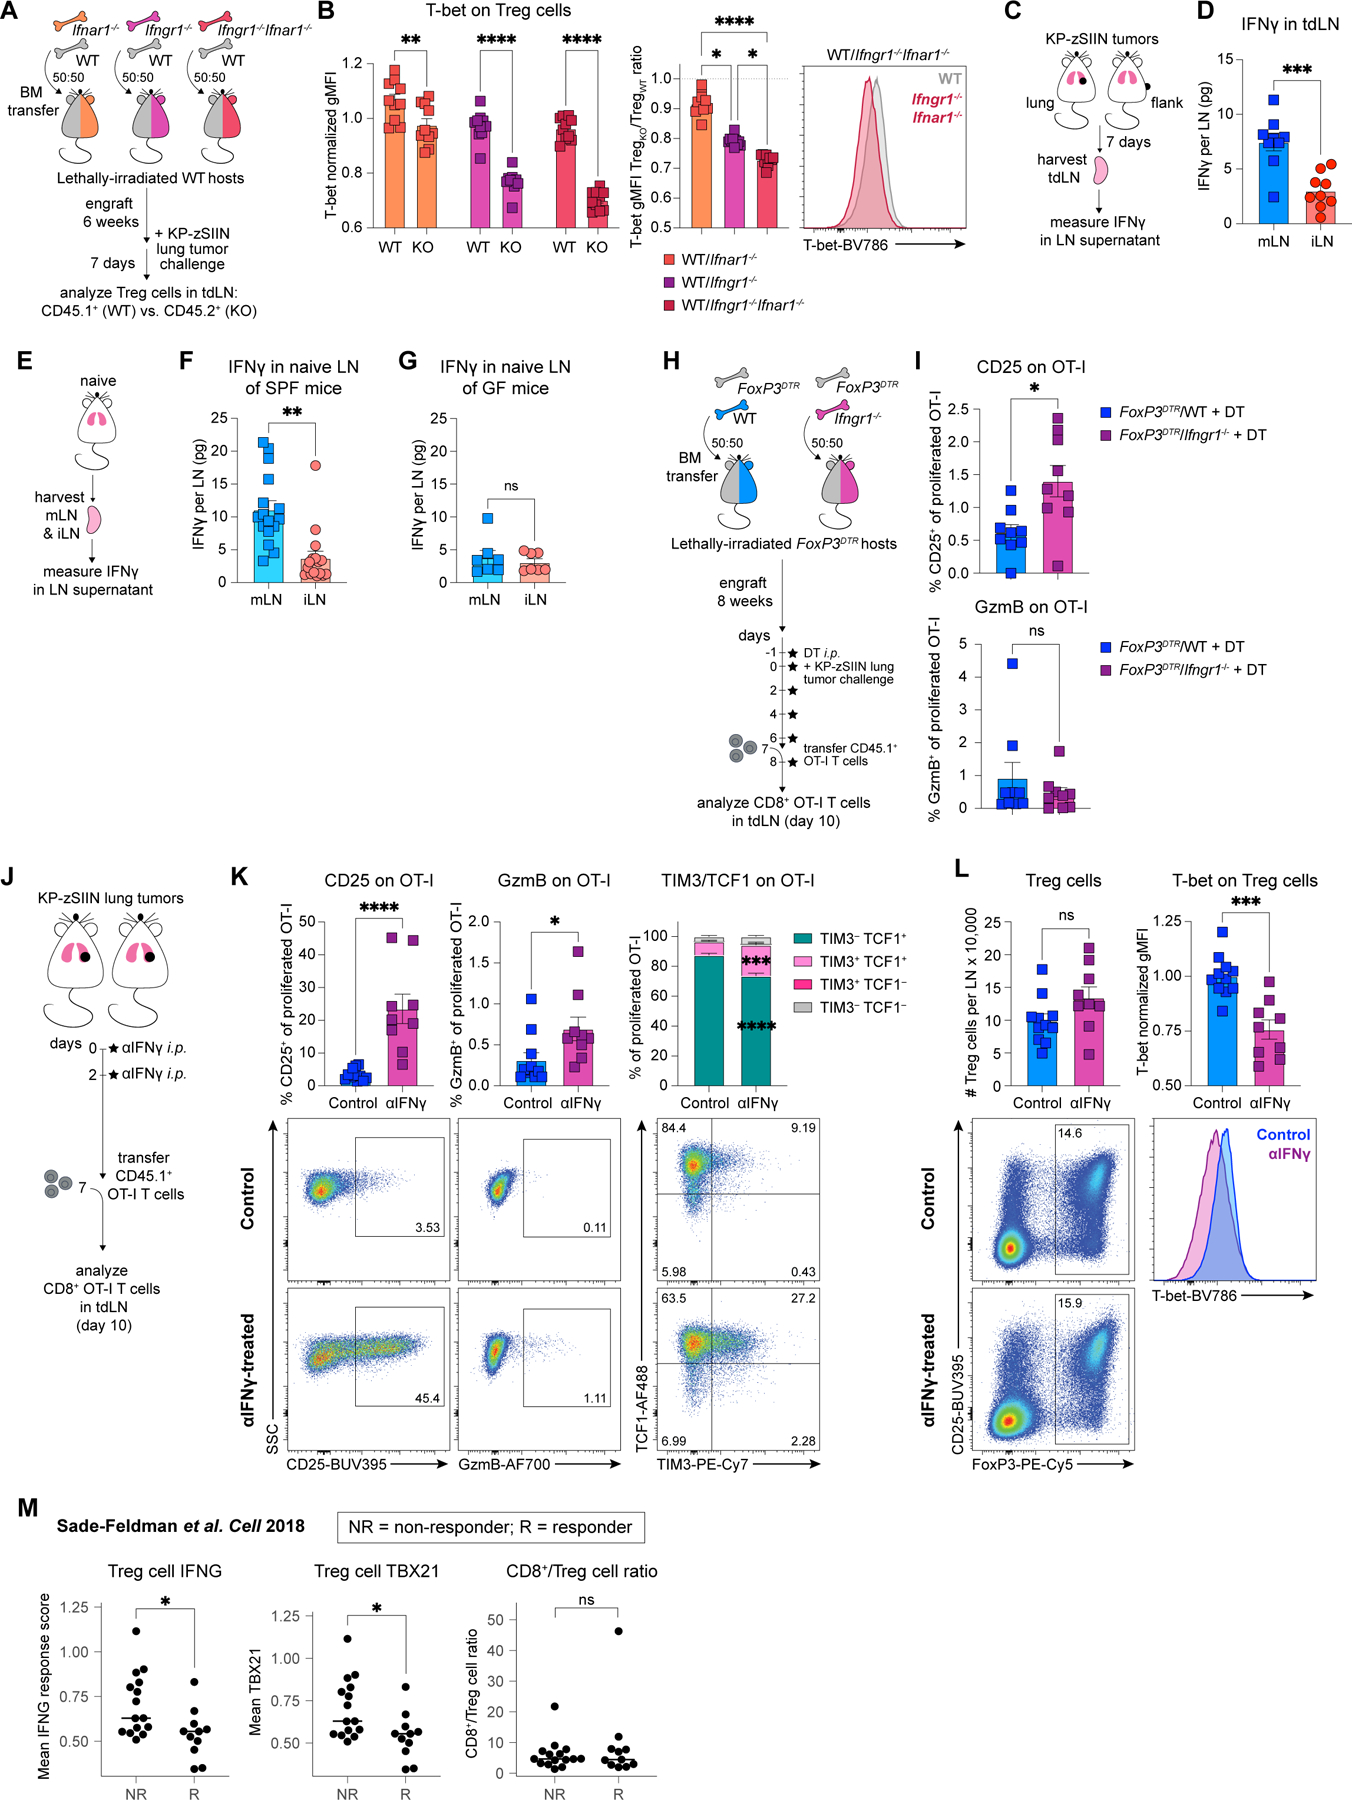
Local environmental factors influence CD8+ T cell priming in lymph nodes (LNs). Here, we sought to understand how factors unique to the tumor-draining mediastinal LN (mLN) impact CD8+ T cell responses toward lung cancer. Type 1 conventional dendritic cells (DC1s) showed a mLN-specific failure to induce robust cytotoxic T cells responses. Using regulatory T (Treg) cell depletion strategies, we found that Treg cells suppressed DC1s in a spatially coordinated manner within tissue-specific microniches within the mLN. Treg cell suppression required MHC II-dependent contact between DC1s and Treg cells. Elevated levels of IFN-γ drove differentiation Treg cells into Th1-like effector Treg cells in the mLN. In patients with cancer, Treg cell Th1 polarization, but not CD8+/Treg cell ratios, correlated with poor responses to checkpoint blockade immunotherapy. Thus, IFN-γ in the mLN skews Treg cells to be Th1-like effector Treg cells, driving their close interaction with DC1s and subsequent suppression of cytotoxic T cell responses.

Keywords: T cell dysfunction; T cell priming; Th1-like effector regulatory T cells; anti-tumor immunity; cross-presenting dendritic cells; cytotoxic T cells; interferon-gamma; non-small cell lung cancer; regulatory T cells; tissue-specific immunity.


Conflict of interest statement

Declaration of interests S.S. is a SAB member for Related Sciences, Arcus Biosciences, Ankyra Therapeutics, and Venn Therapeutics. S.S. is a co-founder of Danger Bio. S.S. is a consultant for TAKEDA, Merck, Tango Therapeutics, and Ribon Therapeutics and receives funding for unrelated projects from Leap Therapeutics. J.C.L. has interests in Sunflower Therapeutics PBC, Pfizer, Honeycomb Biotechnologies, OneCyte Biotechnologies, SQZ Biotechnologies, Alloy Therapeutics, QuantumCyte, Amgen, and Repligen. S.S. and J.C.L.’s interests are reviewed and managed under MIT’s policies for potential conflicts of interest. J.C.L. receives sponsored research support at MIT from Amgen, the Bill & Melinda Gates Foundation, Biogen, Pfizer, Roche, Takeda, and Sanofi.

Figures

Figure 1.
Figure 1.. DC1 in mLN prime dysfunctional CD8+ T cells against lung KP tumors.
(A) Experimental design for (B-C). (B-C) Representative flow plots and (B) numbers or CD25, GzmB, (C) TCF1 and TIM-3 expression of SIIN-reactive CD8+ T cells in tdLN, day 7 post-tumor implantation (n=3 mice/group; two independent experiments). (D) Experimental design for (E-F). (E-F) Representative flow plots and quantified (E) CellTrace Violet (CTV)-dilution or CD25, GzmB, (F) TCF1 and TIM-3 expression of adoptively-transferred CTV-labelled OT-I T cells primed in tdLN, day 10 post-tumor implantation (n=3 mice/group; two independent experiments). (G) Experimental design for (H-I). (H-I) Representative flow plots and quantified abundance of (H) DC1 in lungs and (I) SIIN-reactive CD8+ T cells in mLN of tumor-bearing WT or Batf3−/− mice, day 7 post-tumor implantation (n=3 mice/group; two independent experiments). (J) Experimental design for (K-L). (K-L) Representative flow plots and quantified abundance of (K) DC1 in lungs and (L) SIIN-reactive CD8+ T cells in mLN of control or DT-treated tumor-bearing XCR1DTR mice, day 7 post-tumor implantation (n=3 mice/group; two independent experiments). *p<0.05, **p<0.01, ****p<0.0001, ns=not significant; MWU (B-C,E-F,H-I,K-L). Data shown as mean ± SEM.
Figure 2.
Figure 2.. DC1 in tumor-draining mLN have high signal 1, but low signals 2 and 3.
(A) Experimental design for (B-F). (B) Representative flow gating strategy for ZsG+ DC1 from tdLN. (C) (top) Abundance and (bottom) ZsG geometric mean fluorescence intensity (gMFI) of ZsG+ DC1 from tdLN, day 7 post-tumor implantation (LN from 3–4 mice pooled per datapoint; two independent experiments). (D-F) Representative histograms and quantified expression of (D) CD80, CD86, CD40, (E) IL-12, (F) MHCII and CCR7 on ZsG+ DC1 from tdLN, day 7 post-tumor implantation (LN from 3–4 mice pooled per datapoint; two independent experiments). *p<0.05, **p<0.01, ns=not significant; MWU (C-F). Data shown as mean ± SEM.
Figure 3.
Figure 3.. Treg cells can induce CD8+ T cell dysfunction and DC1 suppression in the tumor-draining mLN.
(A) Experimental design for (B-C). (B-C) Quantification of (B) CD25 and GzmB expression, and (C) DT-treated/control ratios of CD25 and GzmB expression within each tdLN site for SIIN-reactive CD8+ T cells from control or DT-treated tumor-bearing FoxP3DTR mice, day 7 post-tumor implantation (n=3 mice/group; two independent experiments). (D) Experimental design for (E-G). (E-G) Representative flow plots and quantified (E) Treg cell number, (F) expression of CD25, GzmB, (G) TCF1 and TIM-3 on adoptively-transferred proliferated OT-I T cells from mLN of control or DT-treated tumor-bearing FoxP3DTR mice, day 10 post-tumor implantation (n=2–4 mice/group; four independent experiments). (H) Experimental design for (I-J). (I-J) Representative histograms and quantified expression of (I) CD80, CD86 and (J) IL-12 on ZsG+ DC1 from mLN of control or DT-treated tumor-bearing FoxP3DTR mice, day 7 post-tumor implantation (mLN from 3–5 mice pooled per datapoint; six independent experiments). *p<0.05, **p<0.01, ****p<0.0001, ns=not significant; two-way ANOVA (B), MWU (C,E-G,I-J). Data shown as mean ± SEM.
Figure 4.
Figure 4.. Treg cells from the tumor-draining mLN restrain cytotoxic T cell priming by suppressing DC-derived signals 2 and 3.
(A) Experimental design for (B-D). (B-D) Representative flow plots of proliferation, CD25 and GzmB expression of CTV-labelled OT-I T cells after 3-day co-culture with (B) mLN-sorted ZsG+ DC1 and Treg cells or (C) mLN-sorted Treg cells with αCD3/αCD28-stimulation; representative example quantified in (D) (50 tdLN pooled for sorting, three independent experiments). (E) Experimental design for (F-G). (F-G) Representative histograms and quantified expression of (F) CD25 and (G) GzmB on proliferated OT-I T cells after 3-day co-culture with mLN-sorted ZsG+ DC1 and either mLN- or iLN-sorted Treg cells (50 tdLN pooled for sorting, three independent experiments). (H) Experimental design for (I-K). (I-K) Representative histograms and quantified expression of (I) CD80, (J) CD86 and (K) IL-12 on p40-IRES-eYFP BM-DC1 after 3-day co-culture with either mLN- or iLN-sorted Treg cells (15 tdLN pooled for sorting, two independent experiments). (L) Experimental design for (M). (M) CD25 and GzmB expression on proliferated OT-I T cells after 3-day co-culture with mLN-sorted DC1 and Treg cells at indicated culture conditions (50 mLN pooled for sorting, four independent experiments). (N) Experimental design for (O). (O) CD25 and GzmB expression on SIIN-reactive CD8+ T cells in tumor-draining mLN, day 10 post-tumor implantation (n=3 mice/group; two independent experiments). *p<0.05, **p<0.01, ***p<0.001, ****p<0.0001; two-way ANOVA (D), MWU (F-G,I-K) or KW (M,O). Data shown as mean ± SEM.
Figure 5.
Figure 5.. Treg cells suppress CD8+ T cell priming in the mLN via direct interaction with DC1.
(A) Experimental design for (B-D) and Figure S2K. (B) Schematic of microniche analysis for (C-D) and representative IF images of tdLN from tumor-bearing XCR1DTR.Venus mice, day 10 post-tumor implantation; scale bar, 20 μm. (C-D) Distance from Treg cell to closest DC1 (C, top) within microniche in tumor-draining mLN and iLN or (C, bottom) in mLN within and outside of microniche, (D, top) Treg/DC1 ratio within microniche and (D, bottom) microniche area in tdLN; using microniche radius: rcluster + 10μm (n=4 mice/group including 399 mLN microniches and 74 iLN microniches; representative data from one of two independent experiments). (E) Experimental design for (F). (F) CD25 and GzmB expression on proliferated OT-I T cells after 3-day co-culture with mLN-sorted ZsG+ DC1 and Treg cells at indicated culture conditions (50 mLN pooled for sorting, four independent experiments); controls (gray bars) are the same as shown in Figure 4M. (G) Experimental design for (H-I) and Figures S2L-M. (H-I) Representative histograms and quantified expression of (H) CD80, CD86 and (I) IL-12 on WT and H2-Ab1−/− ZsG+ DC1 from mLN of tumor-bearing WT/H2-Ab1−/− BMCs, day 7 post-tumor implantation (mLN from 3–4 mice pooled per datapoint; two independent experiments). (J) Experimental design for (K) and Figures S2N-O. (K) CD25 and GzmB expression on adoptively-transferred proliferated OT-I T cells primed in mLN of tumor-bearing WT, Batf3−/−/WT or Batf3−/−/H2-Ab1−/− BMCs, day 10 post-tumor implantation (n=2–5 mice/group; 1–4 independent experiments). (L) Experimental design for (M) and Figures S2P-Q. (M) CD25 and GzmB expression on adoptively-transferred proliferated OT-I T cells primed in mLN of DT-treated tumor-bearing XCR1DTR/WT or XCR1DTR/H2-Ab1−/− BMCs, day 10 post-tumor implantation (n=3–4 mice/group; two independent experiments). *p<0.05, **p<0.01, ***p<0.001, ****p<0.0001, ns=not significant; MWU test (C-D,K,M), paired-MWU (H-I) or KW (F). Data shown as mean ± SEM.
Figure 6.
Figure 6.. TH1-like Treg cells expand in tumor-draining mLN.
(A) Experimental design for (B) and Figure S3A. (B) Representative flow plots and quantified abundance of Treg cells in tdLN, day 7 post-tumor implantation (n=3 mice/group; two independent experiments). (C) Experimental design for (D-H) and Figures S3B-K;S3N. (D) UMAP plots of activated Treg cells from naïve and tumor-draining mLN and iLN colored (left) by tumor status and location or (right) by cluster (tdLN, n=5 mice/group; naïve LN, n=20 mice/group). (E) Dot plot of select marker genes for each Treg cluster displaying average expression and frequency of expression for each gene. (F-G) Clonal size of activated Treg cells (F) mapped onto UMAP plot and (G) graphed using stacked bar plots arranged (left) by tumor status and location or (right) by cluster. (H) Volcano plot of DEGs between activated c1 Treg cells from mLN and iLN. (I) Experimental design for (J-L). (J-K) Representative histograms and quantified expression of (J) PD-1, CTLA-4, (K) CXCR3 and T-bet on Treg cells from tdLN, day 7 post-tumor implantation (n=3 mice/group; two independent experiments). (L) Representative histograms and transcription factor gMFI ratios for eTreg cells from tumor-draining mLN and iLN, day 7 post-tumor implantation (n=4 mice/group; two independent experiments). *p<0.05, **p<0.01, ns=not significant; MWU (B,J-L), MWU with Bonferroni correction (H). Data shown as mean ± SEM.
Figure 7.
Figure 7.. mLN-specific enrichment in IFNγ drives induction of TH1-like Treg cells and the associated dysfunctional T cell responses against lung cancer.
(A) Experimental design for (B). (B) Representative histogram and quantified T-bet expression on WT and IFN receptor-deficient (KO) Treg cells from mLN of tumor-bearing WT/Ifnar1−/−, WT/Ifngr1−/− or WT/Ifngr1−/−Ifnar1−/− BMCs, day 7 post-tumor implantation (n=5 mice/group; two independent experiments). (C) Experimental design for (D). (D) IFNγ quantification in tdLN, day 7 post-tumor implantation (n=3 mice/group; three independent experiments). (E) Experimental design for (F-G). (F) IFNγ quantification in LN of naïve SPF mice (n=3–4 mice/group; five independent experiments). (G) IFNγ quantification in LN of naïve GF mice (n=2–3 mice/group; three independent experiments). (H) Experimental design for (I). (I) CD25 and GzmB expression on adoptively-transferred proliferated OT-I T cells primed in mLN of DT-treated tumor-bearing FoxP3DTR/WT or FoxP3DTR/Ifngr1−/− BMCs, day 10 post-tumor implantation (n=3 mice/group; three independent experiments). (J) Experimental design for (K-L). (K-L) Representative flow plots and quantified expression of (K) CD25, GzmB, TIM3 and TCF1 on adoptively-transferred proliferated OT-I T cells and (L) abundance and T-bet expression for Treg cells from mLN of control and αIFNγ-treated tumor-bearing mice, day 10 post-tumor implantation (n=3–4 mice/group; three independent experiments). (M) IFNG response hallmark signature scores and TBX21 expression on intratumoral Treg cells, along with CD8+/Treg cell ratios in melanoma patients, including ICB-responders (R) and ICB-non-responders (NR). *p<0.05, **p<0.01, ***p<0.001, ****p<0.0001, ns=not significant; two-way ANOVA (B, left) or KW (B, middle), paired-MWU (F-G), MWU (D,I,K-L,M). Data shown as mean ± SEM, except in (M) where the median is shown.

Comment in

References

    1. Fridman WH, Pages F, Sautes-Fridman C, and Galon J (2012). The immune contexture in human tumours: impact on clinical outcome. Nat Rev Cancer 12, 298–306. 10.1038/nrc3245. - DOI - PubMed
    1. Weigelin B, den Boer AT, Wagena E, Broen K, Dolstra H, de Boer RJ, Figdor CG, Textor J, and Friedl P (2021). Cytotoxic T cells are able to efficiently eliminate cancer cells by additive cytotoxicity. Nat Commun 12, 5217. 10.1038/s41467-021-25282-3. - DOI - PMC - PubMed
    1. Chen DS, and Mellman I (2013). Oncology meets immunology: the cancer-immunity cycle. Immunity 39, 1–10. 10.1016/j.immuni.2013.07.012. - DOI - PubMed
    1. Hildner K, Edelson BT, Purtha WE, Diamond M, Matsushita H, Kohyama M, Calderon B, Schraml BU, Unanue ER, Diamond MS, et al. (2008). Batf3 deficiency reveals a critical role for CD8alpha+ dendritic cells in cytotoxic T cell immunity. Science 322, 1097–1100. 10.1126/science.1164206. - DOI - PMC - PubMed
    1. Broz ML, Binnewies M, Boldajipour B, Nelson AE, Pollack JL, Erle DJ, Barczak A, Rosenblum MD, Daud A, Barber DL, et al. (2014). Dissecting the Tumor Myeloid Compartment Reveals Rare Activating Antigen-Presenting Cells Critical for T Cell Immunity. Cancer Cell 26, 938. 10.1016/j.ccell.2014.11.010. - DOI - PubMed

Publication types