. 2023 Sep 1;94(5):393-404.
doi: 10.1016/j.biopsych.2023.01.018. Epub 2023 Feb 1.

Alcohol Dependence Modifies Brain Networks Activated During Withdrawal and Reaccess: A c-Fos-Based Analysis in Mice

Affiliations

Alcohol Dependence Modifies Brain Networks Activated During Withdrawal and Reaccess: A c-Fos-Based Analysis in Mice

Alison V Roland et al. Biol Psychiatry. .

Abstract

Background: High-level alcohol consumption causes neuroplastic changes in the brain that promote pathological drinking behavior. Some of these changes have been characterized in defined brain circuits and cell types, but unbiased approaches are needed to explore broader patterns of adaptations.

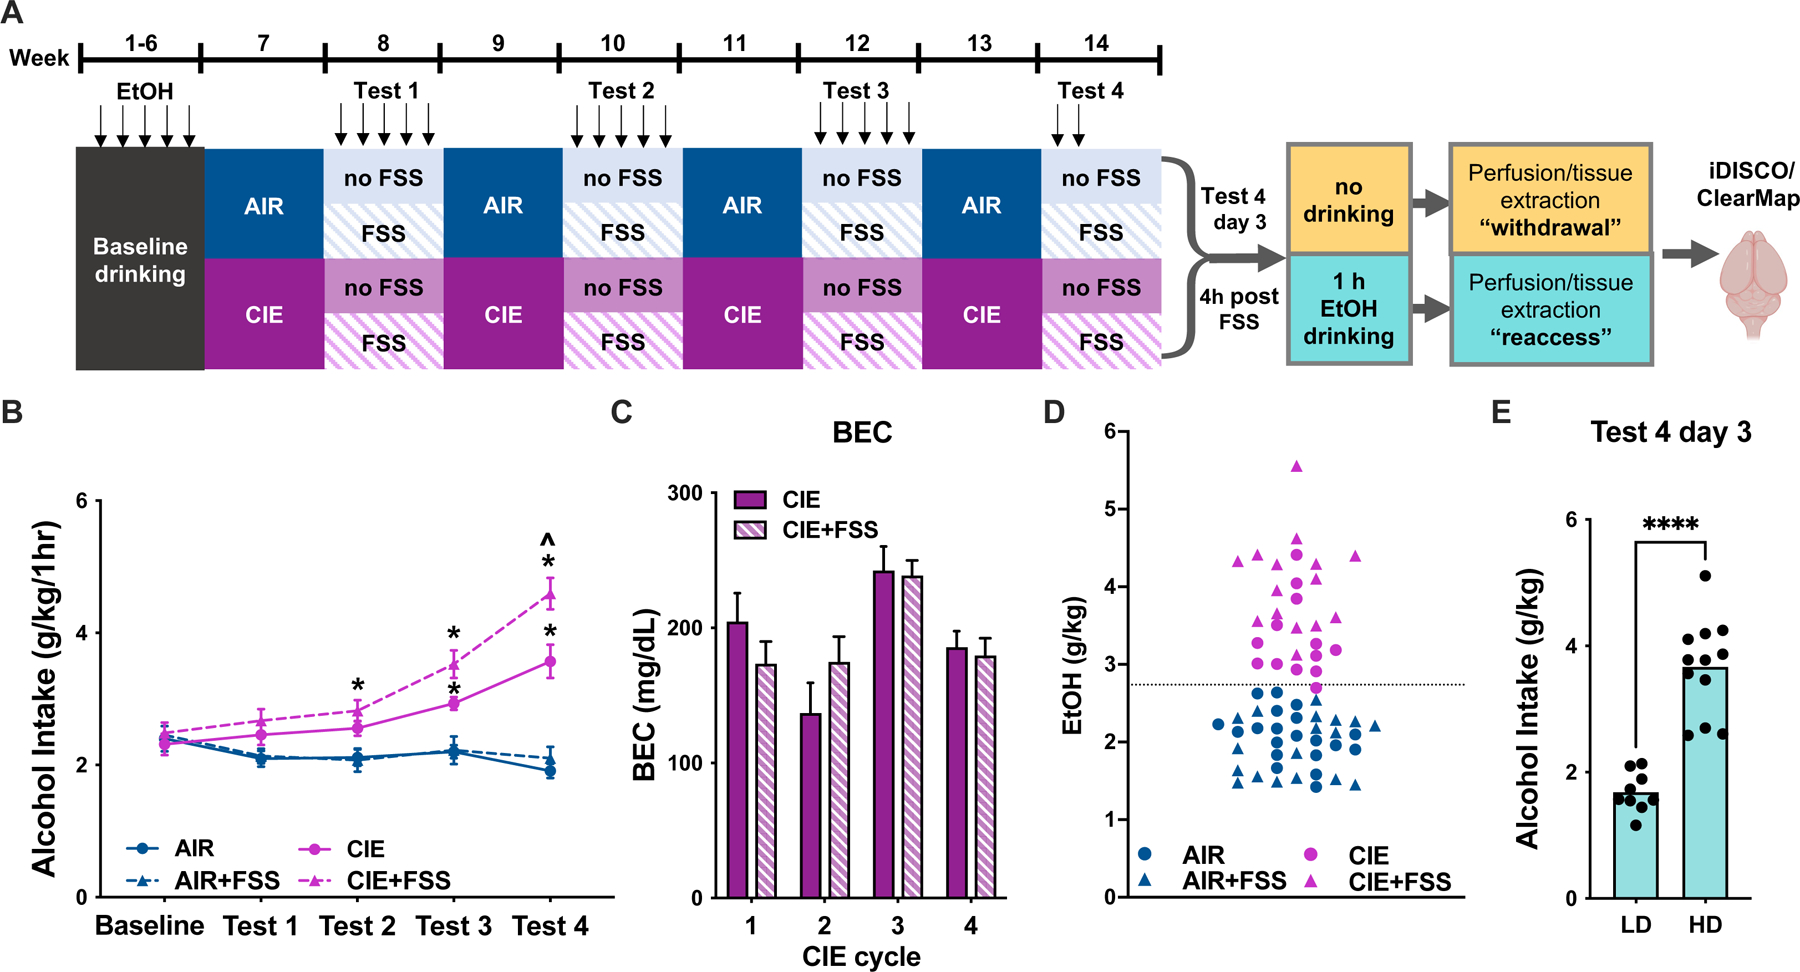
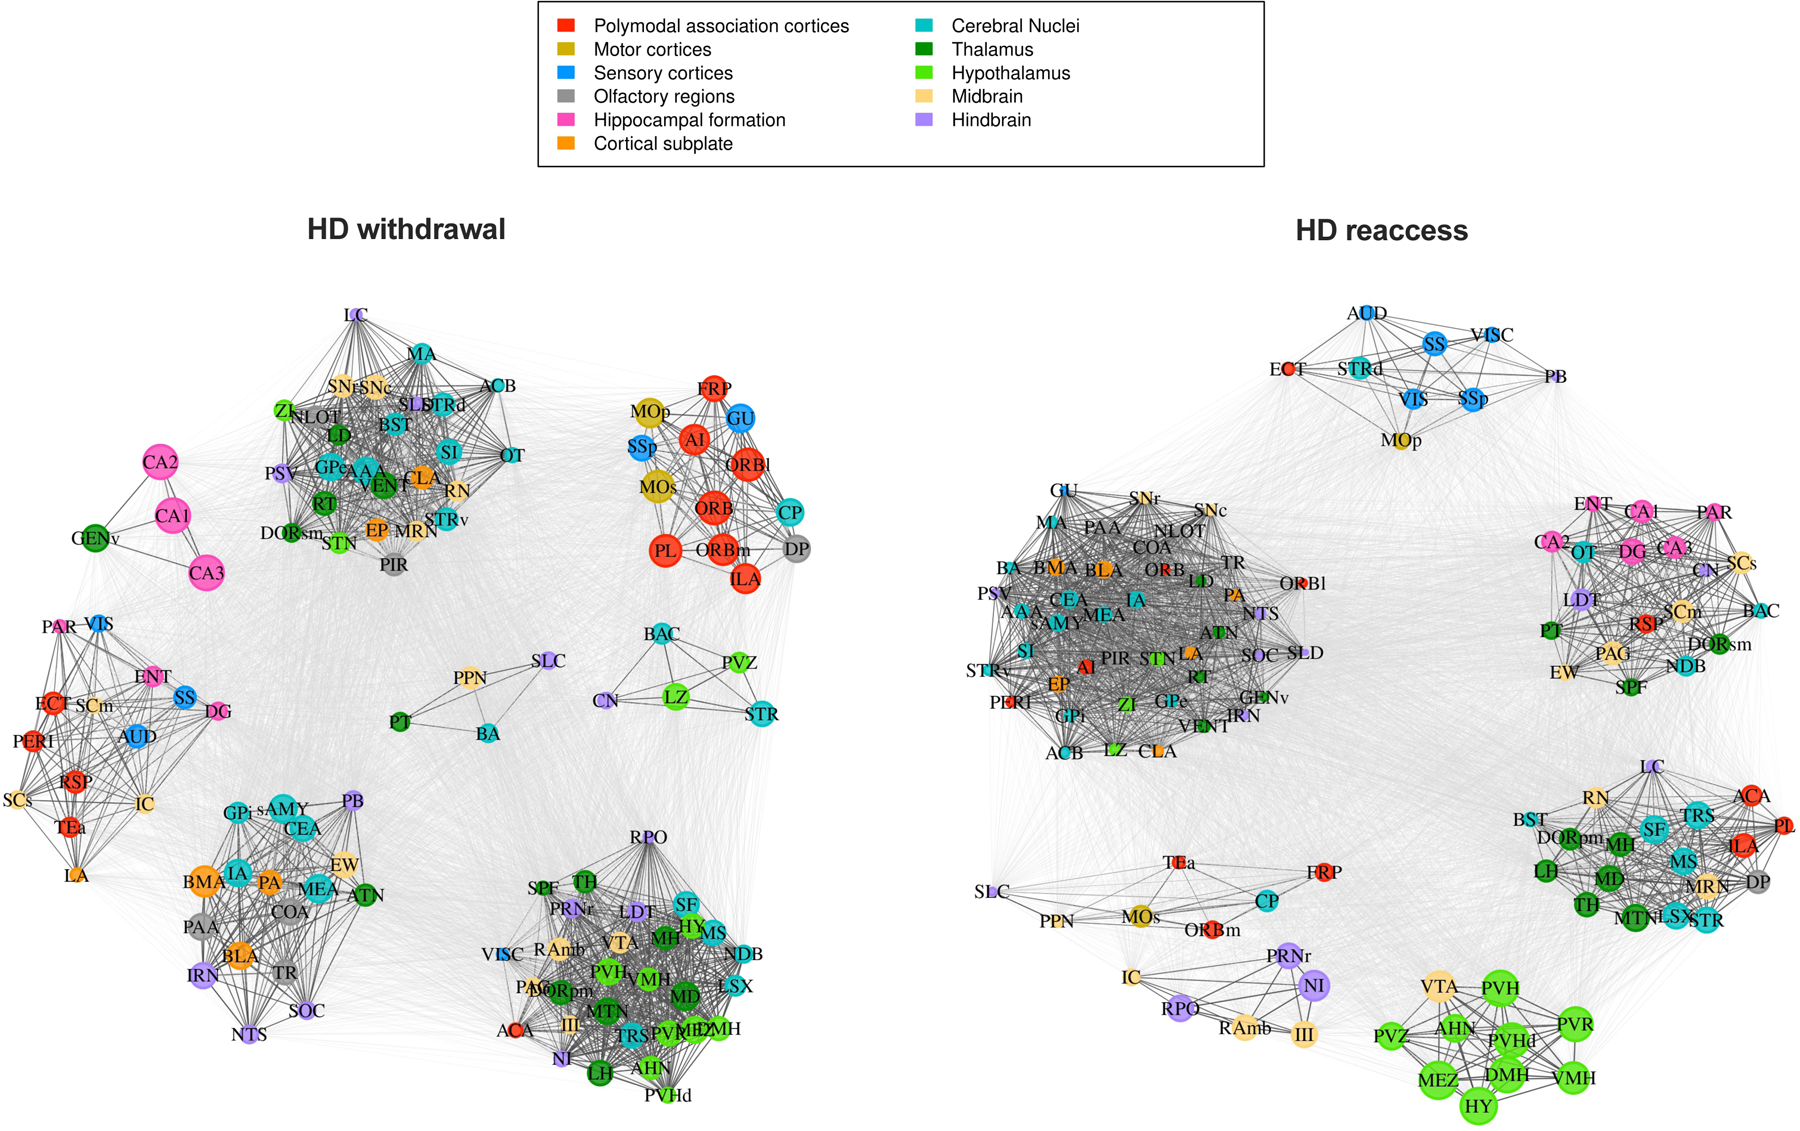
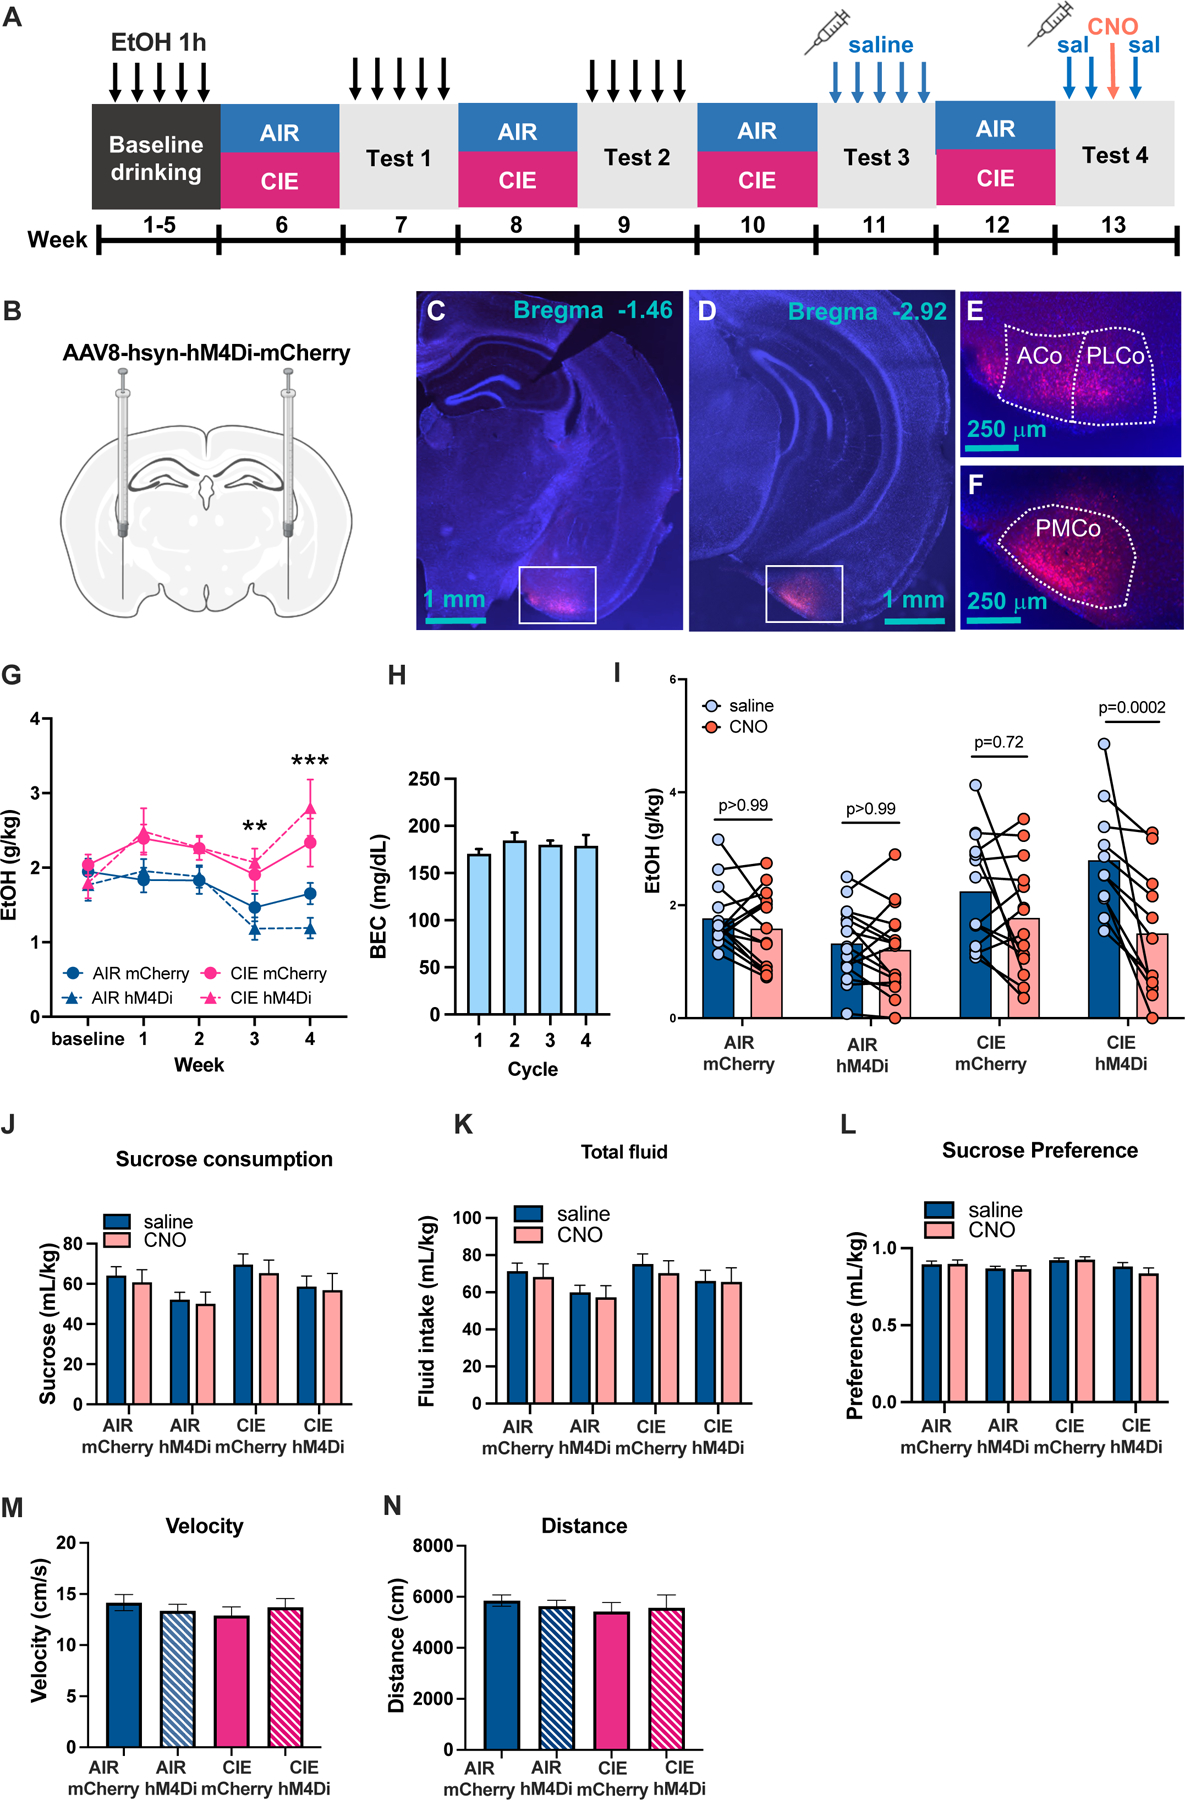
Methods: We used whole-brain c-Fos mapping and network analysis to assess patterns of neuronal activity during alcohol withdrawal and following reaccess in a well-characterized model of alcohol dependence. Mice underwent 4 cycles of chronic intermittent ethanol to increase voluntary alcohol consumption, and a subset underwent forced swim stress to further escalate consumption. Brains were collected either 24 hours (withdrawal) or immediately following a 1-hour period of alcohol reaccess. c-fos counts were obtained for 110 brain regions using iDISCO and ClearMap. Then, we classified mice as high or low drinkers and used graph theory to identify changes in network properties associated with high-drinking behavior.

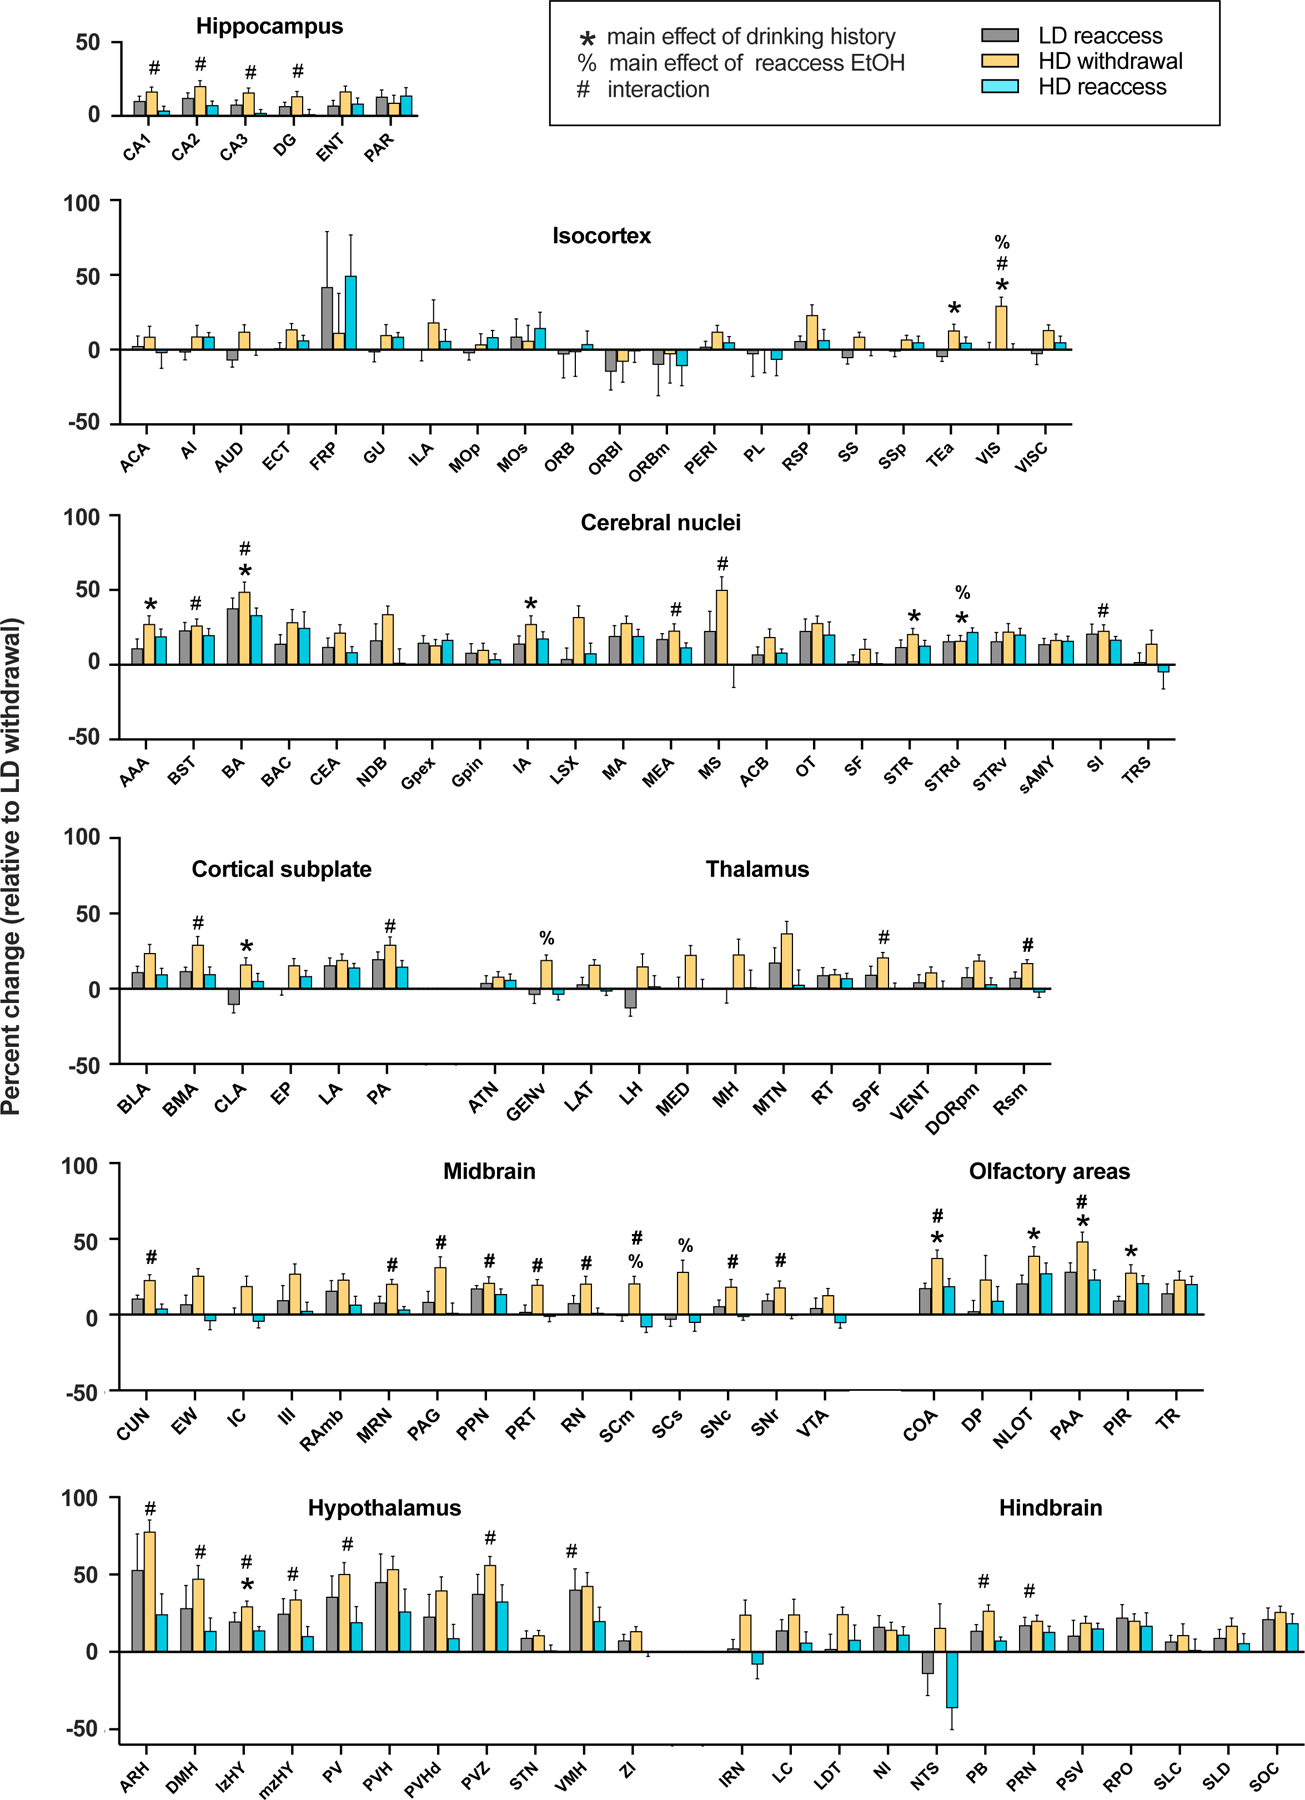
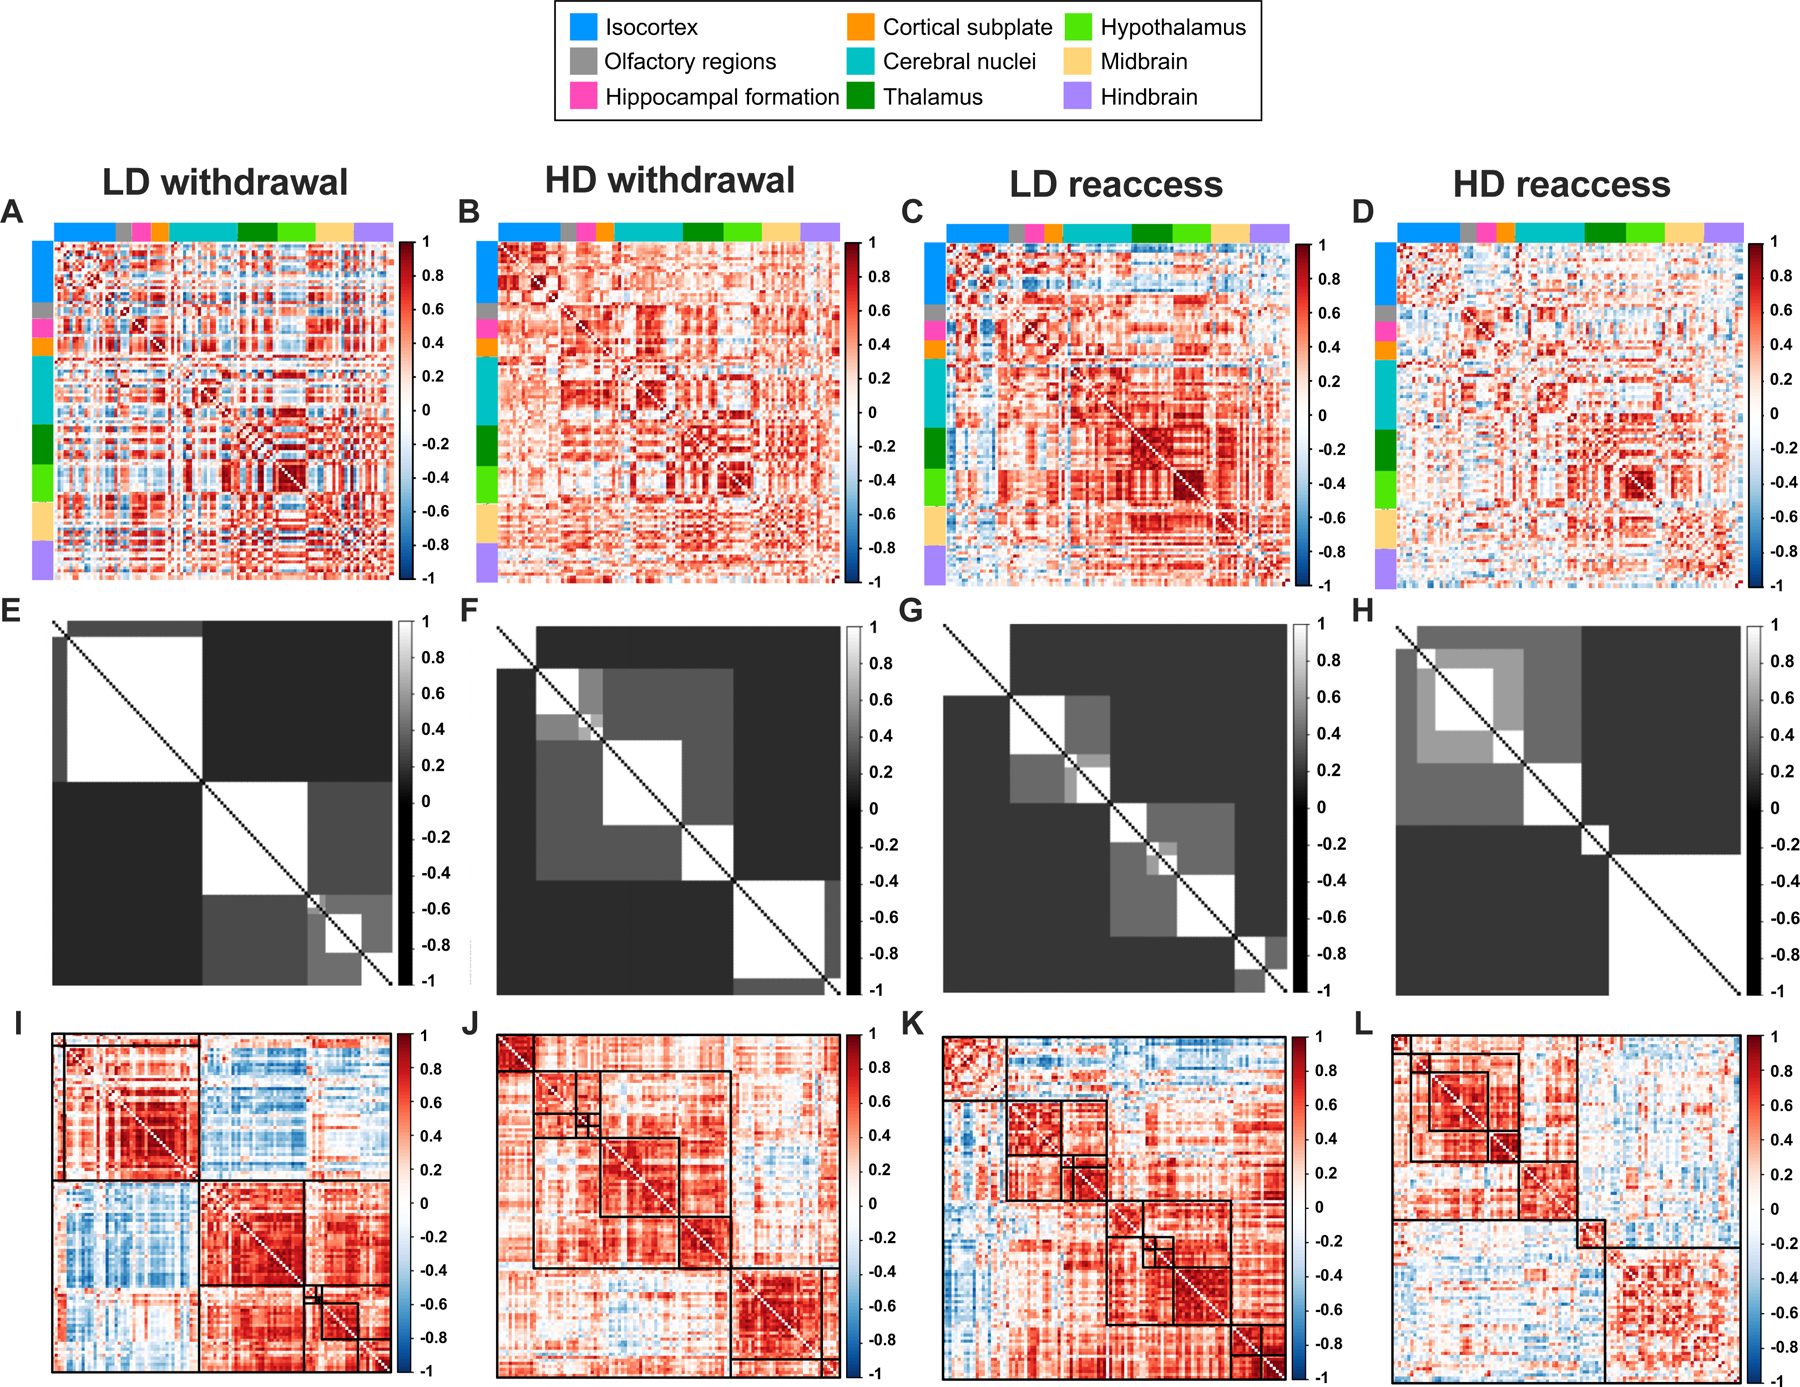
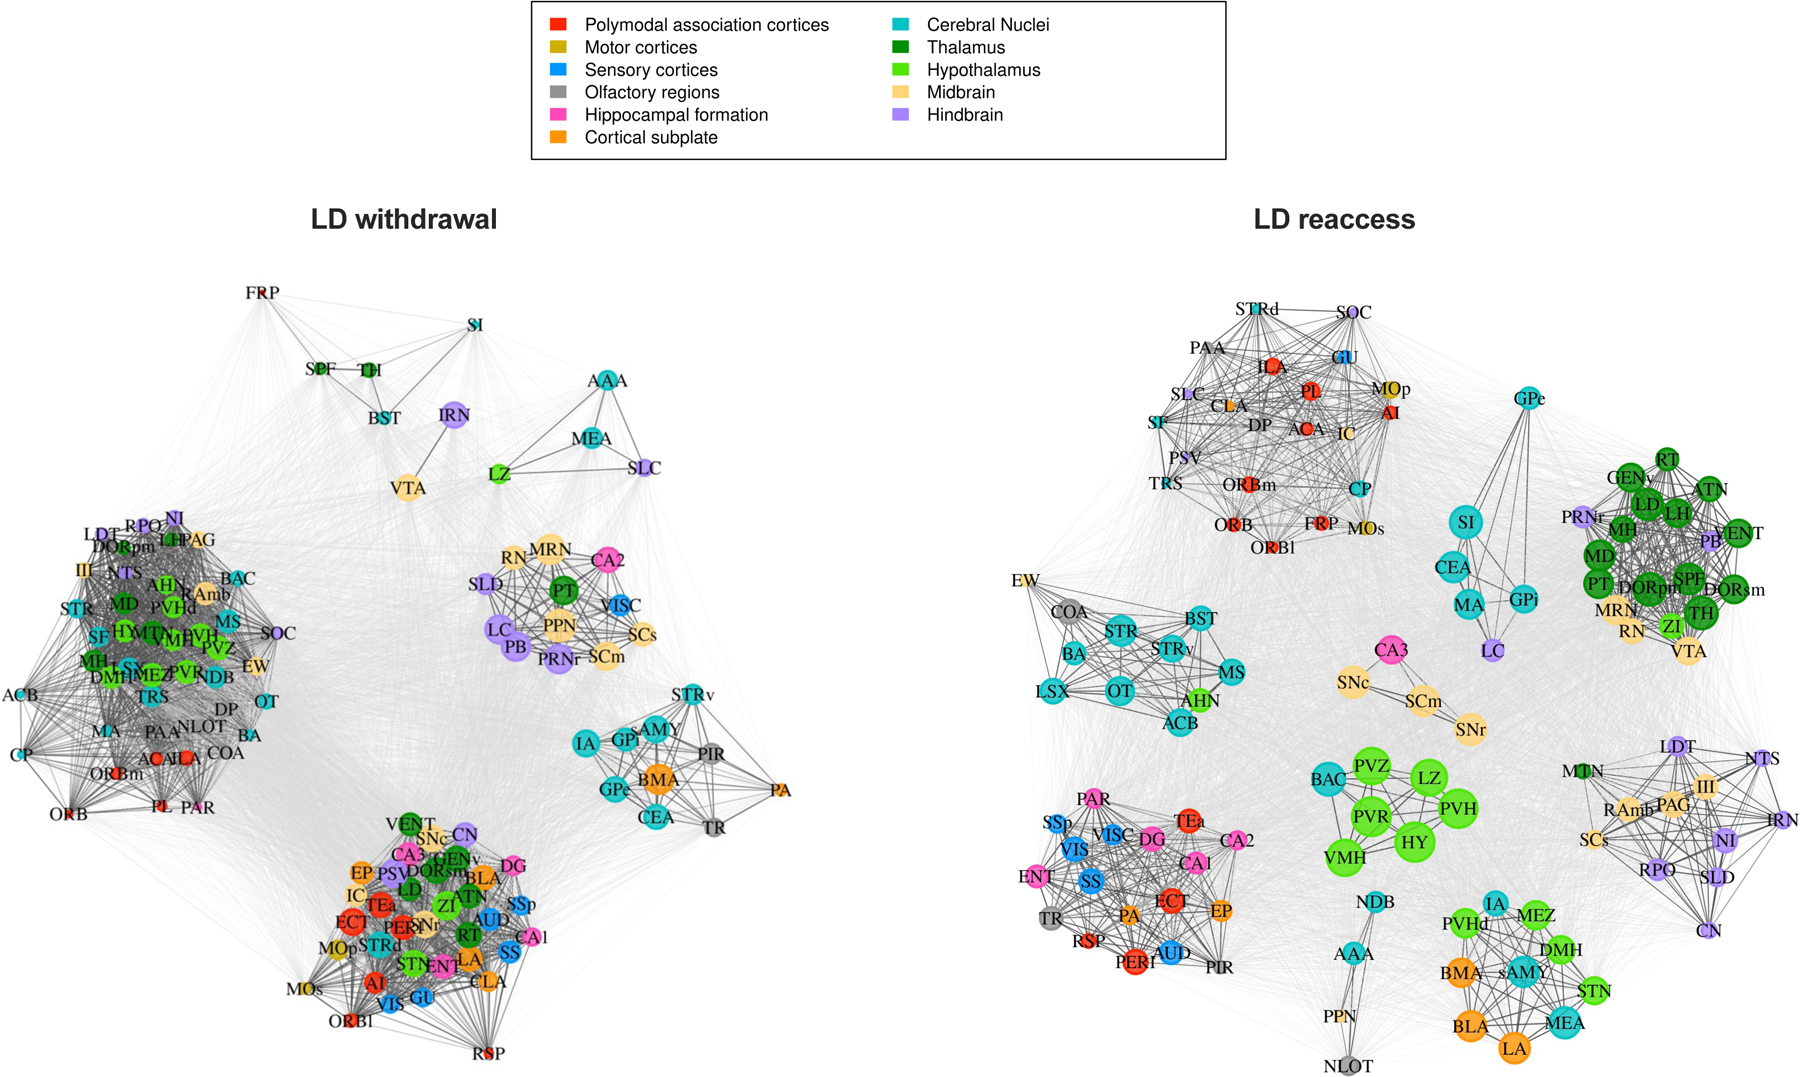
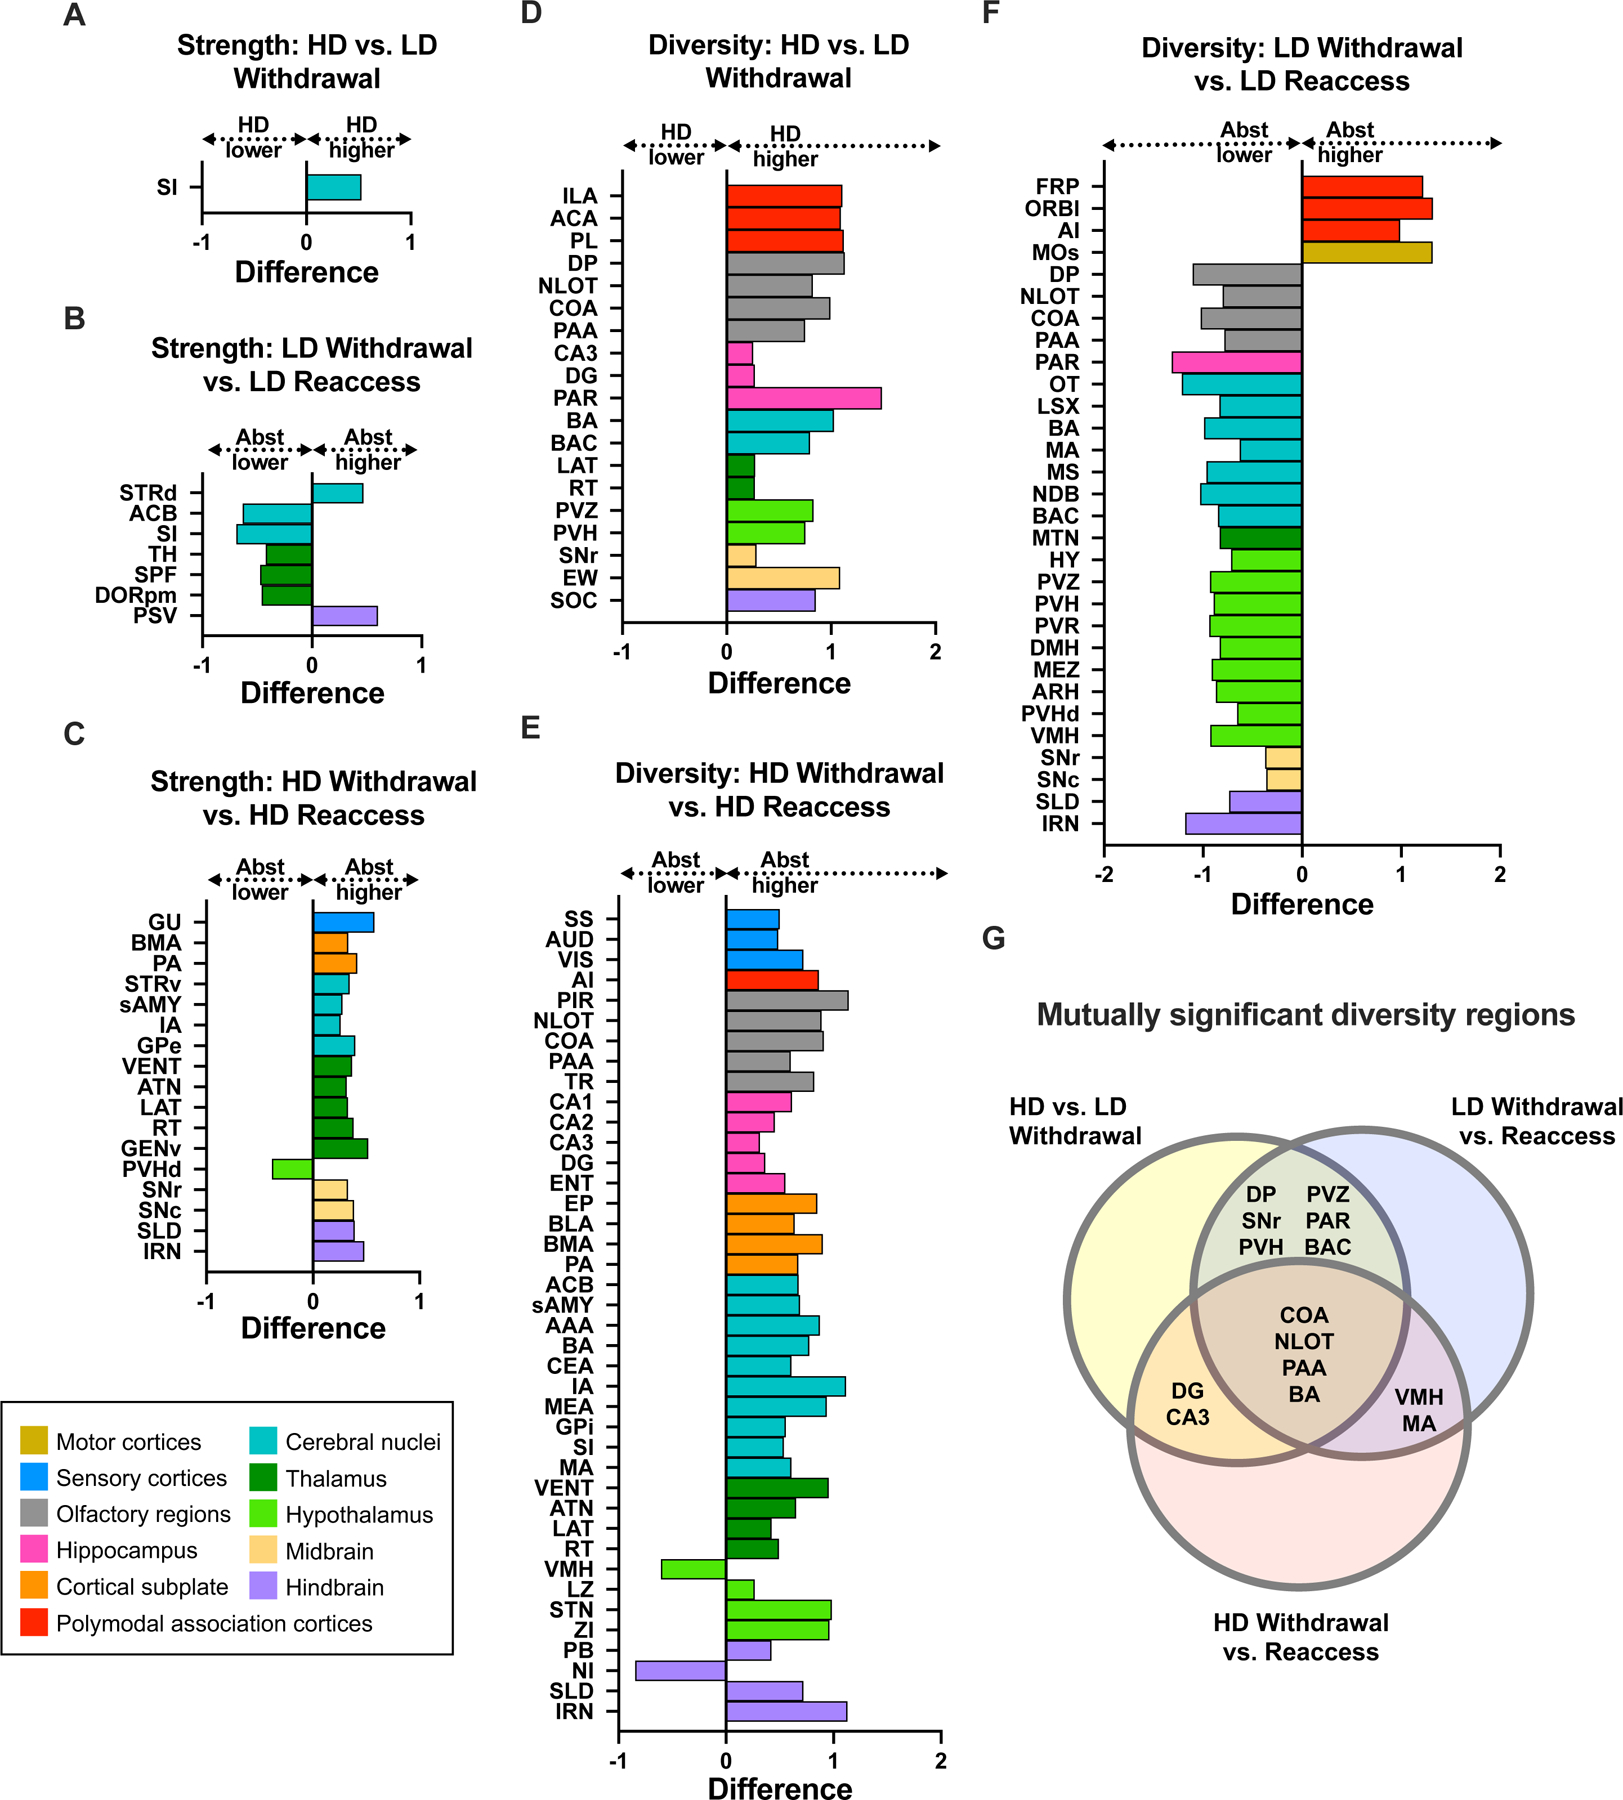
Results: During withdrawal, chronic intermittent ethanol mice displayed widespread increased c-Fos expression relative to air-exposed mice, independent of forced swim stress. Reaccess drinking reversed this increase. Network modularity, a measure of segregation into communities, was increased in high-drinking mice after alcohol reaccess relative to withdrawal. The cortical amygdala showed increased cross-community coactivation during withdrawal in high-drinking mice, and cortical amygdala silencing in chronic intermittent ethanol mice reduced voluntary drinking.

Conclusions: Alcohol withdrawal in dependent mice causes changes in brain network organization that are attenuated by reaccess drinking. Olfactory brain regions, including the cortical amygdala, drive some of these changes and may play an important but underappreciated role in alcohol dependence.

Keywords: Alcohol; Chronic intermittent ethanol; Graph theory; Mice; Networks; c-Fos.


Conflict of interest statement

Conflicts of Interest

The authors report no biomedical financial interests or potential conflicts of interest.

Figures

Figure 1.
Figure 1.
A, Timeline of chronic intermittent ethanol (CIE) and forced swim stress (FSS) treatment. Following 6 weeks of baseline drinking with 15% EtOH for 1h daily, mice underwent four cycles of AIR/CIE. On alternating weeks, mice had 1h daily access to alcohol. A subset of CIE and AIR mice underwent FSS 4h prior to each drinking session. On day 3 of test 4, a subset of mice in each group was sacrificed during withdrawal, with the remaining sacrificed following a 1h drinking session (“reaccess”). B, CIE mice increased their voluntary alcohol intake across the four alcohol vapor exposure cycles. FSS further escalated drinking in CIE but not AIR mice (*, p<0.05 vs. AIR; ^, p<0.05 vs. CIE). C, Blood ethanol concentrations (BEC) during the four alcohol vapor exposure weeks. BECs did not differ between CIE and CIE+FSS mice (p>0.05). D, For network analysis, mice were divided into groups of low and high drinkers (LD and HD, respectively) based on intake below or above the mean of 2.7 g/kg averaged across tests 3 and 4, indicated by the dotted gray line. Only one CIE mouse showed consumption below this cutoff. E, During the final reaccess drinking session, alcohol intake was significantly higher in HD vs. LD mice (p<0.0001).
Figure 2.
Figure 2.
A, Relative c-fos expression in high- (HD) and low-drinking (LD) mice during acute (24h) alcohol withdrawal and following a 1h alcohol reaccess period. C-fos-positive cell counts for each region are represented as the percent change relative to LD mice during withdrawal. Regions are grouped by anatomical subdivision according to the Allen Brain Atlas. * denotes a significant main effect of drinking history; % denotes a significant main effect of reaccess EtOH drinking; and # denotes a significant interaction between drinking history and alcohol reaccess (2-way ANOVA with FDR correction for multiple comparisons). Post-hoc test p-values are available in Table S3.
Figure 3.
Figure 3.
A-D, Pearson correlation matrices showing interregional correlations for the 110 brain regions included in the network analysis for low-drinking (LD) and high-drinking (HD) mice during alcohol withdrawal and following alcohol reaccess. Regions are grouped by anatomical division according to the Allen Brain Atlas. E-H, Hierarchical consensus clustering (HCC) plots illustrating the community partitions of highly correlated regions. I-L, Correlation matrices derived from the HCC procedure illustrating the clustering of strongly correlated regions, denoted by darker shades of red.
Figure 4.
Figure 4.
Network communities for low-drinking (LD) mice in the withdrawal and reaccess conditions. Regions are color-coded according to anatomical groups defined by the Allen Brain Atlas. The size of each node in a community represents the within-community strength, whereas the strength of individual connections is represented by the edge length, i.e., the distance between nodes.
Figure 5.
Figure 5.
Network communities for high-drinking (HD) mice in the withdrawal and reaccess conditions. Regions are color-coded according to anatomical groups defined by the Allen Brain Atlas. The size of each node in a community represents the within-community strength, whereas the strength of individual connections is represented by the edge length, i.e., the distance between nodes.
Figure 6.
Figure 6.
Significantly different brain regions for within-community strength and diversity coefficient comparisons. A-C, Differences in within-community strength between high drinkers (HD) and low drinkers (LD) during withdrawal (A), LD withdrawal and reaccess (B), and HD withdrawal and reaccess (C). D-F, Differences in regional diversity coefficients between HD and LD withdrawal (D), HD withdrawal and reaccess (E), and LD withdrawal and reaccess (F). G, Regions with significantly different diversity coefficients shared across multiple 2-condition comparisons. A complete list of p values is available in Table S5.
Figure 7.
Figure 7.
A, Experimental Timeline. Following 5 weeks of baseline drinking of 15% EtOH daily for 1h, mice underwent 4 cycles of AIR/CIE vapor with alternating weeks of daily 1h alcohol access. During drinking tests 3 and 4, mice received daily saline injections 30 min prior to drinking. On day 3 of test 4, mice were injected with 3 mg/kg CNO instead of saline. B, Viral injection schematic. C-F, Representative images of viral placements in cortical amygdala showing a subject with anterior placement (C,E) and a subject with posterior placement (D,F). G, Alcohol intake was higher in CIE than AIR mice during test weeks 3 and 4, with no effect of mCherry vs. hM4Di genotype. H, BECs were relatively stable in CIE mice across the four vapor exposure weeks. I, CNO reduced drinking selectively in CIE mice expressing hM4Di virus. J-L, Sucrose consumption (J), total fluid consumption (K), and sucrose preference (L) were unaffected by CNO (p>0.05). We detected a main effect of hM4Di virus to reduce sucrose drinking independent of CIE or CNO treatment (p<0.05). M-N, Locomotor activity measured via distance traveled (M) and mean velocity (N) did not differ based on virus or CIE exposure after CNO administration (p>0.05).

Comment in

References

    1. Heilig M, Koob GF (2007): A key role for corticotropin-releasing factor in alcohol dependence. Trends Neurosci 30: 399–406. - PMC - PubMed
    1. Koob GF (2008): A Role for Brain Stress Systems in Addiction. Neuron 59: 11–34. - PMC - PubMed
    1. Becker HC (2013): Animal models of excessive alcohol consumption in rodents. Curr Top Behav Neurosci 13: 355–377. - PubMed
    1. Metten P, Sorensen ML, Cameron AJ, Yu C-H, Crabbe JC (2010): Withdrawal severity after chronic intermittent ethanol in inbred mouse strains. Alcohol Clin Exp Res 34: 1552–1564. - PMC - PubMed
    1. Logan RW, Seggio JA, Robinson SL, Richard GR, Rosenwasser AM (2010): Circadian wheel-running activity during withdrawal from chronic intermittent ethanol exposure in mice. Alcohol Fayettev N 44: 239–244. - PMC - PubMed

Publication types