

Utility of new image-derived biomarkers for autosomal dominant polycystic kidney disease prognosis using automated instance cyst segmentation
- PMID: 36736536
- PMCID: PMC10363210
- DOI: 10.1016/j.kint.2023.01.010
Utility of new image-derived biomarkers for autosomal dominant polycystic kidney disease prognosis using automated instance cyst segmentation
Abstract
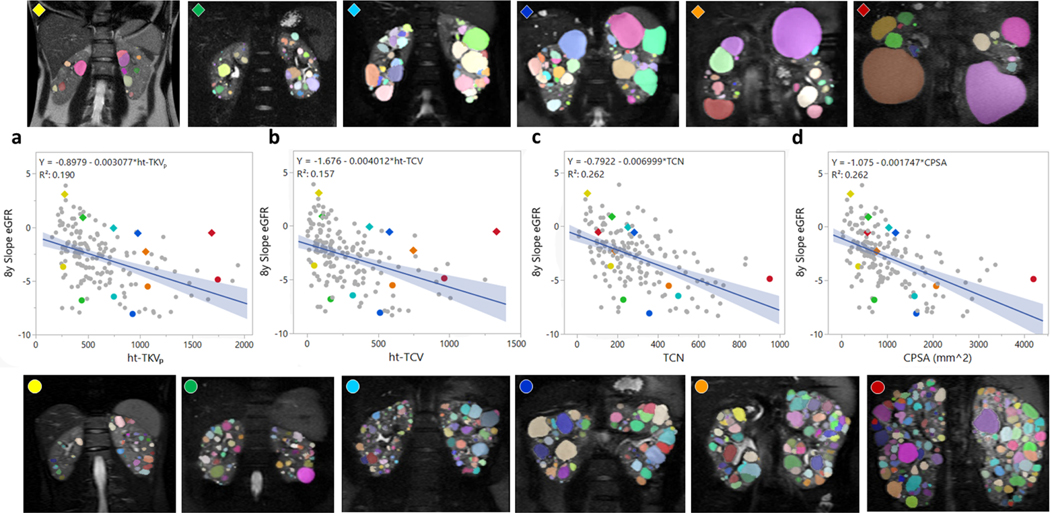
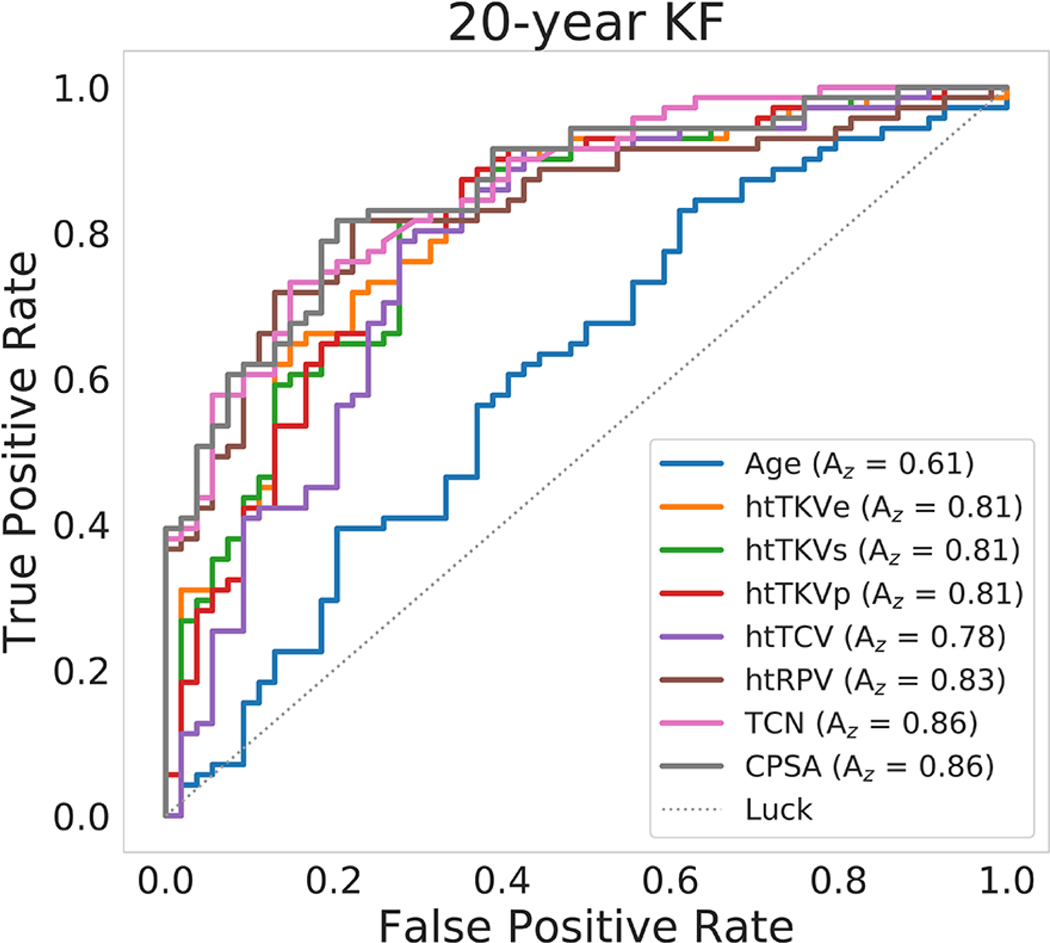
New image-derived biomarkers for patients affected by autosomal dominant polycystic kidney disease are needed to improve current clinical management. The measurement of total kidney volume (TKV) provides critical information for clinicians to drive care decisions. However, patients with similar TKV may present with very different phenotypes, often requiring subjective decisions based on other factors (e.g., appearance of healthy kidney parenchyma, a few cysts contributing significantly to overall TKV, etc.). In this study, we describe a new technique to individually segment cysts and quantify biometric parameters including cyst volume, cyst number, parenchyma volume, and cyst parenchyma surface area. Using data from the Consortium for Radiologic Imaging Studies of Polycystic Kidney Disease (CRISP) study the utility of these new parameters was explored, both quantitatively as well as visually. Total cyst number and cyst parenchyma surface area showed superior prediction of the slope of estimated glomerular filtration rate decline, kidney failure and chronic kidney disease stages 3A, 3B, and 4, compared to TKV. In addition, presentations such as a few large cysts contributing significantly to overall kidney volume were shown to be much better stratified in terms of outcome predictions. Thus, these new image biomarkers, which can be obtained automatically, will have great utility in future studies and clinical care for patients affected by autosomal dominant polycystic kidney disease.
Keywords: disease prognosis; glomerular filtration rate; imaging biomarkers; instance segmentation; outcome prediction; polycystic kidney disease.
Copyright © 2023 International Society of Nephrology. Published by Elsevier Inc. All rights reserved.
Conflict of interest statement
DISCLOSURE STATEMENT
None of the authors have financial interests to disclose and the authors declare no conflicts of interest.
Figures
Comment in
-
Function follows form: the quest for the best prognostic imaging biomarker in ADPKD.Kidney Int. 2023 Aug;104(2):239-241. doi: 10.1016/j.kint.2023.05.023. Kidney Int. 2023. PMID: 37479385
References
-
- Grantham JJ, Torres VE, Chapman AB, et al. Volume progression in polycystic kidney disease. N Engl J Med 2006; 354: 2122–2130. - PubMed
-
- Caroli A, Perico N, Perna A, et al. Effect of longacting somatostatin analogue on kidney and cyst growth in autosomal dominant polycystic kidney disease (ALADIN): a randomised, placebo-controlled, multicentre trial. Lancet 2013; 382: 1485–1495. - PubMed
-
- Wallace DP, Hou YP, Huang ZL, et al. Tracking kidney volume in mice with polycystic kidney disease by magnetic resonance imaging. Kidney Int 2008; 73: 778–781. - PubMed
Publication types
MeSH terms
Substances
Grants and funding
LinkOut - more resources
Full Text Sources
