. 2023;15(5):1161-1179.
doi: 10.1016/j.jcmgh.2023.01.010. Epub 2023 Feb 2.

Intrinsic STING Switches off Pathogenetic Programs of Th1 Cells to Inhibit Colitis

Affiliations

Intrinsic STING Switches off Pathogenetic Programs of Th1 Cells to Inhibit Colitis

Wenjing Yang et al. Cell Mol Gastroenterol Hepatol. 2023.

Abstract

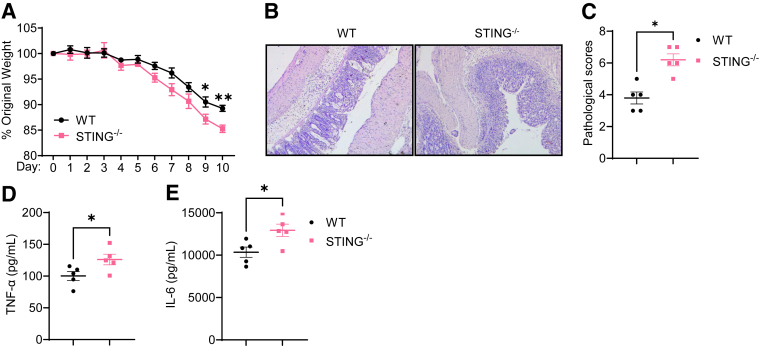
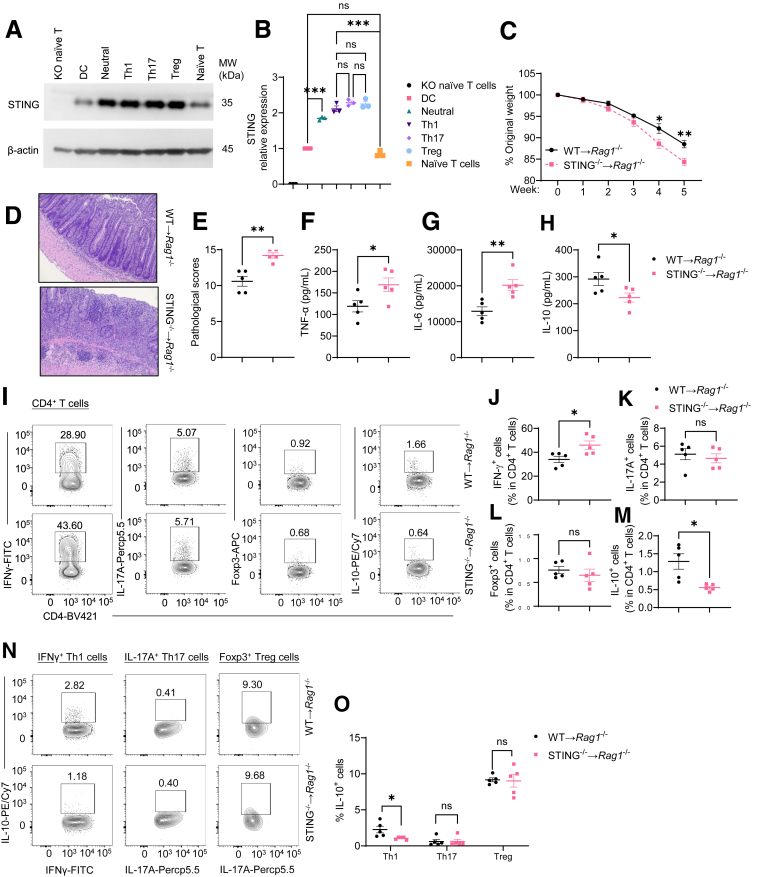
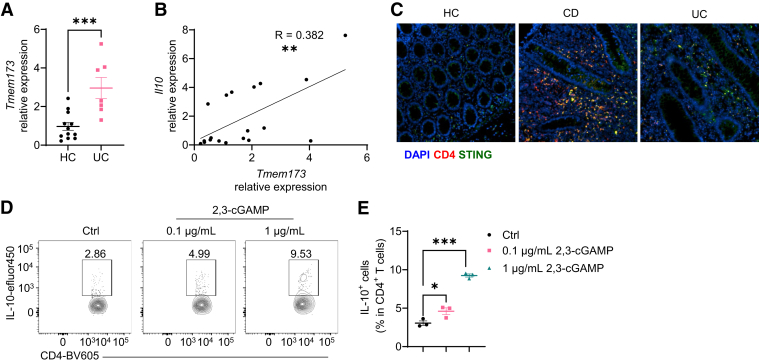
Background & aims: T helper 1 (Th1) effector cells are implicated in inflammatory bowel disease. The stimulator of interferon genes (STING), an intracellular DNA sensor, has been shown to regulate infection and various cancers. However, whether and how intrinsic STING signaling in Th1 cells regulates colitis is still unknown.

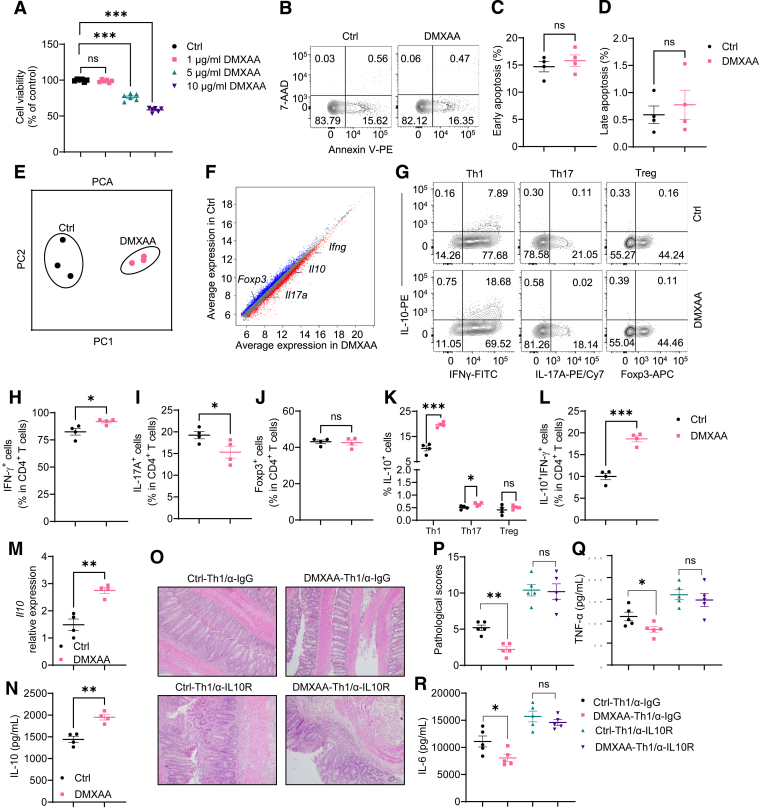
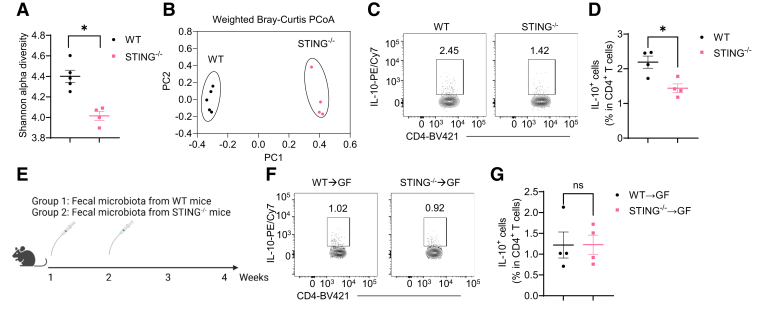
Methods: Dextran sodium sulfate-induced colitis and wild-type/STING-deficient CD4+T cell adoptive transfer models were used to analyze the role of STING in regulating colitis. The effect of STING on Th1 cells was determined by flow cytometry, RNA sequencing, metabolic assays, and mitochondrial functions. 16S ribosomal RNA sequencing and germ-free mice were used to investigate whether the microbiota were involved. The in vivo effect of STING agonist in murine colitis was determined. The expression and role of STING in human T cells were also determined.

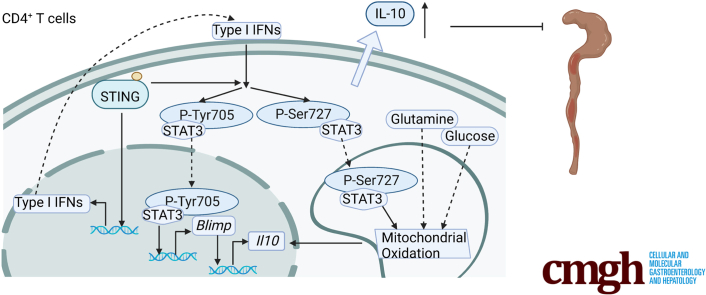
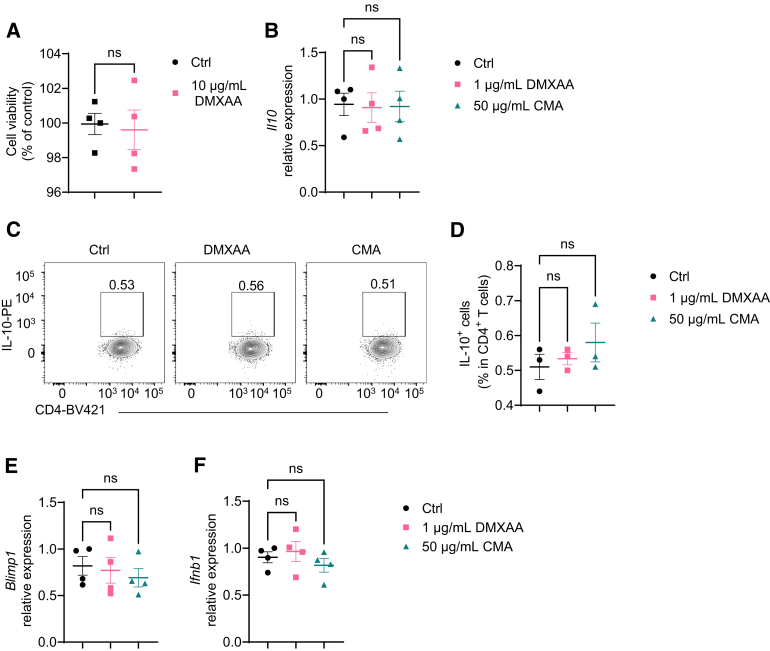
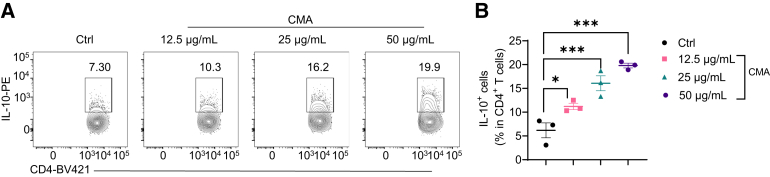
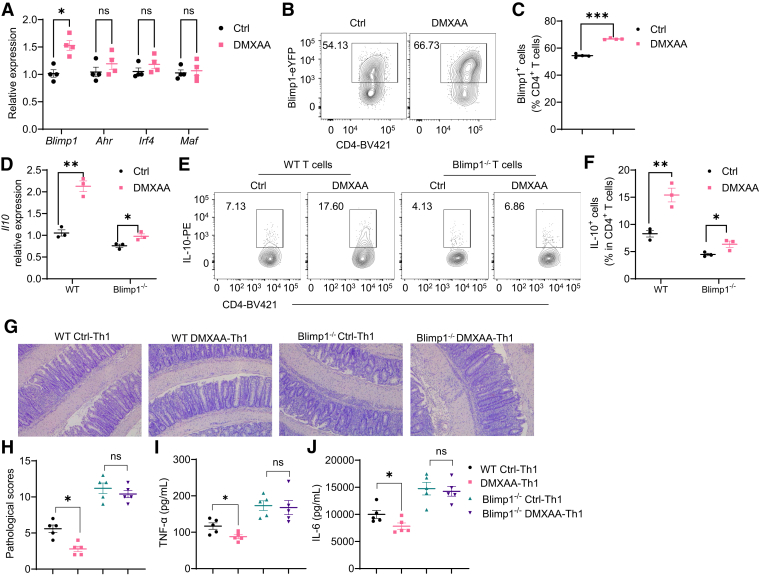
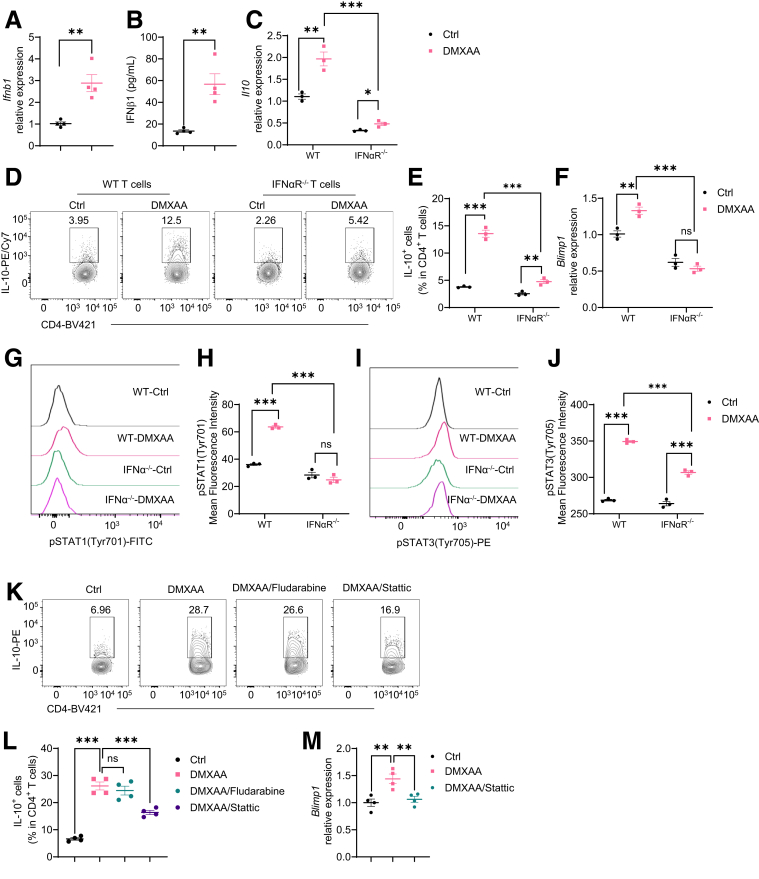
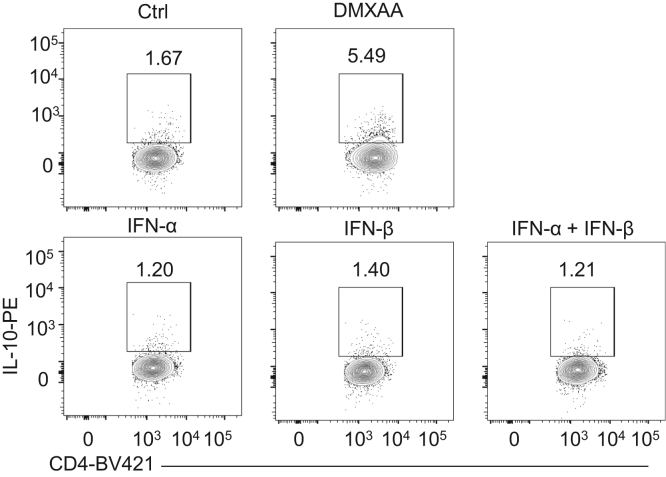
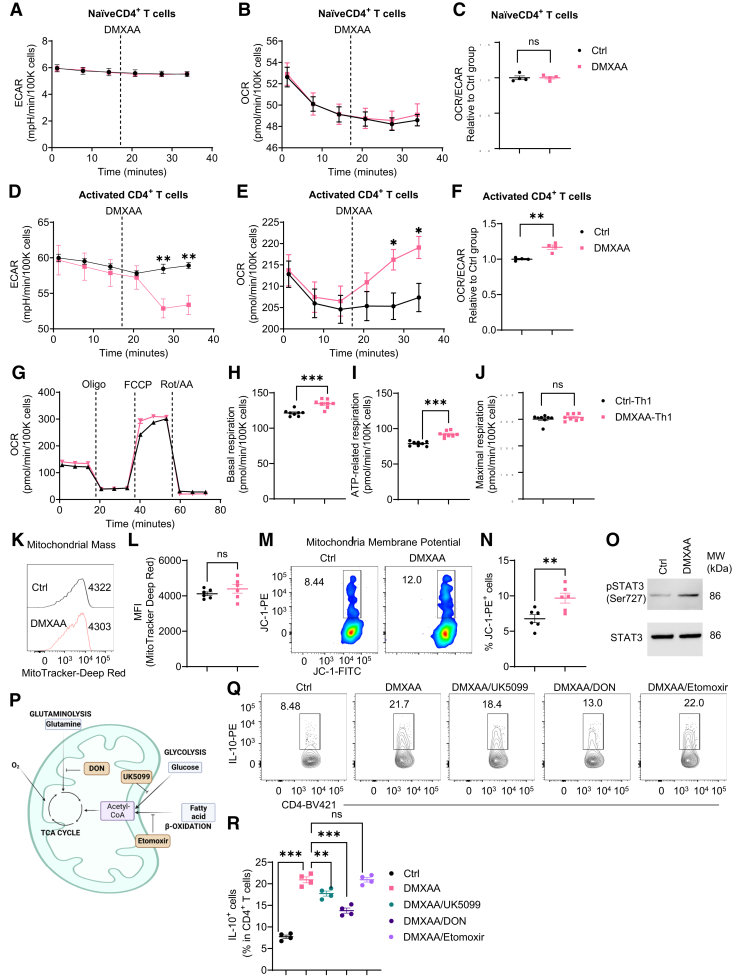
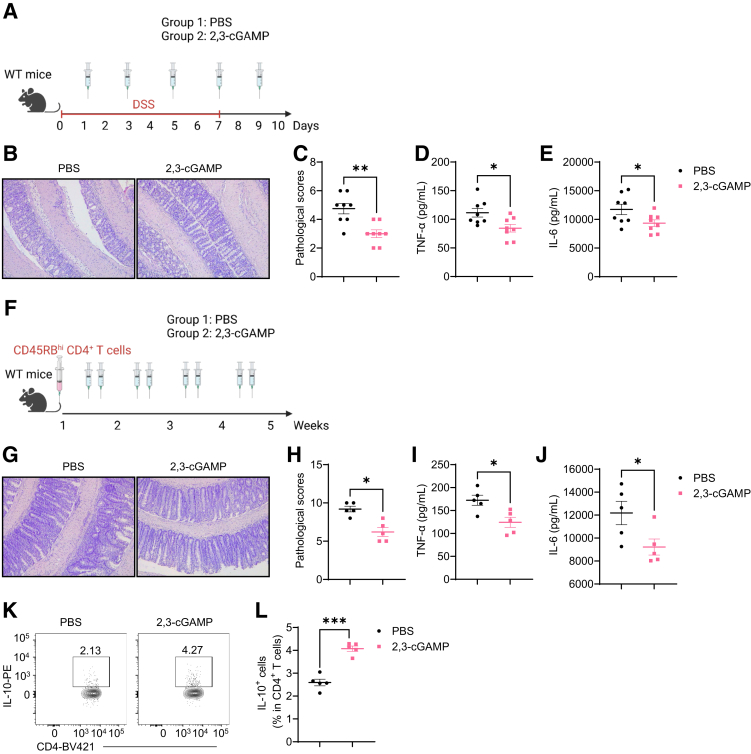
Results: Activation of STING transformed proinflammatory IFNγ+Th1 cells into IL-10+IFNγ+Th1 cells, which were dramatically less pathogenic in inducing colitis. STING promoted Th1 interleukin (IL)-10 production by inducing STAT3 translocation into nuclear and mitochondria, which promoted Blimp1 expression and mitochondrial oxidation, respectively. Blockade of glucose or glutamine-derived oxidation, but not lipid-derived oxidation, suppressed STING induction of IL-10. Gut microbiota were changed in STING-/- mice, but the altered microbiota did not mediate STING effects on intestinal CD4+T cell production of IL-10. Translationally, STING agonists suppressed both acute and chronic colitis. Intestinal STING+ CD4+T cells were increased in inflammatory bowel disease patients, and STING agonists upregulated IL-10 production in human CD4+T cells.

Conclusions: These findings establish a crucial role of T cell-intrinsic STING in switching off the pathogenic programs of Th1 cells in intestinal inflammation.

Keywords: Colitis; Mitochondrial Oxidation; STING; Th1 Cells.


Figures

None
Graphical abstract
Figure 1
Figure 1
STING–/–mice are more susceptible to DSS-induced acute colitis. WT mice and STING–/– mice were administered 2% DSS (w/v) in drinking water for 7 days and then normal drinking for additional 3 days. Mice were sacrificed on day 10. (A) Weight change. (B) Representative colonic histological images. (C) Pathological scores. (D) Intestinal TNF-α production. (E) Intestinal IL-6 production. Data were shown as mean ± SEM. One representative of 2 independent experiments. (A, D, E) Unpaired Student’s t test; (C) Mann-Whitney U test. ∗P < .01, ∗∗P < .01.
Figure 2
Figure 2
STING-deficient CD4+T cells induce more severe colitis in Rag1–/–mice. (A, B) STING and β-actin levels were determined in WT dendritic cells (DCs), naïve WT T cells, naïve STING–/– (knockout [KO]) T cells, and WT T cells cultured on neutral, Th1, Th17, and Treg conditions by Western blot (n = 3/group). (A) Western blot bands. (B) STING relative expression. (C–O) WT or STING-deficient CD4+ CD45Rbhi T cells were intravenously transferred into Rag1–/– mice (n = 5/group). The recipient Rag1–/– mice were sacrificed 5 weeks later. (C) The weight changes of the recipient Rag1–/– mice. (D) Representative intestinal histological images. (E) Pathological scores. (F) Intestinal TNF-α production. (G) Intestinal IL-6 production. (H) Intestinal IL-10 production. (I) Representative flow cytometry plots of intestinal IFNγ+, IL-17A+, Foxp3+, and IL-10+ CD4+ T cells. (J–M) Dot plots of IFNγ+, IL-17A+, Foxp3+, and IL-10+ CD4+ T cells. (N) Representative flow cytometry plots of IL-10+ Th1, IL-10+ Th17, and IL-10+ Treg cells. (O) Dot plots of IL-10+ Th1, IL-10+ Th17, and IL-10+ Treg cells. Data were shown as mean ± SEM. (A, B) Data were pooled from 3 independent experiments. (C–O) One representative of 3 independent experiments. (A) 1-way analysis of variance with Tukey’s multiple comparisons test; (C, F, G, I, J, K, L, M, N) unpaired Student’s t test; (E) Mann-Whitney U test. ∗P < .05, ∗∗P < .01, ∗∗∗P < .001. ns, not significant.
Figure 3
Figure 3
STING agonist suppresses Th1 pathogenicity in inducing colitis through upregulation of IL-10. (A) Mouse splenic CD4+ T cells were activated with anti-CD3 (5 μg/mL) and anti-CD28 (2 μg/mL) antibodies in the presence or absence of DMXAA at the concentration of 1 μg/mL, 5 μg/mL, or 10 μg/mL. The cell viability was determined by the Resazurin viability assay 2 days later (n = 6/group). (B–D) Mouse splenic CD4+ T cells were activated with anti-CD3 (5 μg/mL) and anti-CD28 (2 μg/mL) antibodies in the presence or absence of DMXAA (1 μg/mL) for 2 days (n = 4/group). (B) Representative flow cytometry plots of apoptosis in T cells. (C, D) Dot plots of early and late apoptosis levels. (E, F) Mouse splenic CD4+ T cells were activated with anti-CD3 (5 μg/mL) and anti-CD28 (2 μg/mL) antibodies in the presence or absence of DMXAA (1 μg/mL) for 2 days. Cells were collected for bulk RNA sequencing (n = 3/group). (E) Principal component analysis (PCA) of gene profile. (F) Scatter plot of gene expression. (G–L) Mouse splenic CD4+ T cells were activated with anti-CD3 (5 μg/mL) and anti-CD28 (2 μg/mL) antibodies in the presence or absence of DMXAA (1 μg/mL) under Th1, Th17, or Treg conditions, for 5 days (n = 4/group). (G) Representative flow cytometry plots of IFNγ+, IL-17A+, Foxp3+, and IL-10+ CD4+ T cells. (H–L) Dot plots of IFNγ+, IL-17A+, Foxp3+, and IL-10+ CD4+ T cells, and IL-10+ IFNγ+ CD4+ T cells. (M, N) Mouse splenic CD4+ T cells were activated with anti-CD3 (5 μg/mL) and anti-CD28 (2 μg/mL) antibodies in the presence or absence of DMXAA (1 μg/mL) under Th1 conditions for 2 days (n = 4/group). (M) Il10 relative expression. (N) IL-10 production in cell culture supernatants. (O–R) Control or DMXAA-pretreated Th1 cells were intravenously transferred to Rag1–/– mice. The recipient Rag1–/– mice were peritoneally injected with anti-IL-10R antibody (25 mg/kg) or anti-IgG as control every other day (n = 5/group). The recipient Rag1–/– mice were sacrificed after 6 weeks. (O) Representative intestinal histological images. (P) Pathological scores. (Q) Intestinal TNF-α production. (R) Intestinal IL-6 production. Data were shown as mean ± SEM. One representative of (O–R) 2 or (A–D, G–N) 3 independent experiments. (A) One-way analysis of variance with Dunnett's multiple comparisons test; (C, D, H, I, J, K, L, M, N, Q, R) unpaired Student’s t test; (P) Mann-Whitney U test. ∗P < .05, ∗∗P < .01, ∗∗∗P < .001.
Figure 4
Figure 4
STING agonists do not act on STING-deficient T cells. (A) STING-deficient CD4+ T cells were activated with anti-CD3 (5 μg/mL) and anti-CD28 (2 μg/mL) antibodies in the presence or absence of DMXAA (10 μg/mL). The cell viability was determined by the Resazurin viability assay 2 days later (n = 4/group). (B–F) STING-deficient CD4+ T cells were activated with anti-CD3 (5 μg/mL) and anti-CD28 (2 μg/mL) antibodies in the presence or absence of DMXAA (1 μg/mL) or CMA (50 μg/mL) under Th1 conditions. (B) Il10 relative expression on day 2. (C) Representative flow cytometry plots of IL-10+ CD4+ T cells on day 5. (D) Dot plots of IL-10+ CD4+ T cells on day 5. (E) Blimp1 relative expression on day 2. (F) Ifnb relative expression on day 2. Data were shown as mean ± SEM. One representative of 2 independent experiments. (A) Unpaired Student’s t test; (B, D, E, F) 1-way analysis of variance with Dunnett's multiple comparisons test.
Figure 5
Figure 5
CMA promotes IL-10 production in Th1 cells. Mouse splenic CD4+ T cells were activated with anti-CD3 (5 μg/mL) and anti-CD28 (2 μg/mL) antibodies in the presence or absence of CMA at indicated concentrations under Th1 conditions for 5 days (n = 4/group). (G) Representative flow cytometry plots of IL-10+ CD4+ T cells. (H–L) Dot plots of IL-10+ IFNγ+ CD4+ T cells. Data were shown as mean ± SEM. One representative of 3 independent experiments. (B) One-way analysis of variance with Dunnett's multiple comparisons test. ∗P < .05, ∗∗∗P < .001.
Figure 6
Figure 6
Blimp1 mediates STING regulation of Th1 cell pathogenicity. (A, B) Mouse splenic CD4+ T cells were activated with anti-CD3 (5 μg/mL) and anti-CD28 (2 μg/mL) antibodies in the presence or absence of DMXAA (1 μg/mL) under Th1 conditions for 2 days (n = 4/group), and Blimp1, Ahr, Irf4, and Maf were determined by quantitative reverse-transcriptase polymerase chain reaction. (B, C) Splenic CD4+ T cells were isolated from Blimp1-eYFP mice and activated with anti-CD3 (5 μg/mL) and anti-CD28 (2 μg/mL) antibodies in the presence or absence of DMXAA (1 μg/mL) under Th1 conditions for 3 days (n = 4/group). (B) Representative flow cytometry plots of Blimp1+ CD4+ T cells. (C) Dot plots of Blimp1+ CD4+ T cells. (D-F) WT and Blimp1-deficient CD4+ T cells were activated with anti-CD3 (5 μg/mL) and anti-CD28 (2 μg/mL) antibodies in the presence or absence of DMXAA (1 μg/mL) under Th1 conditions for (D) 2 or (E, F) 5 days (n = 3/group). (D) Il10 relative expression was determined. (E) Representative flow cytometry plots of IL-10+ CD4+ T cells. (F) Dot plots of IL-10+ CD4+ T cells. (G–J) Control or DMXAA-pretreated WT or Blimp1-deficient Th1 cells were intravenously transferred to Rag1–/– mice. The recipient Rag1–/– mice were sacrificed after 6 weeks (n = 5/group). (G) Representative intestinal histological images. (H) Pathological scores. (I) Intestinal TNF-α production. (J) Intestinal IL-6 production. Data were shown as mean ± SEM. One representative of (G–J) 2 or (A–F) 3 independent experiments. (A, C, D, F, I, J) Unpaired Student’s t test; (H) Mann-Whitney U test. ∗P < .05, ∗∗P < .01, ∗∗∗P < .001.
Figure 7
Figure 7
Type I IFN/STAT3 pathway is involved in STING induction of IL-10 production in Th1 cells. (A, B) Mouse splenic CD4+ T cells were activated with anti-CD3 (5 μg/mL) and anti-CD28 (2 μg/mL) antibodies in the presence or absence of DMXAA (1 μg/mL) under Th1 conditions for 2 days (n = 4/group). (A) Ifnb1 relative expression. (B) IFNβ1 production in cell culture supernatants. (C-F) WT and IFNαR-deficient CD4+ T cells were activated with anti-CD3 (5 μg/mL) and anti-CD28 (2 μg/mL) antibodies in the presence or absence of DMXAA (1 μg/mL) under Th1 conditions for (C, F) 2 or (D, E) 5 days (n = 3/group). (C) Il10 relative expression was determined. (D) Representative flow cytometry plots of IL-10+ CD4+ T cells. (E) Dot plots of IL-10+ CD4+ T cells. (F) Blimp1 relative expression. (GJ) WT and IFNα receptor (IFNαR)–deficient CD4+ T cells were activated with anti-CD3 (5 μg/mL) and anti-CD28 (2 μg/mL) antibodies in the presence or absence of DMXAA (1 μg/mL) under Th1 conditions for 48 hours. (G) Representative flow cytometry plots of phosphorylated STAT1 (pSTAT1) site Tyr701. (H) Dot plots of pSTAT1 Tyr701 mean fluorescence intensity. (I) Representative flow cytometry plots of phosphorylated STAT3 (pSTAT3) site Tyr705. (J) Dot plots of pSTAT3 Tyr705 mean fluorescence intensity. (K–M) Mouse splenic CD4+ T cells were activated with anti-CD3 (5 μg/mL) and anti-CD28 (2 μg/mL) antibodies in the presence or absence of DMXAA (1 μg/mL) with or without fludarabine (2.5 μM)/static (2.5 μM) under Th1 conditions for (M) 2 or (K, L) 5 days. (K) Representative flow cytometry plots of IL-10+ CD4+ T cells. (L) Dot plots of IL-10+ CD4+ T cells. (M) Blimp1 relative expression. Data were shown as mean ± SEM. One representative of 3 independent experiments. (A, B, C, E, F, H, J) Unpaired Student’s t test; (L, M) 1-way analysis of variance with Dunnett's multiple comparisons test. ∗P < .05, ∗∗P < .01, ∗∗∗P < .001.
Figure 8
Figure 8
Type I IFN alone does not induce IL-10 production in T cells. Mouse splenic CD4+ T cells were activated with anti-CD3 (5 μg/mL) and anti-CD28 (2 μg/mL) antibodies in the presence or absence of DMXAA (1 μg/mL), IFNα (5 ng/mL), IFNβ (5 ng/mL), or IFNα (5 ng/mL) and IFNβ (5 ng/mL) for 5 days. Representative flow cytometry plots of IL-10+ CD4+ T cells. Data were shown as mean ± SEM. One representative of 2 independent experiments.
Figure 9
Figure 9
STING agonist modulates T cell metabolism to upregulate IL-10 production in Th1 cells. (A–C) The real-time levels of (A) ECAR and (B) OCR in splenic naïve CD4+ T cells were measured before and after treatment of DMXAA (1 μg/mL) using an extracellular flux Seahorse analyzer (n = 4/group). (C) The ratio of OCR/ECAR at the last time point. (D–F) The real-time levels of (D) ECAR and(E) OCR in splenic activated CD4+ T cells were measured before and after treatment of DMXAA (1 μg/mL) using an extracellular flux Seahorse analyzer (n = 4/ group). (F) The ratio of OCR/ECAR at the last time point. (G-J) The parameters of mitochondrial respiration in control Th1 and DMXAA-pretreated Th1 cells were measured by a Mito Stress Test Kit (n = 8/group). (G) The OCR profile. (H) Basal respiration. (I) Adenosine triphosphate (ATP)–related respiration. (J) Maximal respiration. (K, L) Representative flow cytometry plots and dot plots of mitochondrial mass in control Th1 and DMXAA-pretreated Th1 cells. (M, N) Representative flow cytometry plots and dot plots of mitochondrial membrane potential in control Th1 and DMXAA-pretreated Th1 cells. (O) Mouse splenic CD4+ T cells were activated with anti-CD3 (5 μg/mL) and anti-CD28 (2 μg/mL) antibodies in the presence or absence of DMXAA (1 μg/mL) under Th1 conditions for 6 hours, and the phosphorylated STAT3 (pSTAT3) site Ser727 and total STAT3 were determined by Western blot. (P) A diagram of different metabolic pathways contributing to mitochondrial oxidation. (Q–R) Mouse splenic CD4+ T cells were activated with anti-CD3 (5 μg/mL) and anti-CD28 (2 μg/mL) antibodies in the presence or absence of DMXAA (1 μg/mL) with or without UK5099 (30 μM)/DON (1 μM)/etomoxir (50 μM) under Th1 conditions for 5 days. (Q) Representative flow cytometry plots of IL-10+ CD4+ T cells. (R) Dot plots of IL-10+ CD4+ T cells. Data were shown as mean ± SEM. One representative of 2 (A-J) or 3 (K-O and Q-R) independent experiments. (C, F, H, I, J, L, N) Unpaired Student’s t test; (R) 1-way analysis of variance with Dunnett's multiple comparisons test. ∗∗P < .01, ∗∗∗P < .001.
Figure 10
Figure 10
STING altered gut microbiota do not mediate STING induction of T cell production of IL-10. (A, B) The Shannon alpha diversity and the principal coordinate analysis (PCoA) of gut microbiota from WT and STING–/– mice (n = 4/group). (C, D) Representative flow cytometry plots and dot plots of intestinal IL-10+ CD4+ T cells in WT and STING–/– mice (n = 4/group). (E–G) Fecal microbiota from WT or STING–/– mice were orally transferred to GF mice twice in the first 2 weeks, and bacteria-recipient mice were sacrificed 4 weeks post–first transfer (n = 4/group). (E) The diagram of the experiment design. (F) Representative flow cytometry plots of intestinal IL-10+ CD4+ T cells. (G) The Dot plots of intestinal IL-10+ CD4+ T cells. Data were shown as mean ± SEM. (A) Mann-Whitney U test; (D and G) unpaired Student’s t test. ∗P < .05.
Figure 11
Figure 11
2,3-cGAMP suppresses intestinal inflammation in DSS-induced acute colitis and T cell-induced chronic colitis models. (A–F) WT mice were administered with 2% DSS (w/v) in drinking water for 7 days and then normal drinking for the last 3 days. One group of mice was intraperitoneally injected with 2,3-cGAMP (0.5 mg/kg) and another group was given phosphate-buffered saline (PBS) as control animals (n = 8/group). Mice were sacrificed on day 10. (A) The diagram of the experiment design. (B) Representative intestinal histological images. (C) Pathological scores. (D) Intestinal TNF-α production levels. (E) Intestinal IL-6 production levels. (F–L) WT CD4+ CD45Rbhi T cells were intravenously transferred into Rag1–/– mice (n = 5/group). The recipient Rag1–/– mice were sacrificed after 5 weeks. (F) The diagram of the experiment design. (G) Representative intestinal histological images. (H) Pathological scores. (I) Intestinal TNF-α production levels. (J) Intestinal IL-6 production levels. (K) Representative flow cytometry plots of intestinal IL-10+ CD4+ T cells. (L) The Dot plots of intestinal IL-10+ CD4+ T cells. Data were shown as mean ± SEM. One representative of 2 independent experiments. (D, E, I, J, L) Unpaired Student’s t test; (C, H) Mann-Whitney U test. ∗P < .01; ∗∗P < .01, ∗∗∗P < .001.
Figure 12
Figure 12
2,3-cGAMP upregulates IL-10 production in human CD4+T cells. (A, B) Colonic biopsies were obtained from healthy control (HC) subjects (n = 12) and patients with UC (n = 7). (A) Temem173 (Sting) expression in colonic biopsies from HC subjects and UC patients. (B) The correlation between Tmem173 and Il10 in intestinal biopsies. (C) Representative immunofluorescence staining of CD4 and STING in colonic tissues microarray. (D, E) Human peripheral blood mononuclear cells were activated with anti-CD3 and anti-CD28 antibodies and then nucleofected with 2,3-cGAMP at the dose of 0.1 μg/mL and 1 μg/mL or phosphate-buffered saline as control condition. Cells were then cultured for 5 days. (D) Representative flow cytometry plots of IL-10+ CD4+ T cells. (E) Dot plots of IL-10+ CD4+ T cells. Data were shown as mean ± SEM. (D, E) One representative of 3 independent experiments. (A) Unpaired Student’s t test; (B) Person correlation analysis; (E) 1-way analysis of variance with Dunnett's multiple comparisons test. ∗P < .05, ∗∗P < .01, ∗∗∗P < .001.

Comment in

  • The STING That Tames Pro-inflammatory T-cells.
    Ngo VL, Gewirtz AT. Ngo VL, et al. Cell Mol Gastroenterol Hepatol. 2023;15(5):1251-1252. doi: 10.1016/j.jcmgh.2023.02.008. Epub 2023 Mar 6. Cell Mol Gastroenterol Hepatol. 2023. PMID: 36893791 Free PMC article. No abstract available.

References

    1. Swain S.L., McKinstry K.K., Strutt T.M. Expanding roles for CD4⁺ T cells in immunity to viruses. Nat Rev Immunol. 2012;12:136–148. - PMC - PubMed
    1. Skapenko A., Leipe J., Lipsky P.E., et al. The role of the T cell in autoimmune inflammation. Arthritis Res Ther. 2005;7:S4–S14. - PMC - PubMed
    1. Tay R.E., Richardson E.K., Toh H.C. Revisiting the role of CD4(+) T cells in cancer immunotherapy-new insights into old paradigms. Cancer Gene Ther. 2021;28:5–17. - PMC - PubMed
    1. Jäger A., Kuchroo V.K. Effector and regulatory T cell subsets in autoimmunity and tissue inflammation. Scand J Immunol. 2010;72:173–184. - PMC - PubMed
    1. Lafaille J.J. The role of helper T cell subsets in autoimmune diseases. Cytokine Growth Factor Rev. 1998;9:139–151. - PubMed

Publication types