. 2023 May;77(3):e22264.
doi: 10.1002/syn.22264. Epub 2023 Feb 18.

Spinophilin-dependent regulation of GluN2B-containing NMDAR-dependent calcium influx, GluN2B surface expression, and cleaved caspase expression

Affiliations

Spinophilin-dependent regulation of GluN2B-containing NMDAR-dependent calcium influx, GluN2B surface expression, and cleaved caspase expression

Asma B Salek et al. Synapse. 2023 May.

Abstract

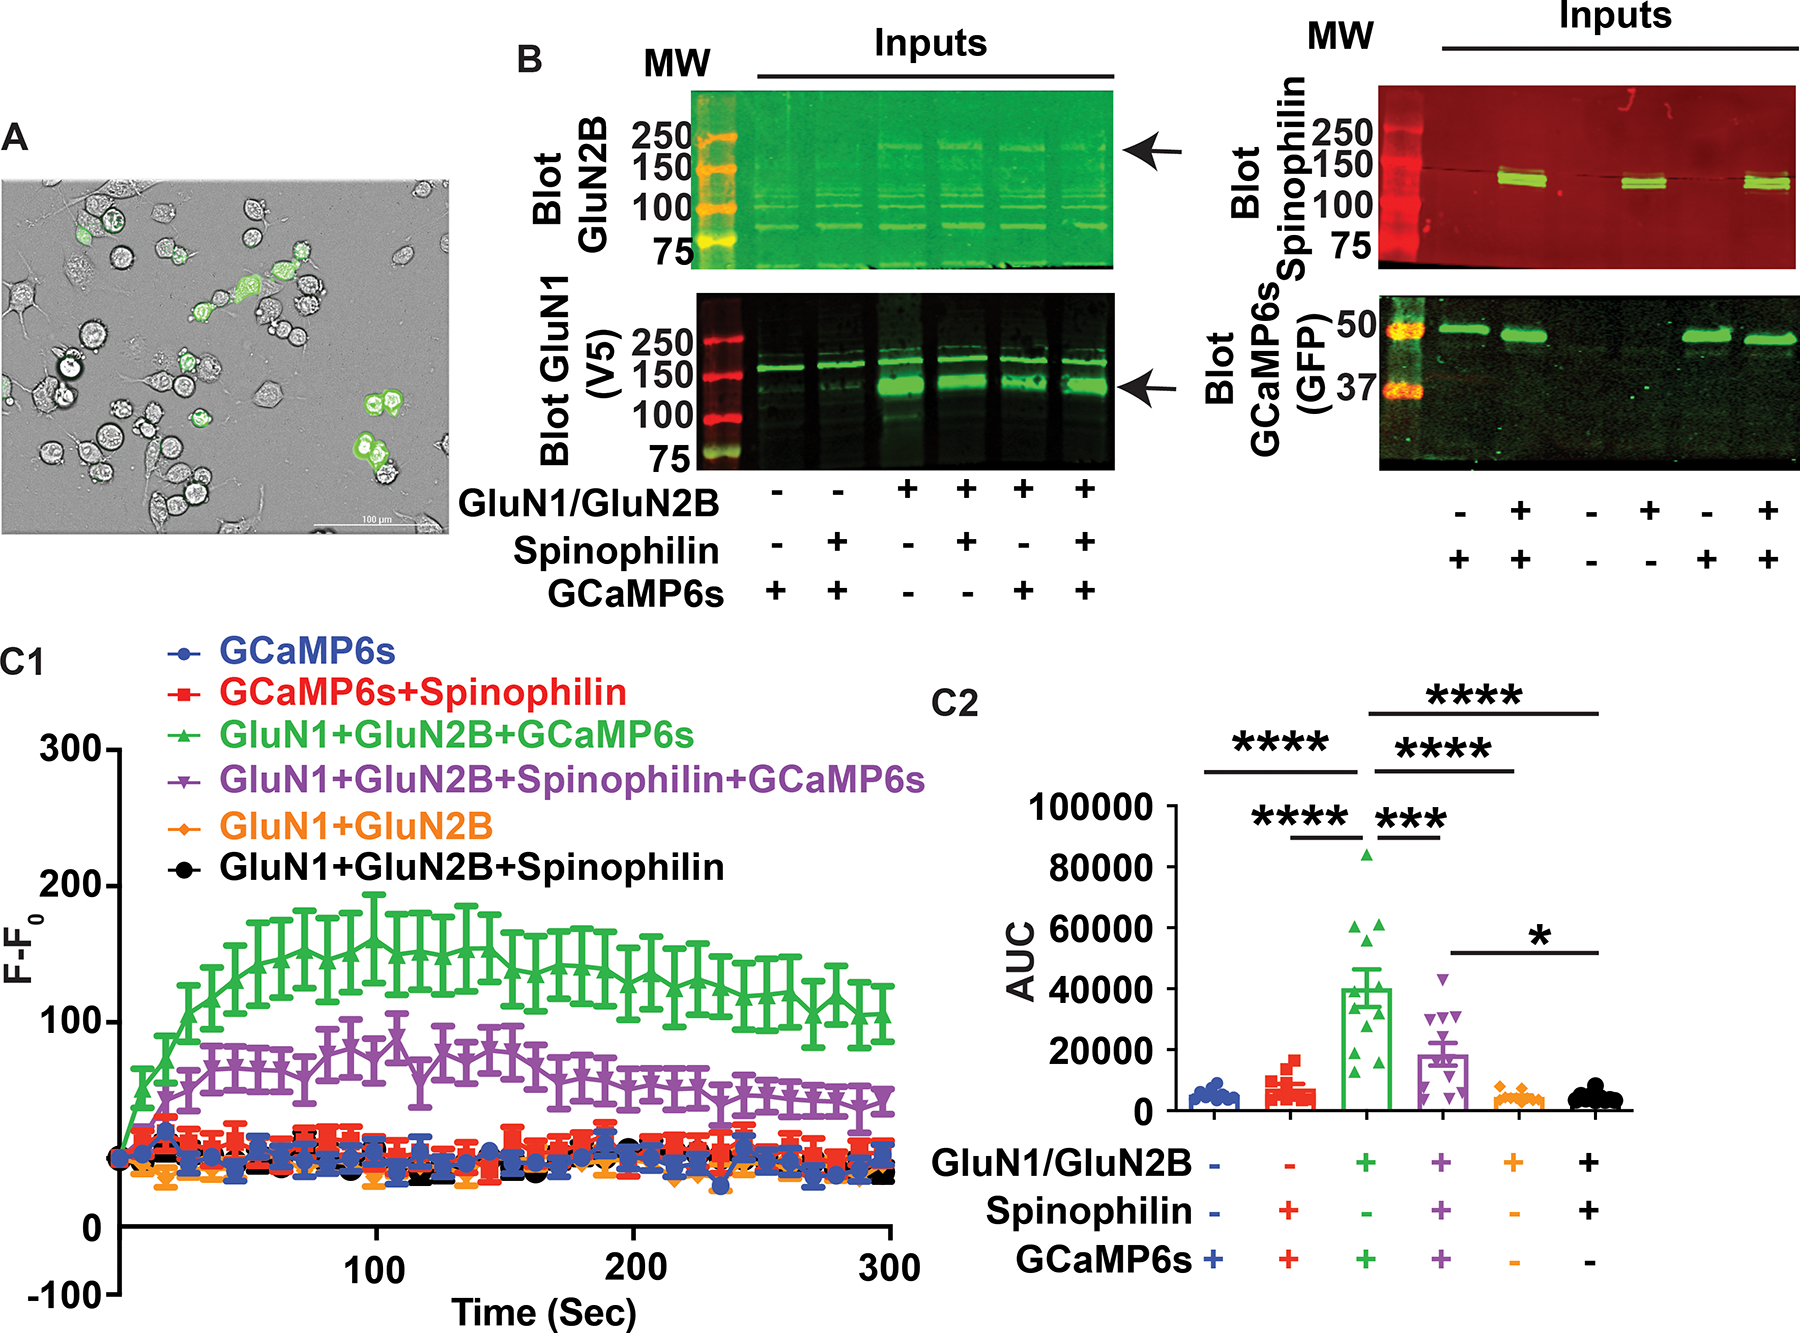
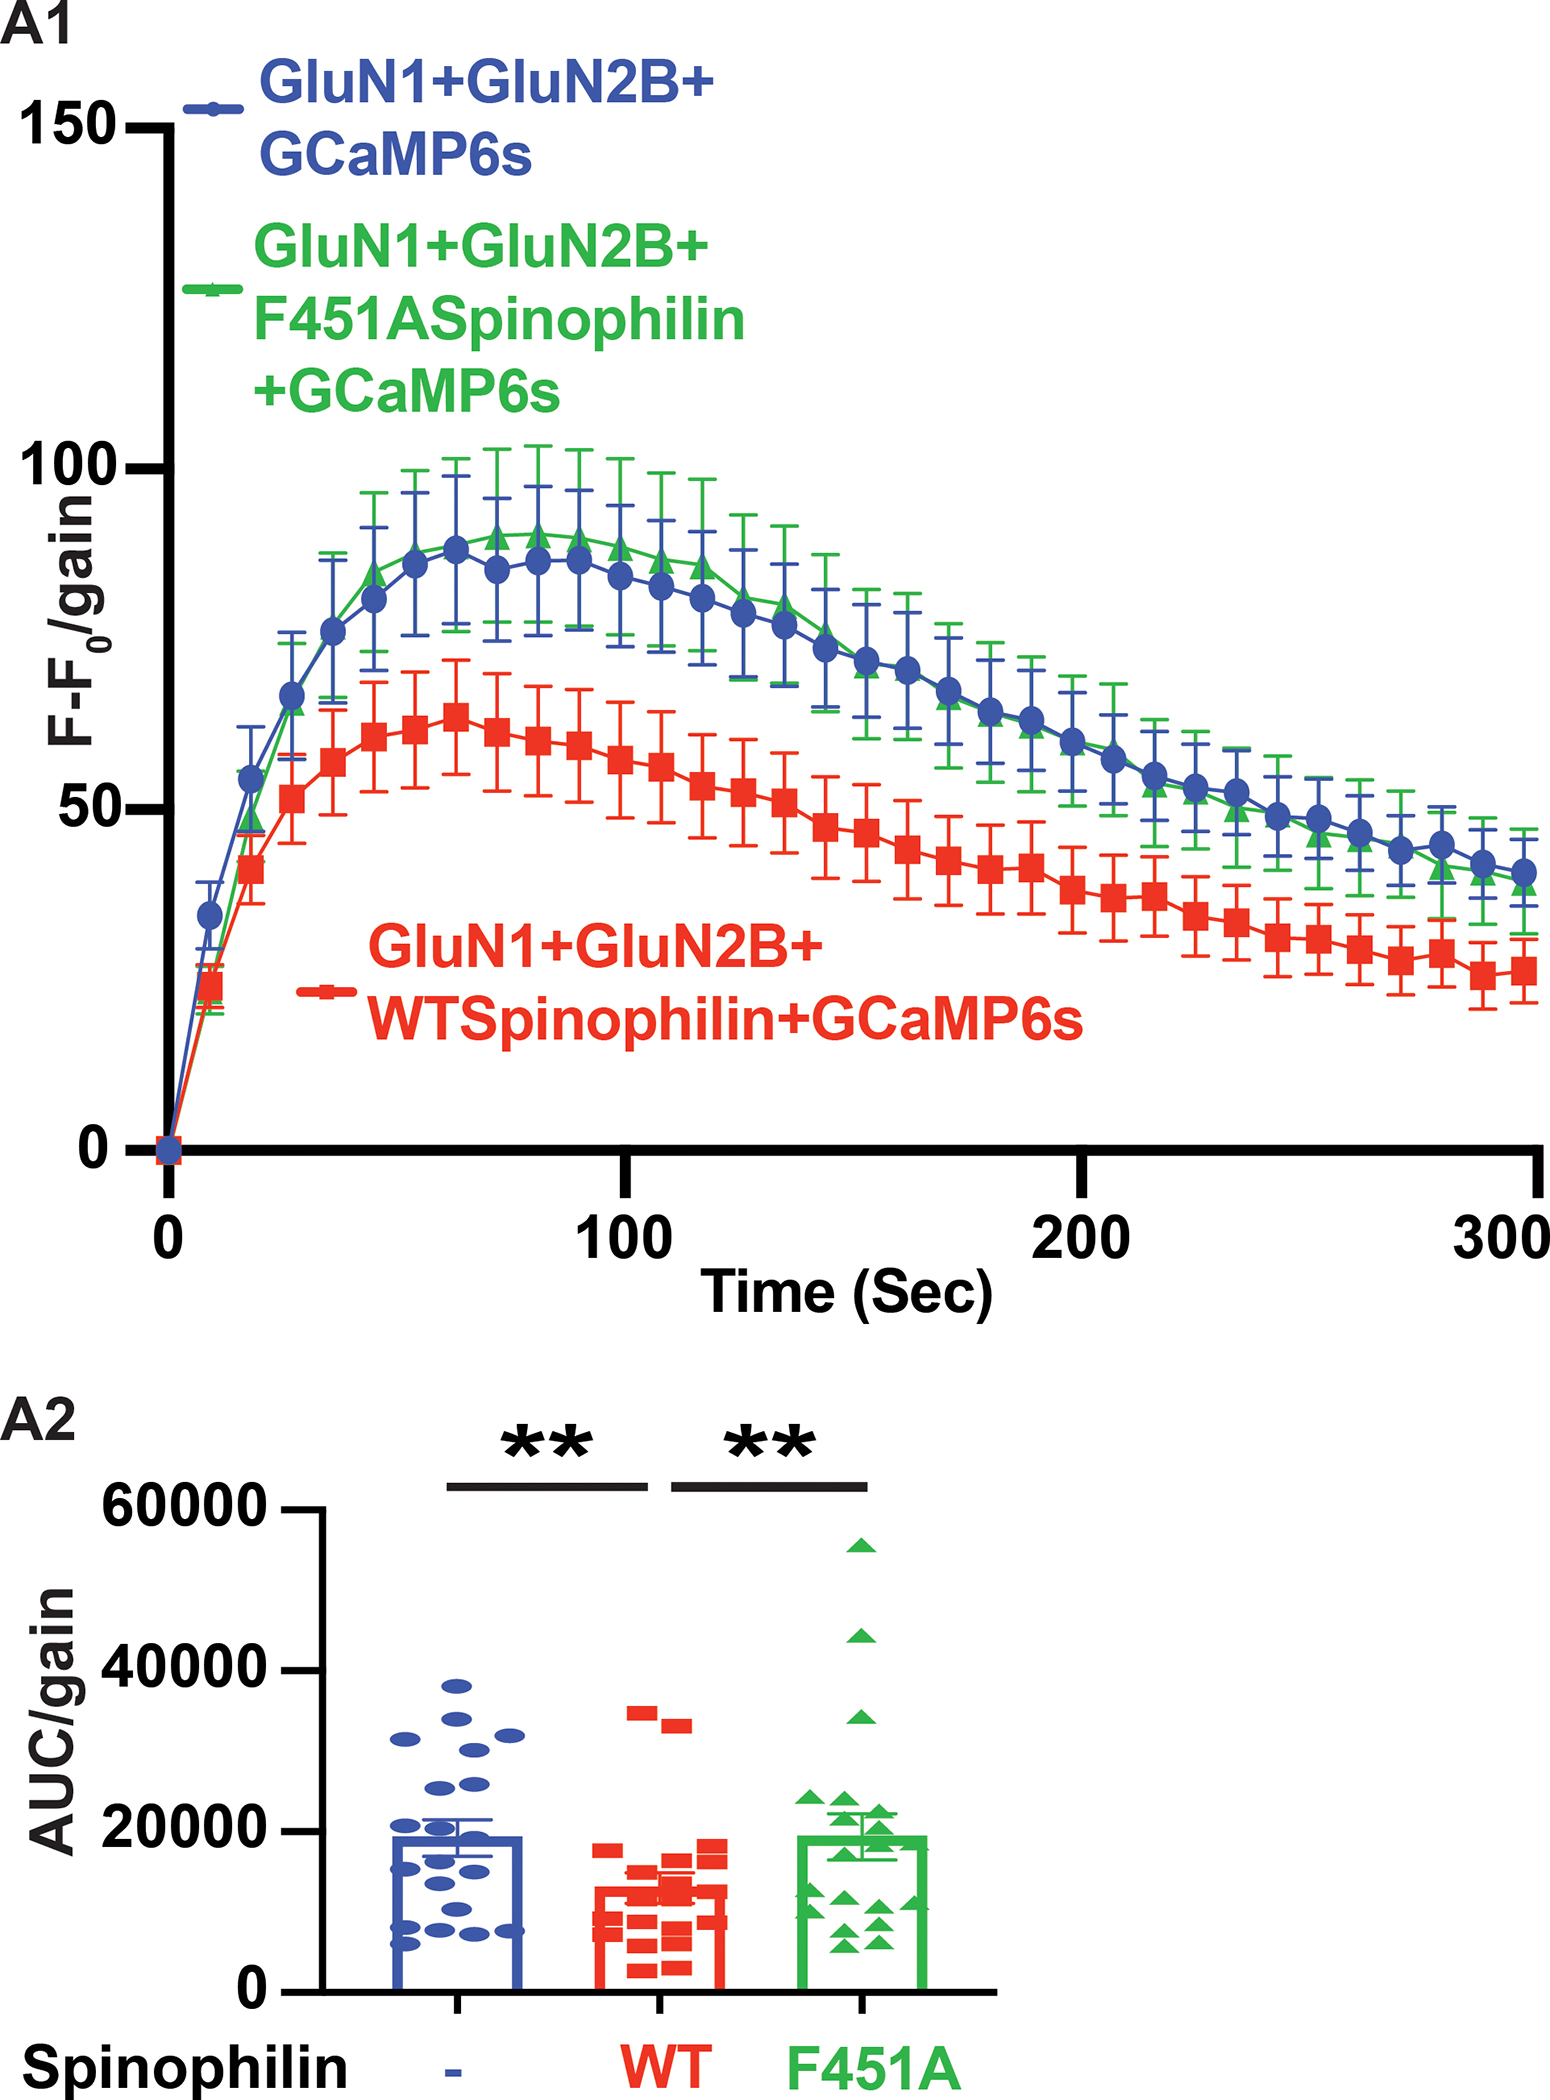
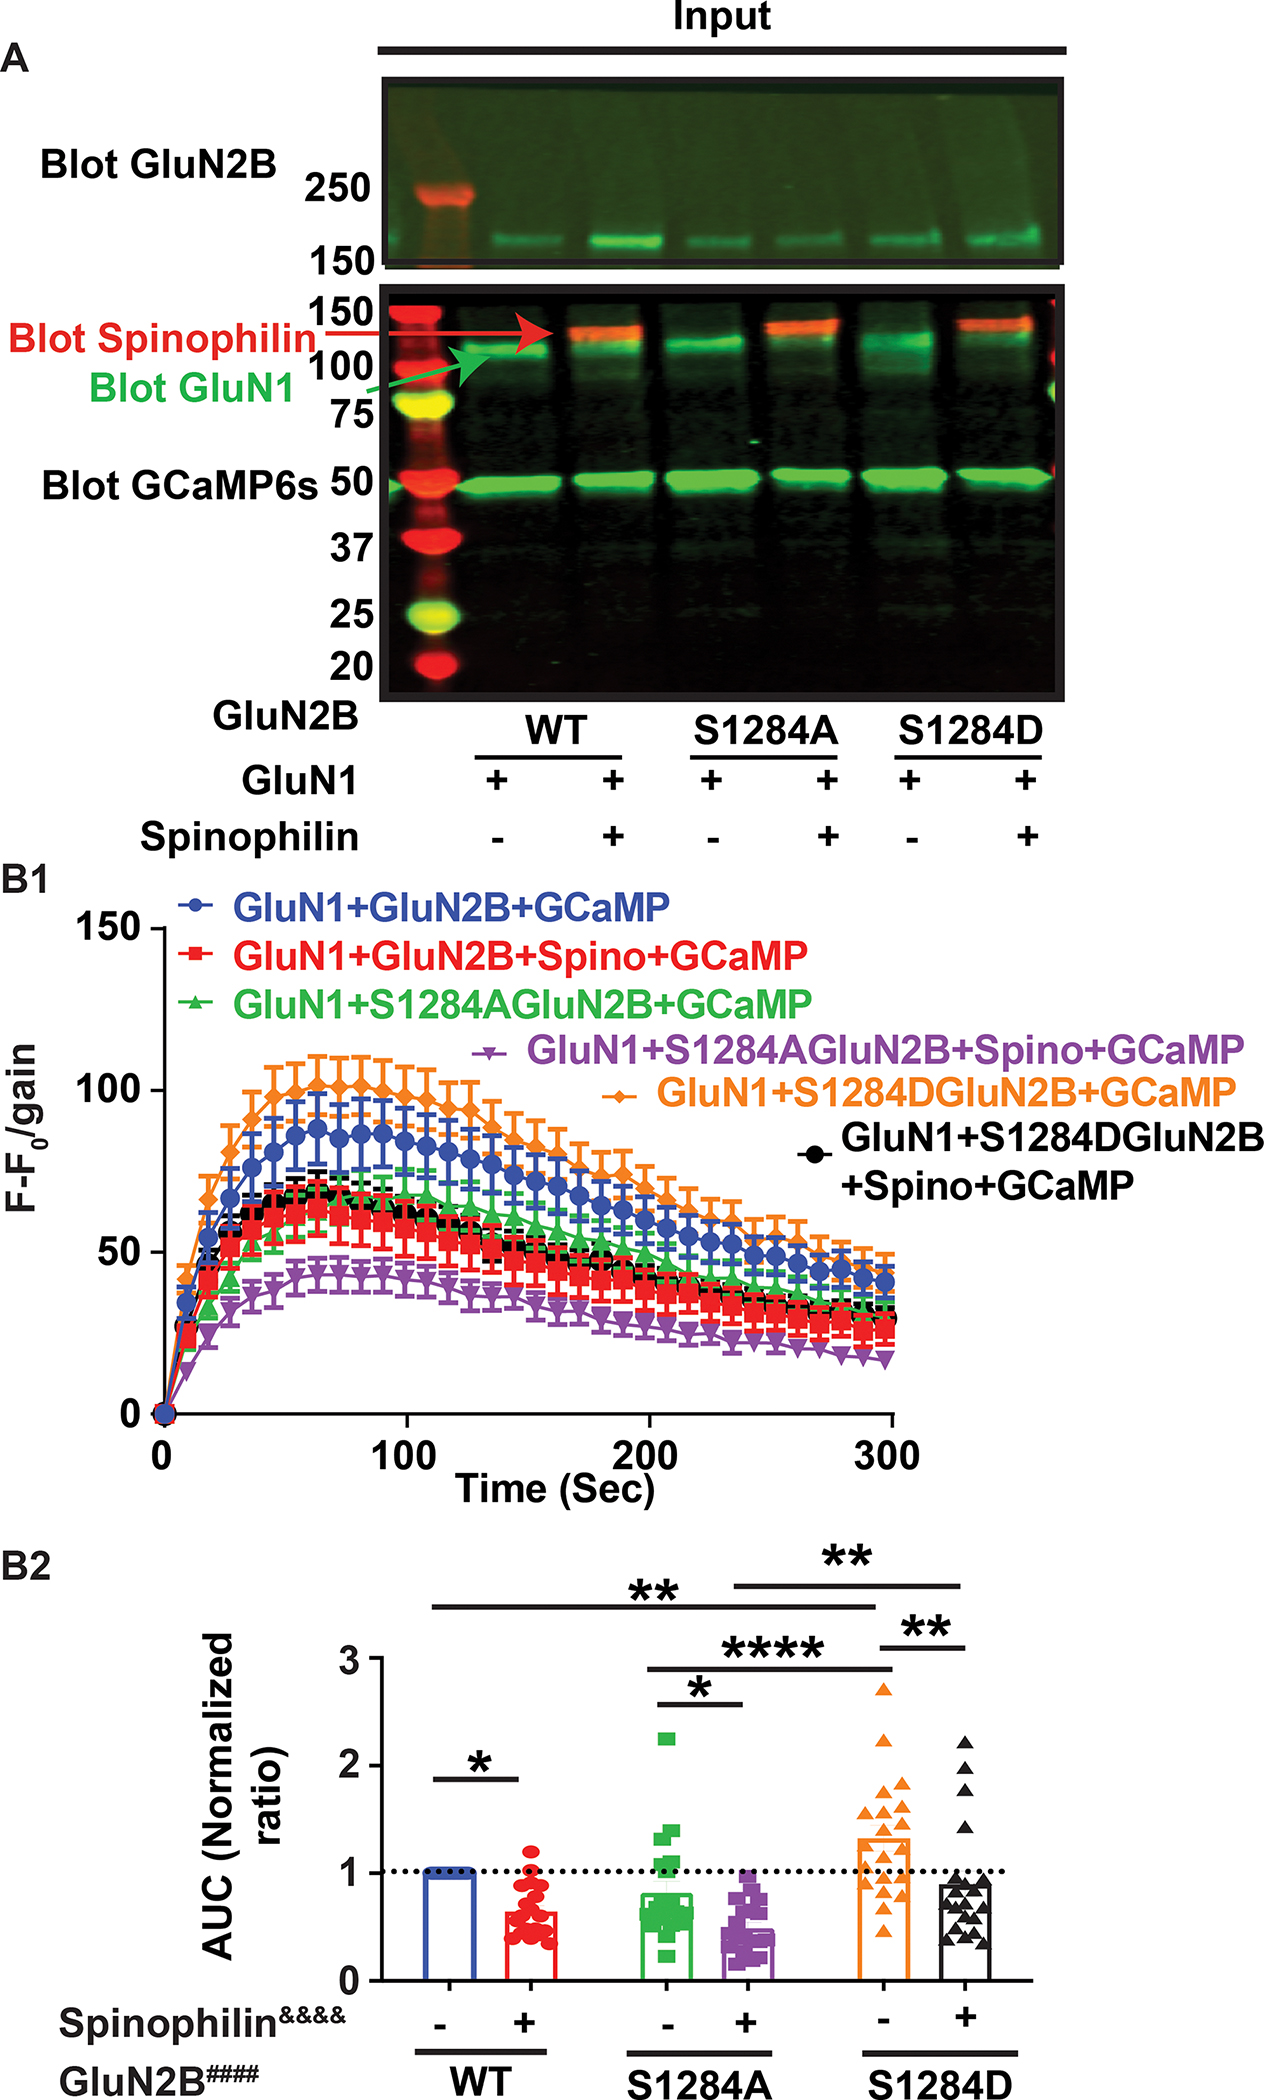
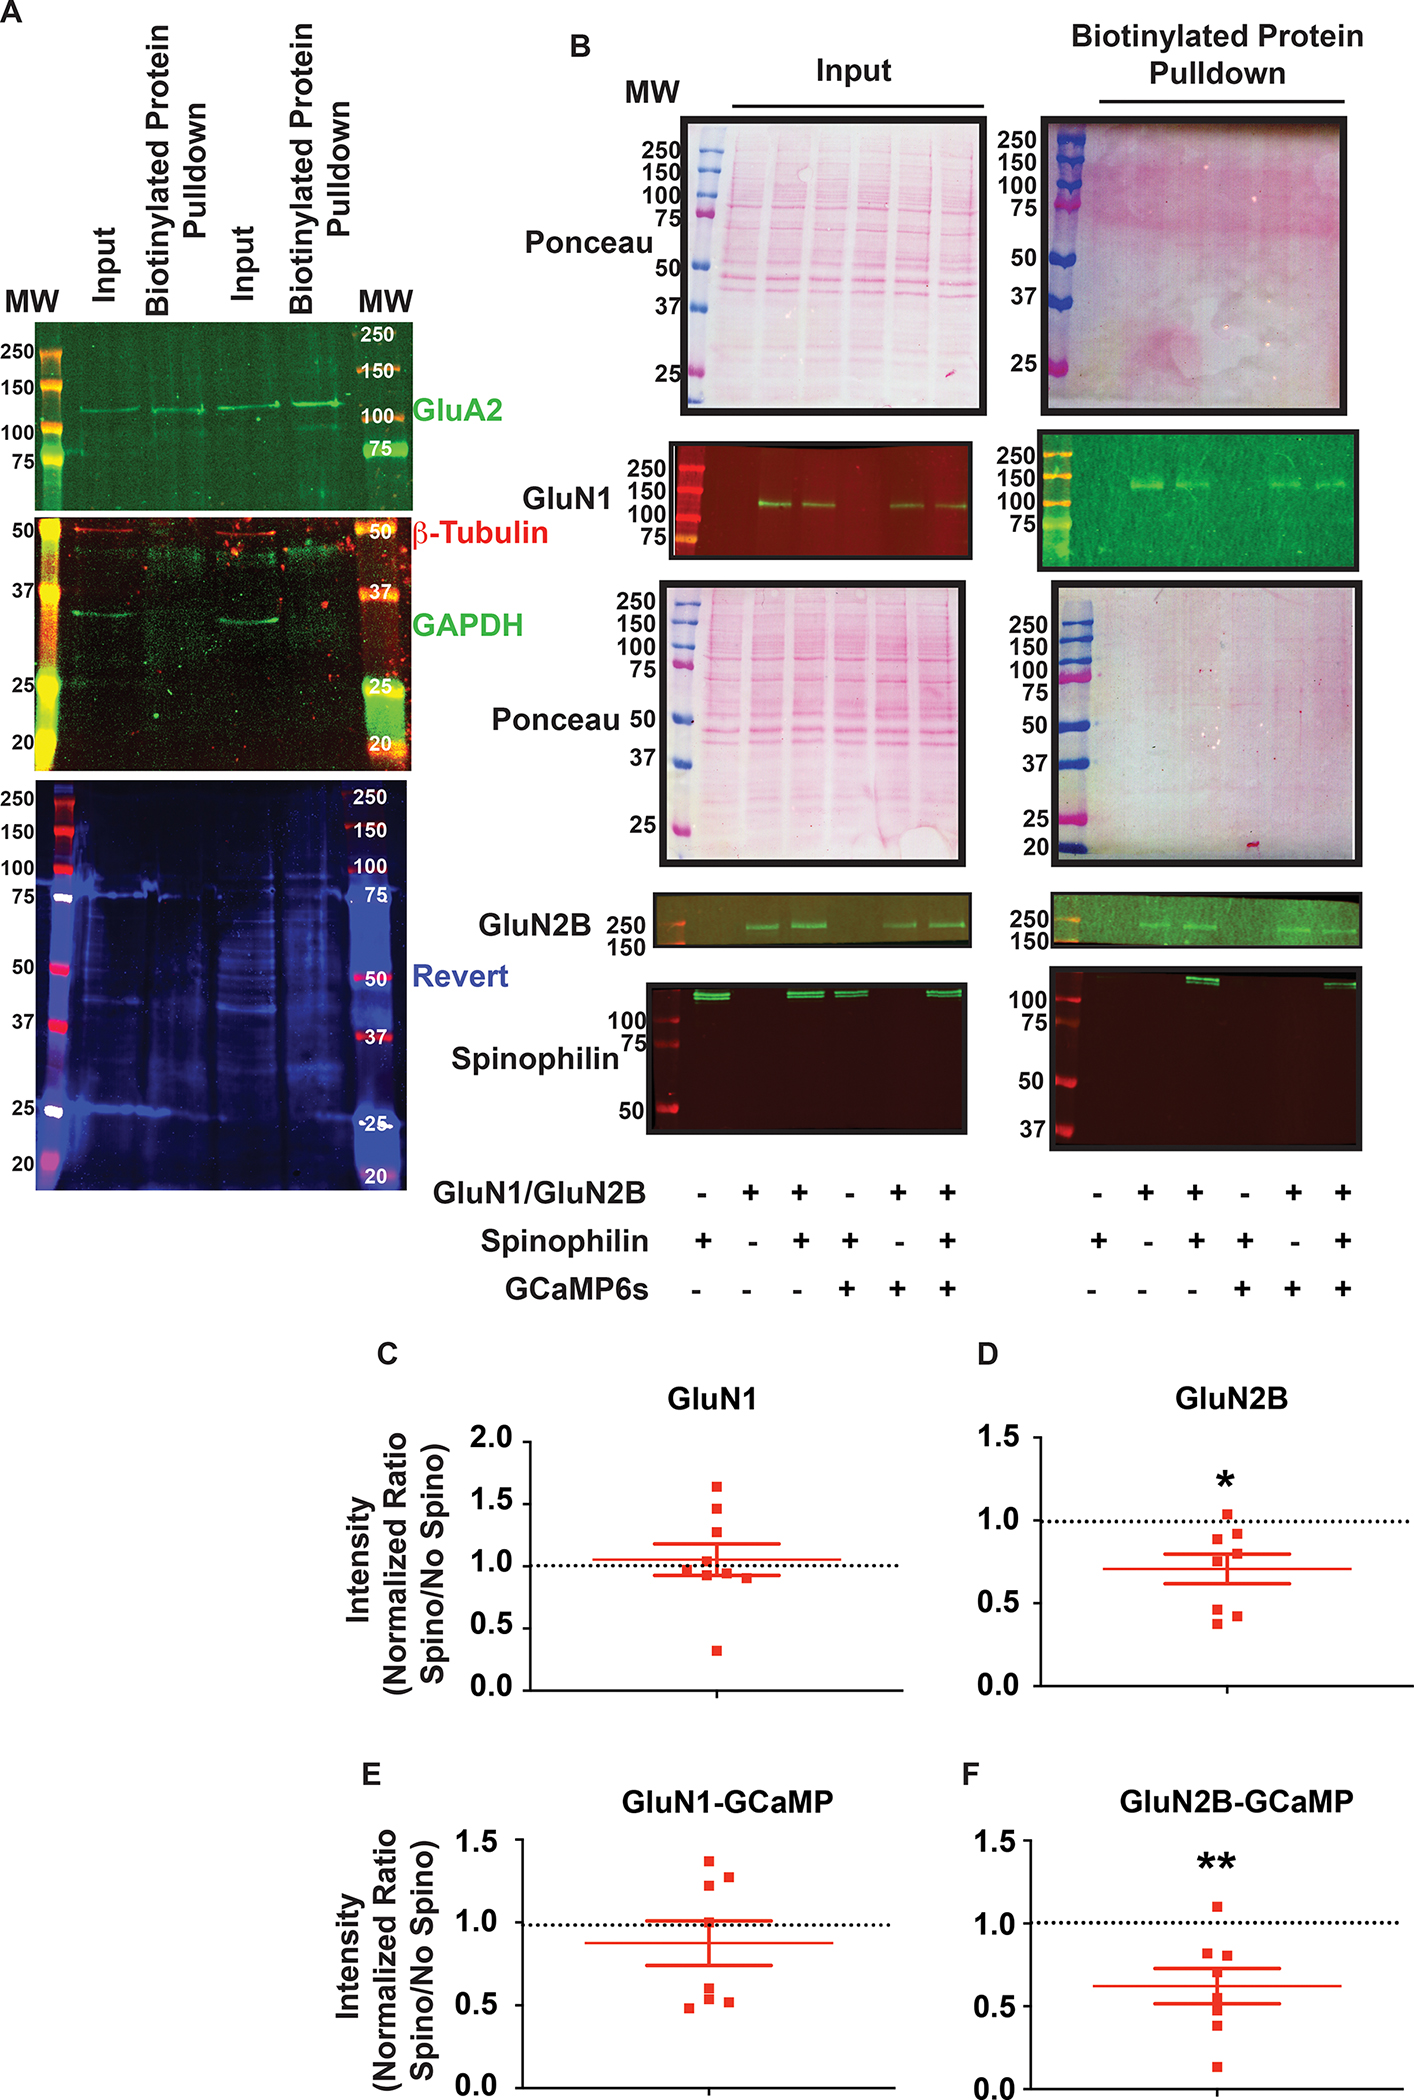
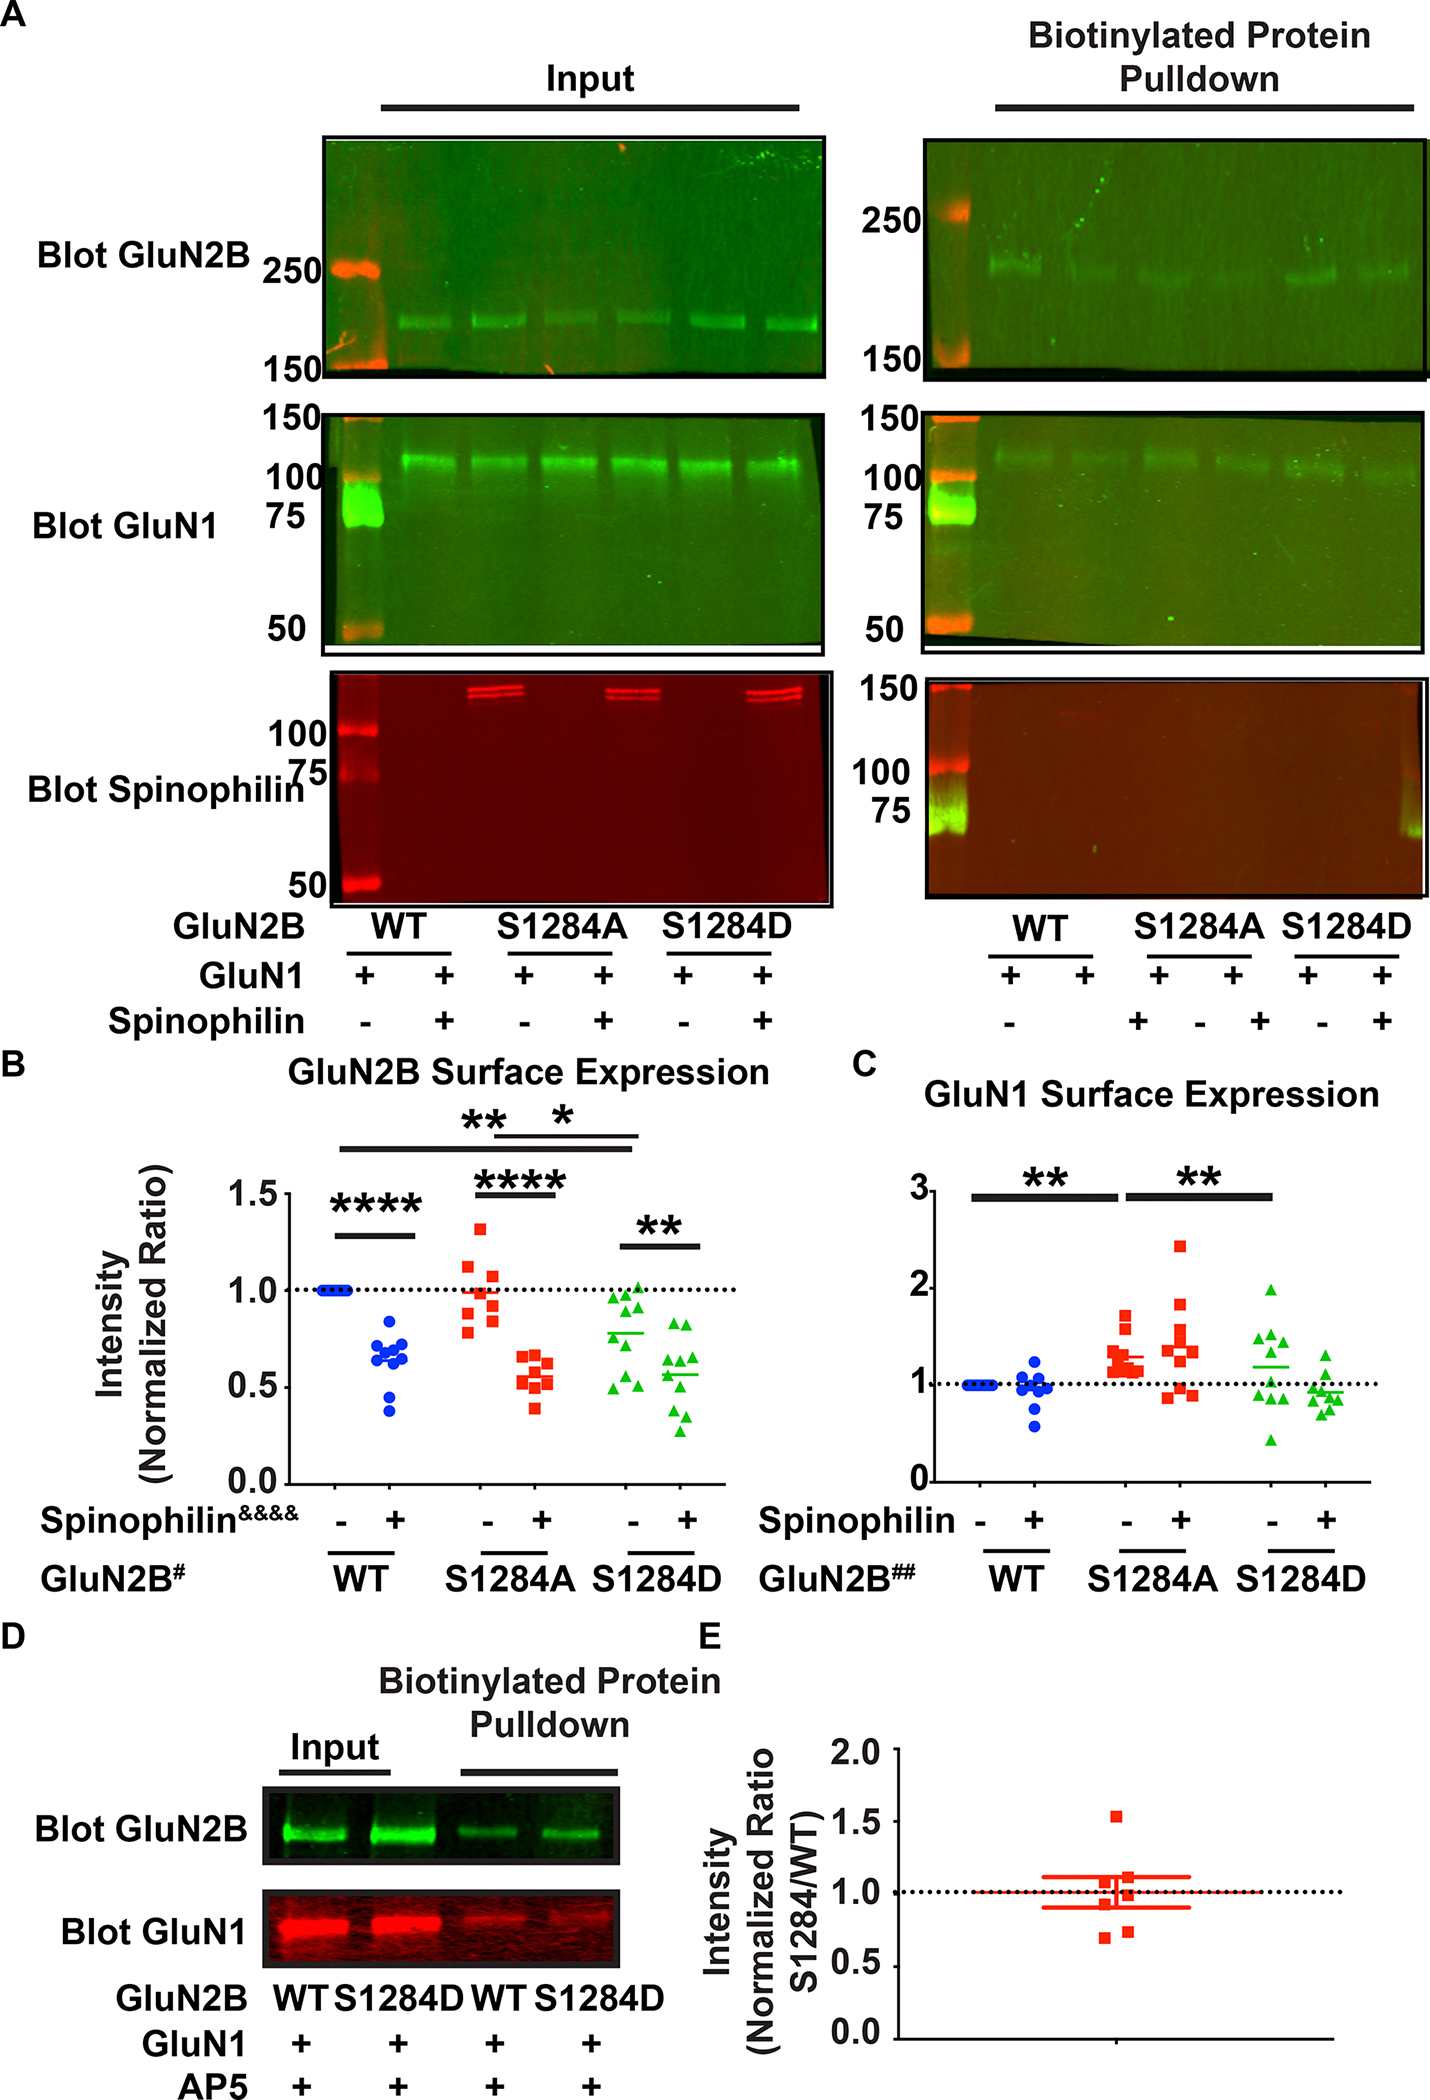
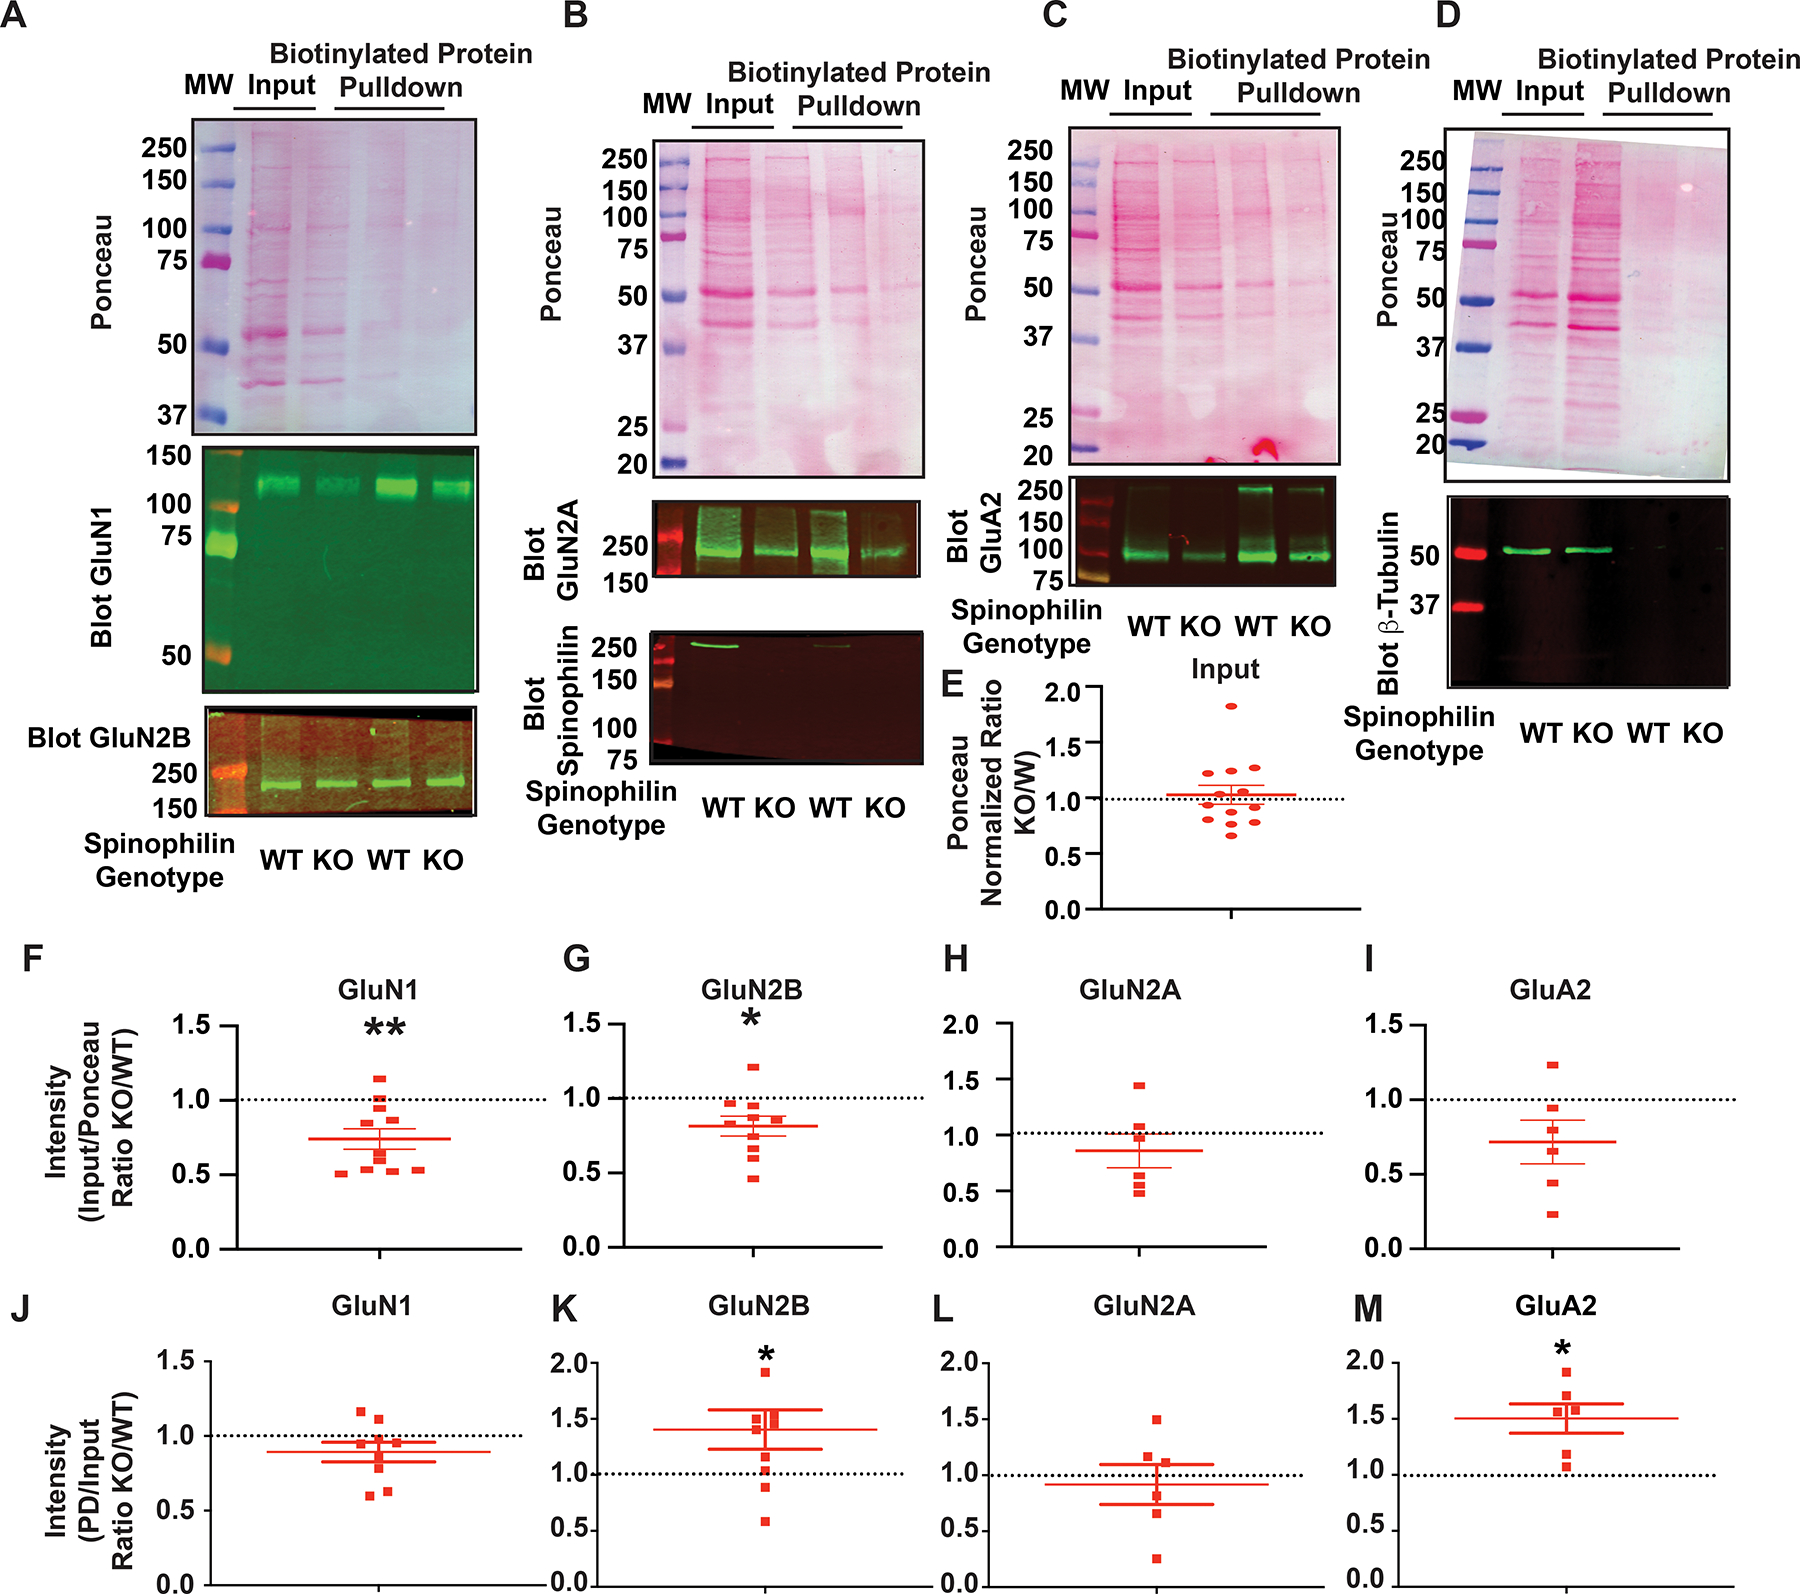
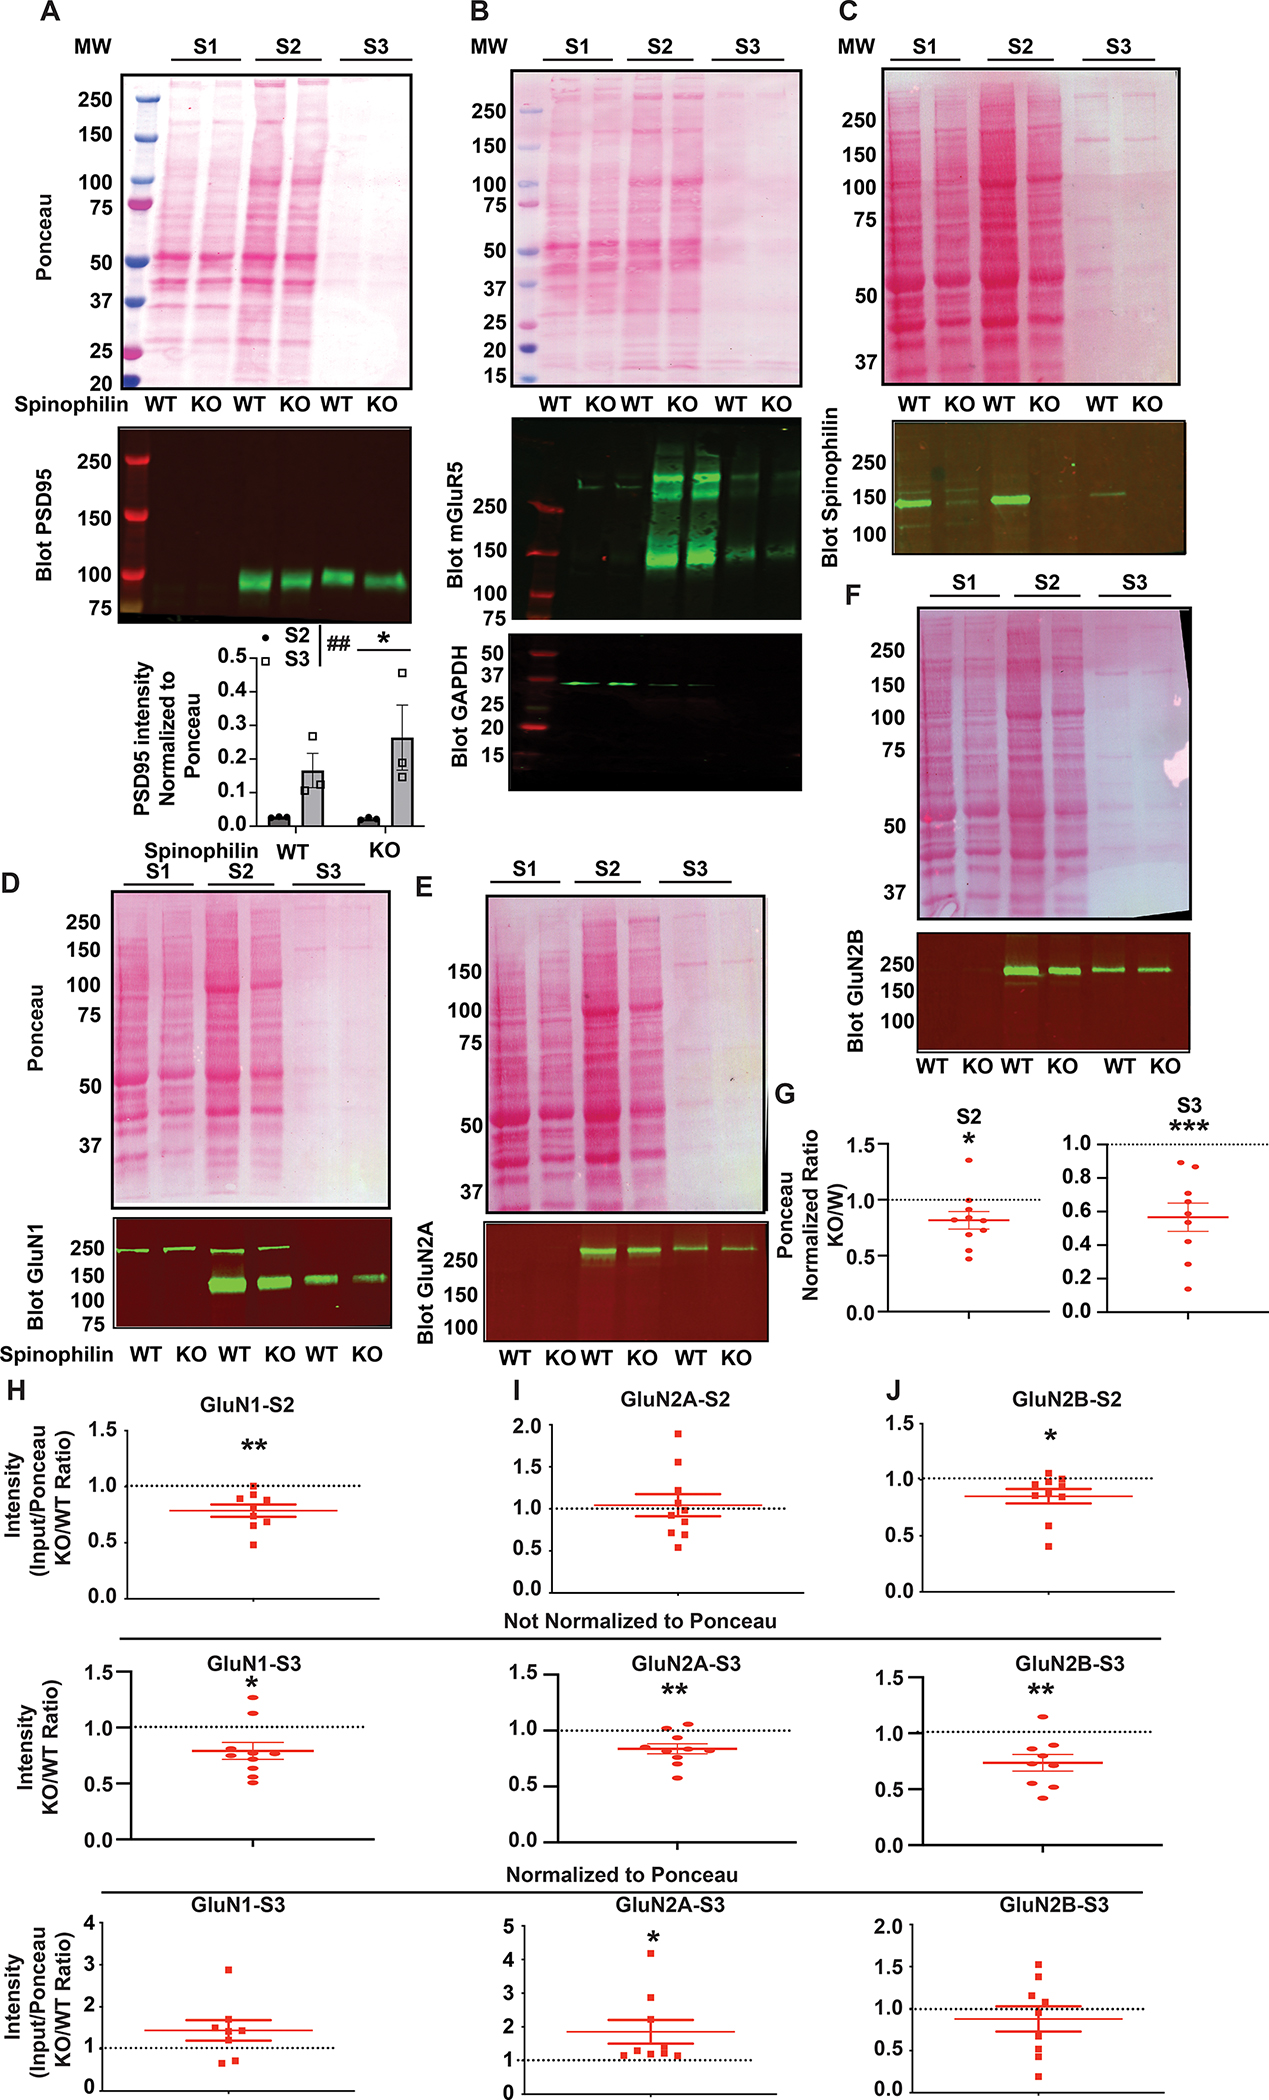
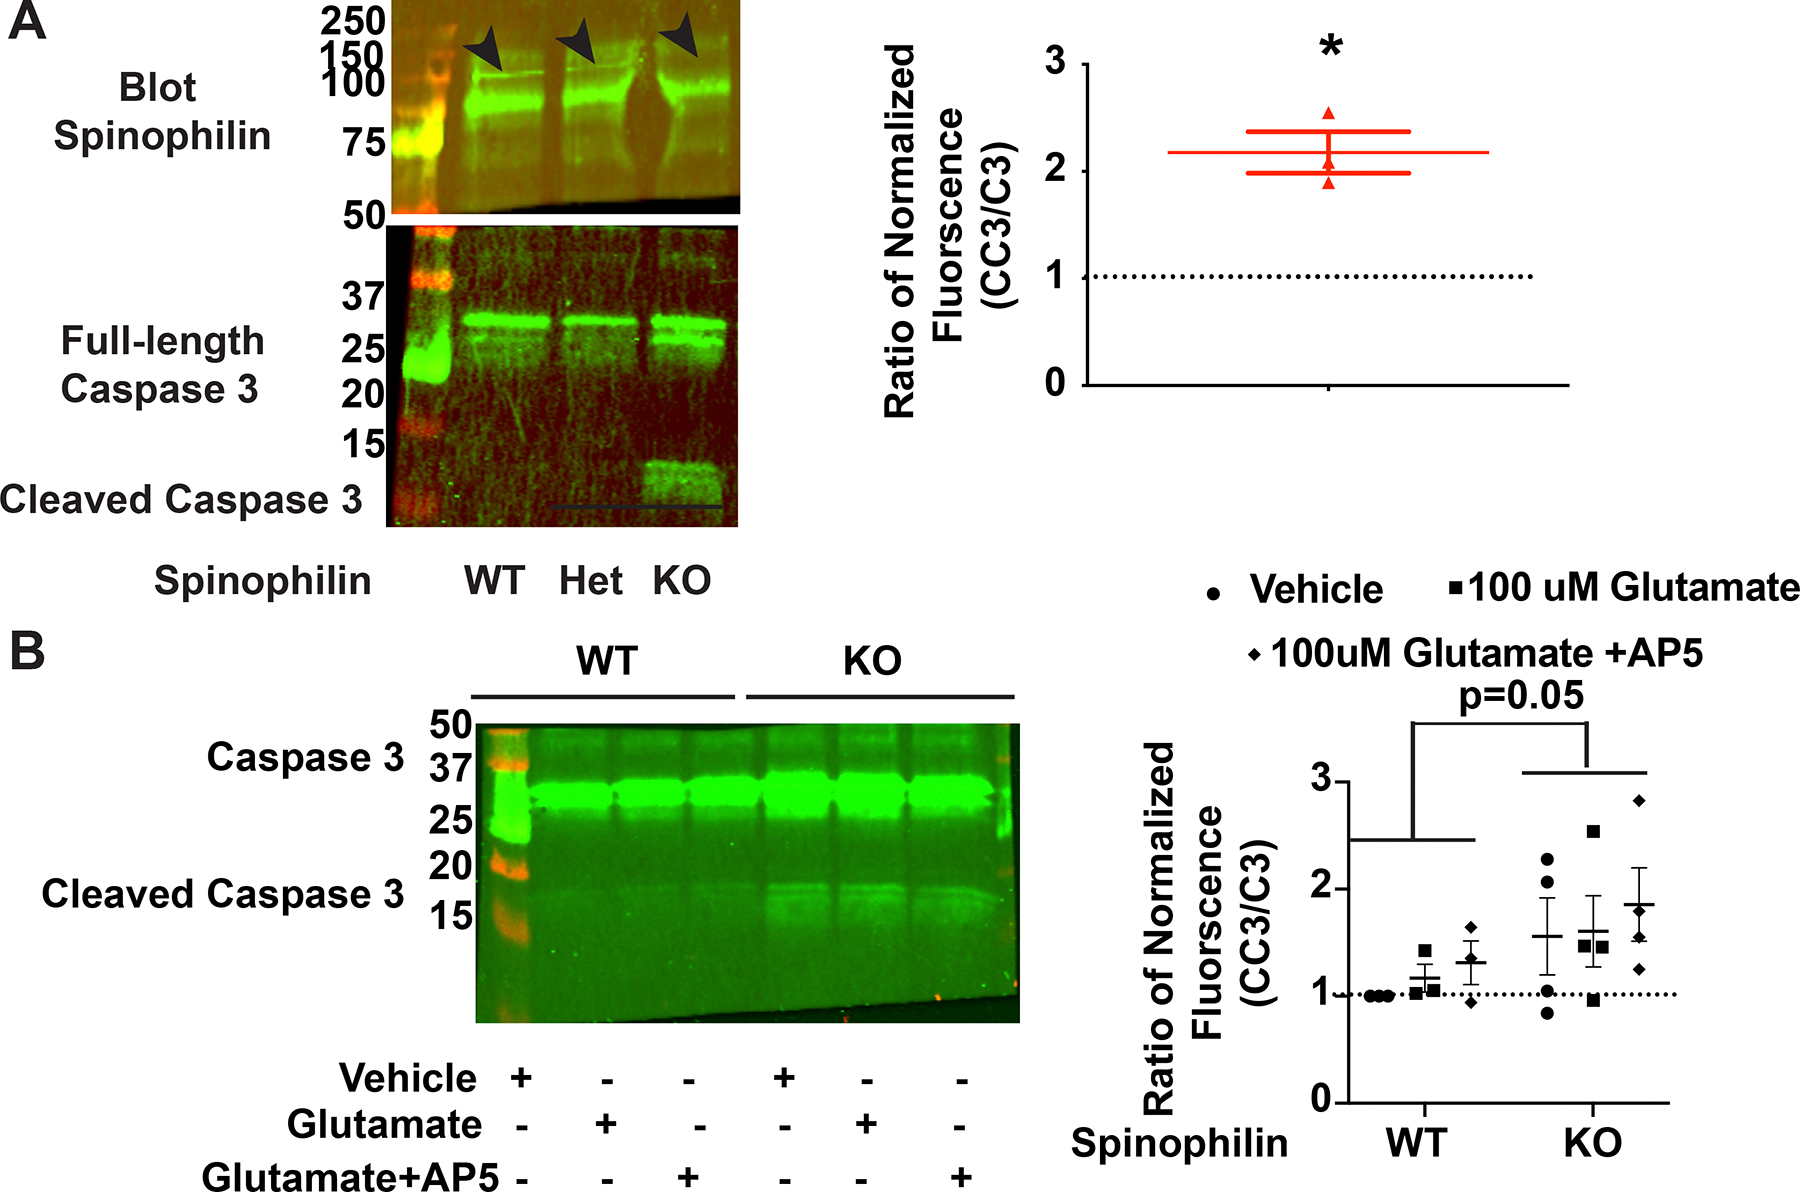
N-methyl-d-aspartate receptors (NMDARs) are calcium-permeable ion channels that are ubiquitously expressed within the glutamatergic postsynaptic density. Phosphorylation of NMDAR subunits defines receptor conductance and surface localization, two alterations that can modulate overall channel activity. Modulation of NMDAR phosphorylation by kinases and phosphatases regulates the amount of calcium entering the cell and subsequent activation of calcium-dependent processes. The dendritic spine enriched protein, spinophilin, is the major synaptic protein phosphatase 1 (PP1) targeting protein. Depending on the substrate, spinophilin can act as either a PP1 targeting protein, to permit substrate dephosphorylation, or a PP1 inhibitory protein, to enhance substrate phosphorylation. Spinophilin limits NMDAR function in a PP1-dependent manner. Specifically, we have previously shown that spinophilin sequesters PP1 away from the GluN2B subunit of the NMDAR, which results in increased phosphorylation of Ser-1284 on GluN2B. However, how spinophilin modifies NMDAR function is unclear. Herein, we utilize a Neuro2A cell line to detail that Ser-1284 phosphorylation increases calcium influx via GluN2B-containing NMDARs. Moreover, overexpression of spinophilin decreases GluN2B-containing NMDAR activity by decreasing its surface expression, an effect that is independent of Ser-1284 phosphorylation. In hippocampal neurons isolated from spinophilin knockout animals, there is an increase in cleaved caspase-3 levels, a marker of calcium-associated apoptosis, compared with wildtype mice. Taken together, our data demonstrate that spinophilin regulates GluN2B containing NMDAR phosphorylation, channel function, and trafficking and that loss of spinophilin enhances neuronal cleaved caspase-3 expression.

Keywords: calcium; glutamatergic; hippocampus; phosphatase; signal transduction; synapse.


Conflict of interest statement

Conflict of interest: The Author’s declare no conflicts of interest associated with these studies. The content is solely the responsibility of the authors and does not necessarily represent the official views of the National Institutes of Health.

Figures

Figure 1.
Figure 1.. Spinophilin decreases NMDAR-dependent calcium influx in Neuro2a cells.
A: Brightfield and fluorescence imaging of Neuro2a cells transfected with the fluorescent calcium indicator protein, GCaMP6s, along with GluN1 and GluN2B subunits of the N-methyl-D-aspartate receptor (NMDAR). B: Representative western blotting results indicating the transfection conditions and efficiency in the Neuro2a cells. C1: The fluorescence intensity at each time point (F) was subtracted from the fluorescence intensity at time zero (F0). This F−F0 value was plotted before, and at 9 second (sec) intervals following, addition of CaCl2 to the transfected Neuro2a cells. C2 Quantified area under the curve (AUC) calculated from data in Figure 1C1 indicating the total changes in the fluorescence level in each condition. No gain amplification was used, and cells were plated in a 12-well plate. n=12 sets of transfections. ANOVA, F (5, 58) = 18.61, P<0.0001. All graphs represent mean±standard error of the mean (SEM); *p<0.05, **P<0.01, ***p < 0.001, ****p<0.0001 post-hoc comparisons. All the other comparisons are nonsignificant.
Figure 2.
Figure 2.. F451A PP1 binding-deficient mutant spinophilin does not impact calcium influx via GluN2B-containing NMDARs in Neuro2a cells.
A1: The fluorescence intensity at each time point (F) was subtracted from the fluorescence intensity at time zero (F0). This F−F0 value was divided by the gain and this value was plotted before, and at 9 second (sec) intervals following, addition of CaCl2 to the transfected Neuro2a cells (6-well plate) in the absence of spinophilin or the presence of wildtype (WT) or Phe451Ala (F451A) mutant spinophilin. A2: The quantified area under the curve (AUC) of the traces in Figure 3A1 are plotted indicating the total changes in the fluorescence level in each condition. A user-defined gain of 10 was set for collection of these fluorescence intensities and cells were plated in a 6-well plate. N=20 sets of transfections. A matched (repeated measures) ANOVA was performed to compare samples from the same plate; F (1.372, 26.07) = 5.813; P=0.0154. Tukey Post-hoc tests were performed. All graphs represent mean± standard error of the mean (SEM); * **P<0.01, ***p < 0.001, post-hoc comparisons. All the other comparisons are nonsignificant.
Figure 3.
Figure 3.. Spinophilin-dependent decreases in calcium influx via GluN2B-containing NMDARs in Neuro2a cells is independent of Ser-1284 phosphorylation.
A: Representative western blot indicating the transfection conditions and efficiency in the Neuro2a cells transfected with wildtype (WT), or Ser1284Ala (S1284A) or Ser1284Asp (S1284D) mutants, of the GluN2B subunit of the N-methyl-D-Aspartate receptor (NMDAR) in the presence and absence of WT-spinophilin overexpression. Red arrow highlighting spinophilin expression, green arrow highlighting GluN1 expression. B1: The fluorescence intensity at each time point (F) was subtracted from the fluorescence intensity at time zero (F0). This F−F0 value was divided by the gain and this value was plotted before, and at 9 second (sec) intervals following, addition of CaCl2 to the Neuro2a cells transfected with different genotypes of GluN2B along with GluN1 in the absence and presence of WT-spinophilin. B2: The quantified area under the curve (AUC) of the traces in Figure 4B1 are plotted indicating the total changes in the fluorescence level in each condition. A user-defined gain of 10 was set for collection of these fluorescence intensities and cells were plated in a 6-well plate. N=20 sets of transfections. WT data are normalized and replotted from Figure 2. The normalized ratio of 1 is referenced by a dashed line. Two-Way ANOVA; spinophilin expression (F (1, 111) = 25.92, P<0.0001&&&&); GluN2B mutation (F (2, 111) = 13.65, P<0.0001####), Interaction (F (2, 111) = 0.1553, P=0.8564). Sidak post-hoc test for spinophilin expression and Tukey post-hoc test for GluN2B mutation were performed separately. All graphs represent mean±standard error of the mean (SEM); *p<0.05, **P<0.01, ****p < 0.0001 post-hoc comparisons. All the other comparisons are nonsignificant.
Figure 4.
Figure 4.. Spinophilin-dependent changes in GluN1 and GluN2B surface expression.
A: Inputs and biotinylated protein pulldown from two separate wells of a 6-well plate containing non-transfected Neuro2A cells were immunoblotted for GluA2, β-tubulin, and GAPDH and stained for total protein (Revert). B: Representative ponceau stains and western blots indicting the transfection conditions and biotinylation efficiency in the Neuro2a cells. The total lysate that was used for biotinylation (input) and the biotinylated protein fraction that was isolated from the input (biotinylated protein pulldown) that represent surface proteins labelled with biotin are shown. C: Quantified data of the surface expression of the GluN1 subunit of the N-methyl-D-Aspartate receptor (NMDAR) in the presence of WT-spinophilin overexpression, normalized to no spinophilin condition, with no GCaMP6s overexpression throughout the conditions. One-column t-test vs theoretical value of 1; P=0.6759. D: Quantified data of the surface expression of the GluN2B subunit of the N-methyl-D-Aspartate receptor (NMDAR) in the presence of wildtype (WT)-spinophilin overexpression, normalized to no spinophilin condition, with no GcaMP6s overexpression throughout the conditions. One-column t-test vs theoretical value of 1; *P=0.0135. E: Quantified data of the surface expression of the GluN1 subunit of the N-methyl-D-Aspartate receptor (NMDAR) in the presence of WT-spinophilin overexpression, normalized to no spinophilin condition, with GCaMP6s overexpression throughout the conditions. One-column t-test vs theoretical value of 1; P=0.3847. F: Quantified data of the surface expression of the GluN2B subunit of the N-methyl-D-Aspartate receptor (NMDAR) in the presence of WT-spinophilin overexpression, normalized to no spinophilin condition, while GCaMP6s was overexpressed throughout the conditions. One-column t-test vs theoretical value of 1; **P=0.0092. n=8–9 sets of transfections. All graphs represent mean±standard error of the mean (SEM). The normalized ratio of 1 is referenced by a dashed line.
Figure 5.
Figure 5.. Surface expression of WT, S1284A and S1284D mutant GluN2B containing NMDA receptors.
A: Representative western blots indicating the transfections and biotinylation conditions and efficiency. The total lysate that was used for biotinylation (input) and the biotinylated protein fraction that was isolated from the input (biotinylated protein pulldown) that represent surface proteins labelled with biotin are shown. Cells were transfected with wildtype (WT) GluN1 subunit of the subunit of the N-methyl-D-Aspartate receptor (NMDAR), and WT or Ser1284Ala (S1284A) or Ser1284Asp (S1284D) mutant forms of the GluN2B subunit of the NMDAR. Transfections were performed in the absence or presence of transfected WT-spinophilin B: Quantified data indicating the surface expression of WT, S1284A, and S1284D mutant GluN2B, in the presence or absence of overexpressed WT-spinophilin. n=10 sets of transfections. Two-way ANOVA spinophilin expression (F (1, 50) = 69.23, P<0.0001&&&&); GluN2B mutation (F (2, 50) = 4.874, P=0.0116#); Interaction (F (2, 50) = 2.548, P=0.0884). Sidak post-hoc test for spinophilin expression and Tukey post-hoc test for GluN2B mutation were performed separately. C: Quantified data indicating the surface expression of GluN1 when co-expressed with WT, S1284A and S1284D mutant GluN2B, in the presence and absence of overexpressed WT-spinophilin. n=10 sets of transfections. Two-way ANOVA; Spinophilin expression - F (1, 52) = 0.7167, P=0.4011), GluN2B mutation - F (2, 52) = 7.875, P=0.0010, Interaction – F (2, 54) = 1.755, P=0.1830. Tukey post-hoc test for GluN2B mutation were performed. D: Representative western blots indicating the transfection and biotinylation efficiency of WT and/or S1284D GluN2B in the presence and absence of AP5 application throughout the biotinylation procedure. n=7 sets of transfections. E: Quantified data of the surface expression of S1284D mutant GluN2B, in the presence of AP5 application during biotinylation, normalized to WT n=7. One-column t-test vs theoretical value of 1; P=0.9089. All graphs represent mean±standard error of the mean (SEM); *p<0.05, **P<0.01, ***p < 0.001, **** p <0.0001 post-hoc comparisons. All the other comparisons are nonsignificant. The normalized ratio of 1 is referenced by a dashed line.
Figure 6.
Figure 6.. Surface expression of GluN2B subunit of NMDARs and GluA2 of AMPARs is altered in the hippocampus of spinophilin KO mouse brain.
A-D: Ponceau staining and immunoblotting of inputs and biotinylated pulldowns for GluN1 and GluN2B (A), GluN2A and Spinophilin (B), GluA2 (C), and β-tubulin (D). E: Quantification of the ratio (KO/WT) of the total ponceau stain in the inputs. One-column t-test vs theoretical value of 1; P=0.7502. F-I: Quantification of the ratio (KO/WT) of the inputs normalized to ponceau stain for F: GluN1 subunit of the N-methyl-D-Aspartate receptor (NMDAR). n=11. One-column t-test vs theoretical value of 1; P=0.0038; G: GluN2A subunit of the NMDAR. n=6. One-column t-test vs theoretical value of 1; P=0.3931. H: GluN2B subunit of the NMDAR. n=10 . One-column t-test vs theoretical value of 1; *P=0.0219. I: GluA2 subunit of the a-amino-3-hydroxy-5-methyl-4-isoxazolepropionic acid receptor (AMPAR). n=6. One-column t-test vs theoretical value of 1; P=0.1105. Quantification of the ratio (KO/WT) of the biotinylated pulldowns (PDs) normalized to the input for J: GluN1 subunit of the N-methyl-D-Aspartate receptor (NMDAR). n=9. One-column t-test vs theoretical value of 1; P=0.1371. K: GluN2A subunit of the NMDAR. n=6. One-column t-test vs theoretical value of 1; P=0.6610. L: GluN2B subunit of the NMDAR. n=9. One-column t-test vs theoretical value of 1; *P=0.0371. M: GluA2 subunit of the a-amino-3-hydroxy-5-methyl-4-isoxazolepropionic acid receptor (AMPAR). n=6. One-column t-test vs theoretical value of 1; *P=0.119. All graphs represent mean±standard error of the mean (SEM). The normalized ratio of 1 is referenced by a dashed line.
Figure 7.
Figure 7.. The subcellular localization of NMDAR subunits is modified in P28 spinophilin global KO mouse hippocampus.
Ponceau stain and immunoblotting of marker proteins A. PSD-95, B. mGluR5, C. Spinophilin and NMDAR subunits D. GluN1, E. GluN2A, and F. GluN2B in cytosolic (S1), membrane associated-non postsynaptic density (S2), and postsynaptic density-enriched (S3) crude subcellular fractions. S2 and S3 fractions were quantified for A. PSD 95. Two-Way ANOVA showed a significant fraction effect (F(1,8) = 12.02, P=0.0085. Sidak post-hoc test showed a significant individual difference in the KO P=0.0285. Quantifications are N of 3 samples run on the same gel. G: Quantification of a normalized ratio KO/WT of ponceau stains from the S2 and S3 fraction. S2 - One-column t-test vs theoretical value of 1; *P=0.0429, S3 - One-column t-test vs theoretical value of 1; ***P=0.0009. H: Quantified data showing the level of subcellular localization of the GluN1 subunit of the N-methyl-D-Aspartate receptor (NMDAR) in the S2 fraction normalized to ponceau (top), S3 fraction not normalized to ponceau (middle) and S3 fraction normalized to ponceau (bottom) fraction. n=8–9. One-column t-test vs theoretical value of 1; **P=0.0044 (S2), *P=0.0214 (S3 not normalized), P=0.1130 (S3 normalized). I: Quantified data showing the level of subcellular localization of GluN2A subunit of the NMDAR in the S2 fraction normalized to ponceau (top), S3 fraction not normalized to ponceau (middle) and S3 fraction normalized to ponceau (bottom) fraction. n=9–10. One-column t-test vs theoretical value of 1; P=0.7438 (S2), **P=0.0058 (S3 not normalized),*P=0.0413 (S3 normalized). J: Quantified data showing the level of subcellular localization of GluN2B subunit of the NMDAR in the S2 fraction normalized to ponceau (top), S3 fraction not normalized to ponceau (middle) and S3 fraction normalized to ponceau (bottom) fraction. n=9–10. One-column t-test vs theoretical value of 1; *P=0.0493 (S2) ), **P=0.0074 (S3 not normalized), P=0.4403 (S3 normalized). All graphs represent mean±standard error of the mean (SEM). The normalized ratio of 1 is referenced by a dashed line.
Figure 8.
Figure 8.. Spinophilin KO hippocampal cultures are more susceptible to activation of apoptotic pathways independent of acute calcium influx via NMDARs.
A: Western blot data showing spinophilin and caspase 3 (C3) and cleaved caspase 3 (CC3) bands in the spinophilin WT, heterozygous, and KO hippocampal cultures. A ratio of the KO/WT data were plotted and show a significant increase in the CC3/C3 ratio in the KOs compared to the WT cells. N=3. One-column t-test vs theoretical value of 1; *P=0.0260. B: Western blot data showing C3 and CC3 bands in the spinophilin WT and KO hippocampal cultures treated with vehicle, NMDA, or NMDA and AP5. Quantified data indicating a significant increase in the CC3/C3 ratio in the KOs compared to the WT cells. N=3–4. Two-way ANOVA; Spinophilin expression - F (1, 15) = 4.380, P=0.0538), Treatment - F (2, 15) = 0.5305, P=0.5989, Interaction – F (2, 15) = 0.02395, P=0.9764. No post-hoc differences. All graphs represent mean±standard error of the mean (SEM). The normalized ratio of 1 is referenced by a dashed line.

Similar articles

Cited by

References

    1. Acutain MF, Griebler Luft J, Vazquez CA, Popik B, Cercato MC, Epstein A, . . . Baez MV (2021). Reduced Expression of Hippocampal GluN2A-NMDAR Increases Seizure Susceptibility and Causes Deficits in Contextual Memory. Front Neurosci, 15, 644100. doi:10.3389/fnins.2021.644100 - DOI - PMC - PubMed
    1. Affaticati P, Mignen O, Jambou F, Potier MC, Klingel-Schmitt I, Degrouard J, . . . Cohen-Kaminsky S (2011). Sustained calcium signalling and caspase-3 activation involve NMDA receptors in thymocytes in contact with dendritic cells. Cell Death Differ, 18(1), 99–108. doi:10.1038/cdd.2010.79 - DOI - PMC - PubMed
    1. Ai H, Shi XF, Hu XP, Fang WQ, Zhang B, & Lu W (2017). Acute stress regulates phosphorylation of N-methyl-d-aspartate receptor GluN2B at S1284 in hippocampus. Neuroscience, 351, 24–35. doi:10.1016/j.neuroscience.2017.03.029 - DOI - PubMed
    1. Allen PB, Ouimet CC, & Greengard P (1997). Spinophilin, a novel protein phosphatase 1 binding protein localized to dendritic spines. Proc Natl Acad Sci U S A, 94(18), 9956–9961. - PMC - PubMed
    1. Allen PB, Zachariou V, Svenningsson P, Lepore AC, Centonze D, Costa C, . . . Greengard P (2006). Distinct roles for spinophilin and neurabin in dopamine-mediated plasticity. Neuroscience, 140(3), 897–911. - PubMed

Publication types

LinkOut - more resources