. 2023 Mar 8;31(3):433-446.e4.
doi: 10.1016/j.chom.2023.01.006. Epub 2023 Feb 3.

Autophagy controls mucus secretion from intestinal goblet cells by alleviating ER stress

Affiliations

Autophagy controls mucus secretion from intestinal goblet cells by alleviating ER stress

Maria Naama et al. Cell Host Microbe. .

Abstract

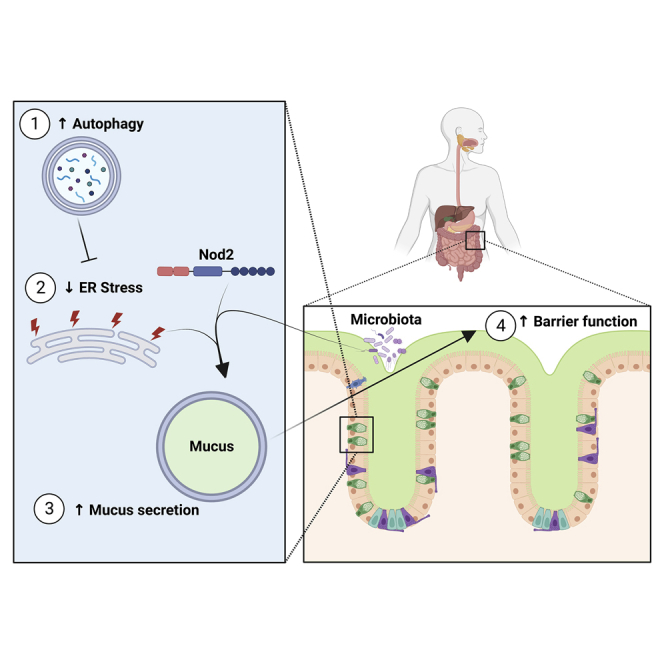
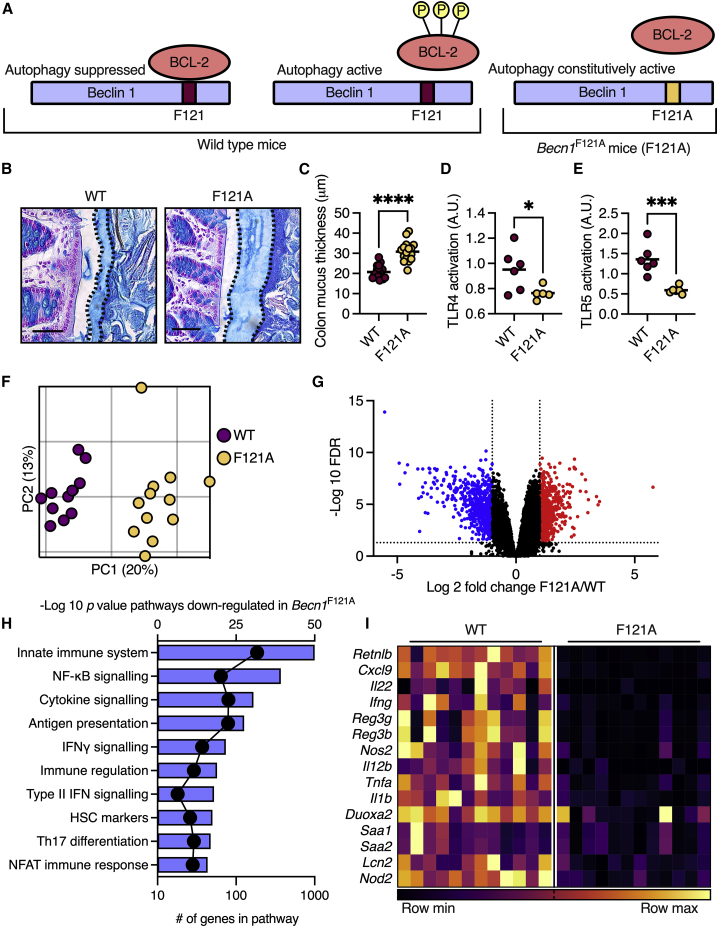
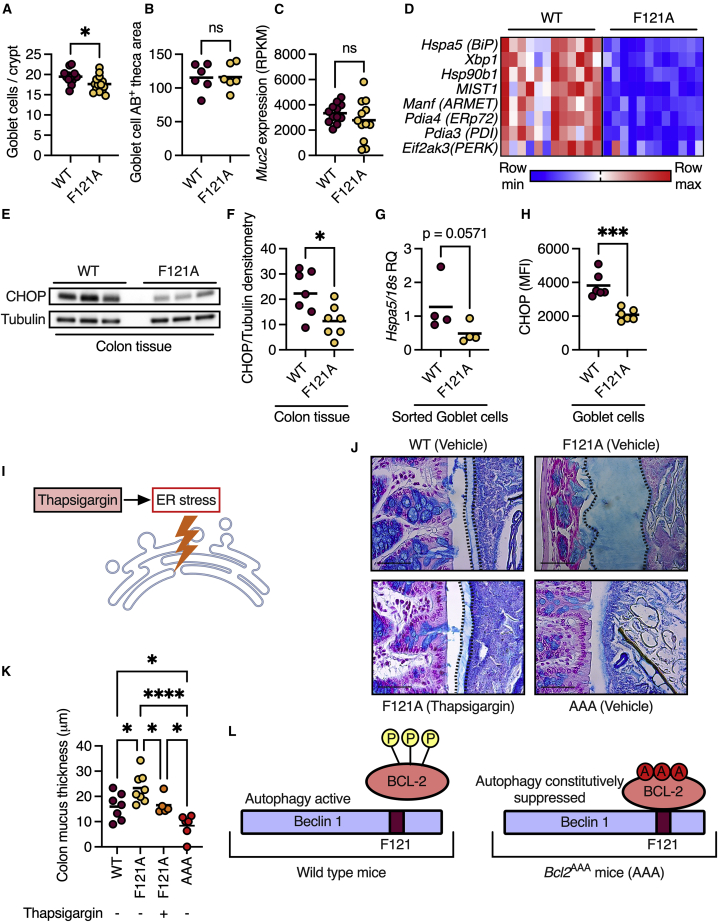
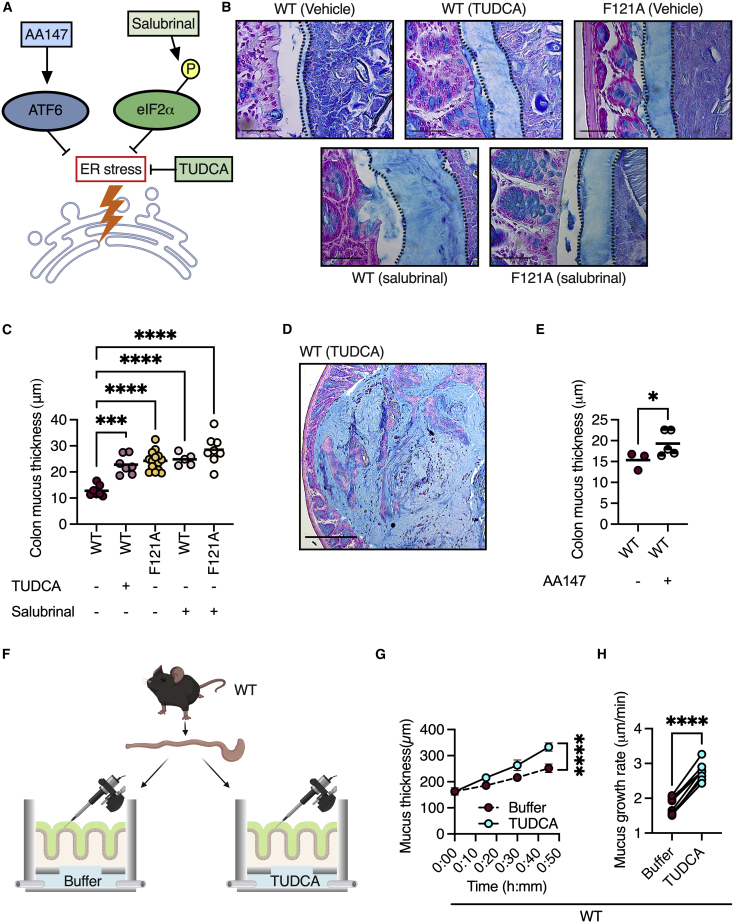
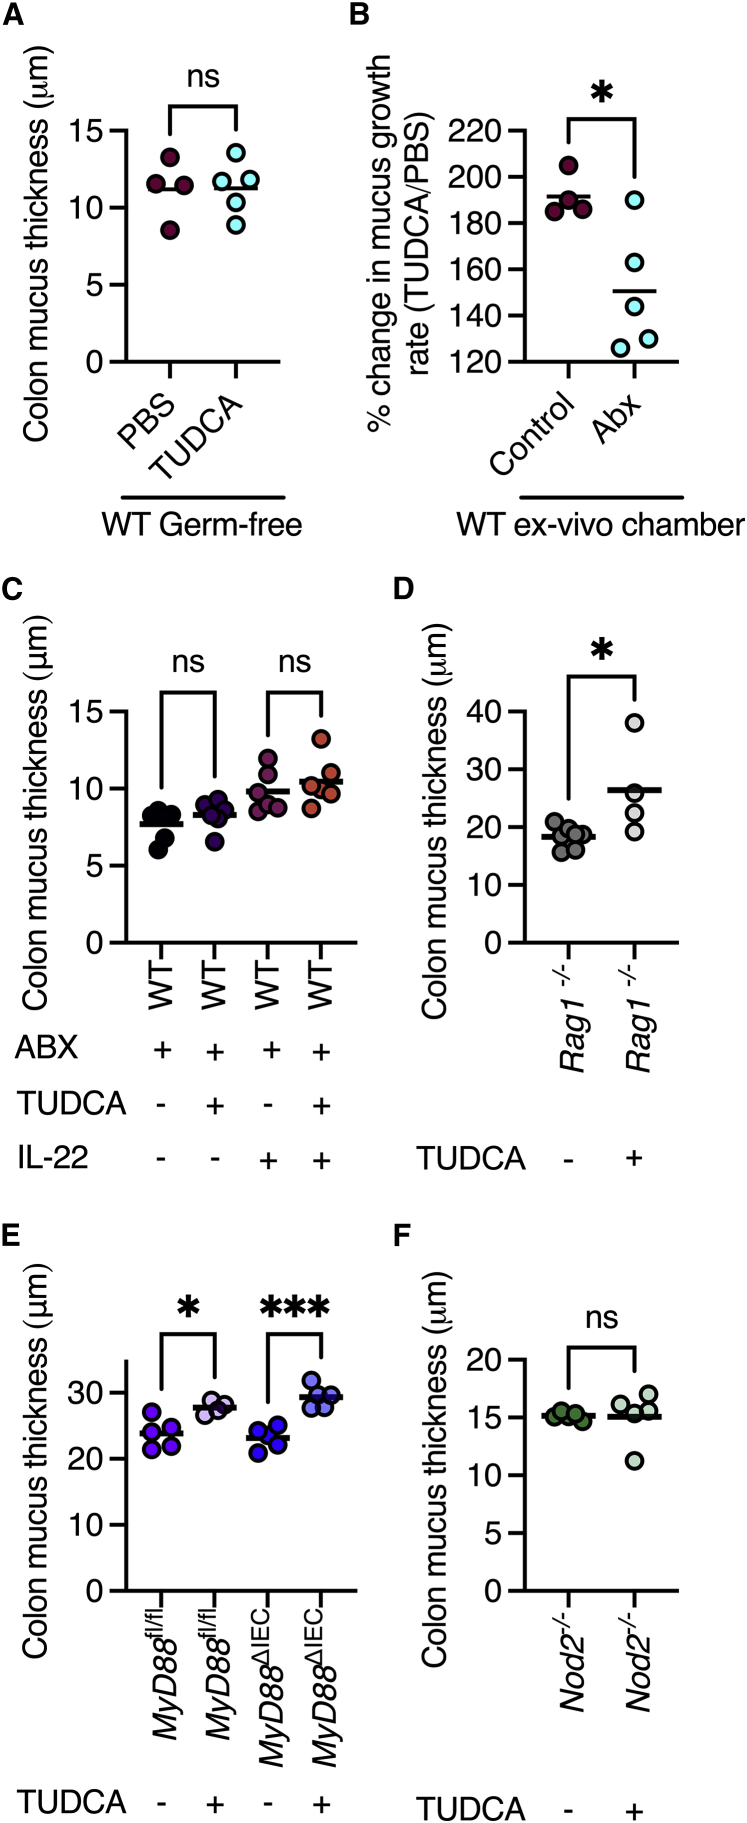
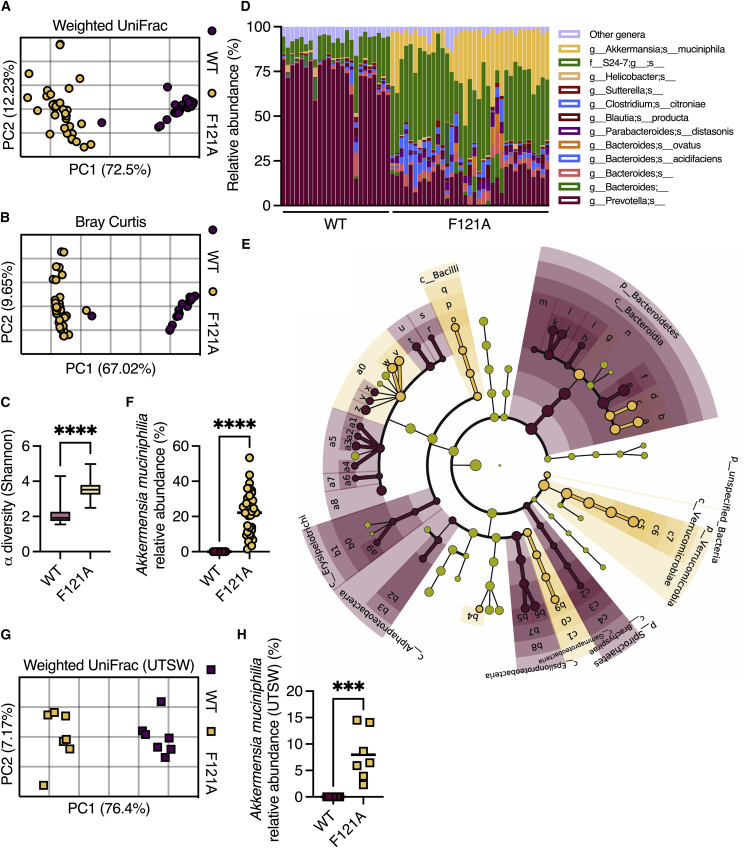
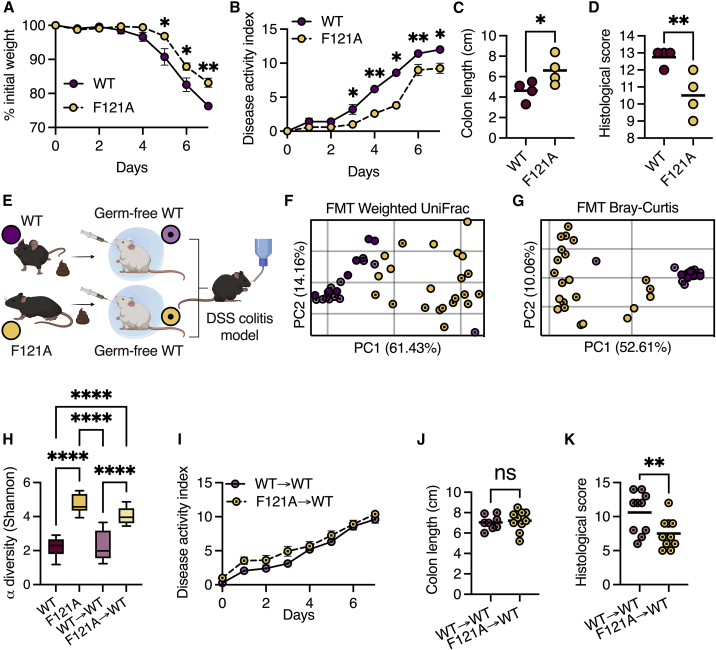
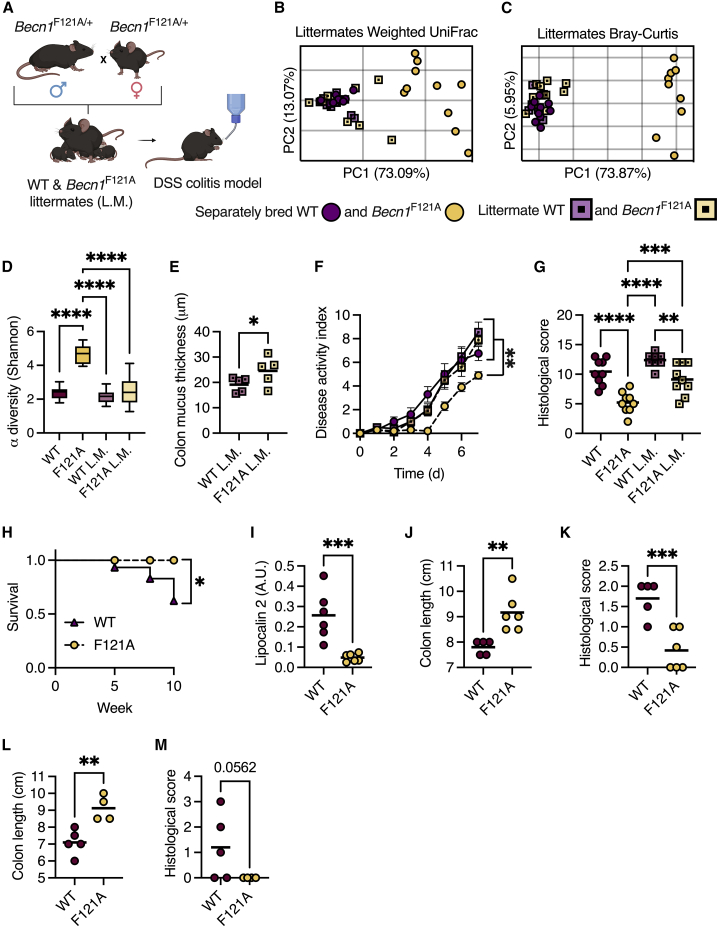
Colonic goblet cells are specialized epithelial cells that secrete mucus to physically separate the host and its microbiota, thus preventing bacterial invasion and inflammation. How goblet cells control the amount of mucus they secrete is unclear. We found that constitutive activation of autophagy in mice via Beclin 1 enables the production of a thicker and less penetrable mucus layer by reducing endoplasmic reticulum (ER) stress. Accordingly, genetically inhibiting Beclin 1-induced autophagy impairs mucus secretion, while pharmacologically alleviating ER stress results in excessive mucus production. This ER-stress-mediated regulation of mucus secretion is microbiota dependent and requires the Crohn's-disease-risk gene Nod2. Overproduction of mucus alters the gut microbiome, specifically expanding mucus-utilizing bacteria, such as Akkermansia muciniphila, and protects against chemical and microbial-driven intestinal inflammation. Thus, ER stress is a cell-intrinsic switch that limits mucus secretion, whereas autophagy maintains intestinal homeostasis by relieving ER stress.

Keywords: Beclin 1; ER stress; Nod2; autophagy; colitis; goblet cell; inflammatory bowel diseases; microbiota; mucus; unfolded protein response.


Conflict of interest statement

Declaration of interests The authors declare no competing interests.

Figures

None
Graphical abstract
Figure 1
Figure 1
Becn1F121A mice produce a thicker and less penetrable colonic mucus layer and mount a dampened immune response in the colonic tissue (A) Scheme depicting regulation of autophagy activation via Bcl-2 phosphorylation and its alteration in Becn1F121A mice. (B) Alcian blue staining of Carnoy’s-fixed colonic tissue. The mucus layer is defined by the dashed line. Scale bars, 50 μm. (C) Measurements of mucus thickness as shown in (B). (D and E) (D) Detection of TLR4 and (E) TLR5 agonist in mouse serum using reporter cell lines. (F) Principal coordinates analysis (PCoA) plot of RNA sequencing performed on colonic tissues. (G) Volcano plot of transcripts from RNA sequencing. Genes in blue were down-regulated in Becn1F121A mice compared with wild-type mice and genes in red were up-regulated. (H) Pathway analysis of transcripts, which are down-regulated in Becn1F121A mice according to GO biological function. Bars represent −log (p value) and dots represent number of genes in pathway. (I) Heatmap depicting differentially expressed innate immune genes with an FDR < 0.01. Each column represents a mouse and each row a gene. (C–F) Each dot represents a mouse. (G) Each dot represents a gene. p < 0.05; ∗∗∗p < 0.001; ∗∗∗∗p < 0.0001; Student’s t test. WT, wild type; F121A, Becn1F121A; a.u., arbitrary units.
Figure 2
Figure 2
Autophagy relieves ER stress to facilitate mucus secretion from goblet cells (A) Colonic goblet cell numbers per crypt. (B) Quantification of the mucus-filled cytoplasmatic area of colonic goblet cells. (C) Expression levels of Muc2, which encodes the mucus-forming protein MUC2 in the colons of mice via RNA sequencing. (D) Heatmap depicting differentially expressed ER stress response genes with an FDR < 0.01. Each column represents a mouse and each row a gene. (E) Representative western blot of mouse colons detected with the indicated antibodies. (F) Densitometry analysis of western blots as in (E). (G) qPCR analysis of Hspa5 mRNA in goblet cells isolated from colonic tissue via fluorescence-activated cell sorting. (H) Quantification of protein levels of CHOP, specifically in colonic goblet cells via immunohistochemistry. (I) Scheme depicting ER stress activation via thapsigargin. (J and K) Measurements of mucus thickness in colonic sections from mice treated with thapsigargin as indicated, and stained with Alcian blue. Scale bars, 50 μm. (L) Scheme depicting regulation of autophagy activation via Bcl-2 phosphorylation and its suppression in Bcl2AAA mice. (A–C, F–H, and K) Each dot represents a mouse. ns, not significant; p < 0.05; ∗∗∗p < 0.001; ∗∗∗∗p < 0.0001. (A–C and F–H) Student’s t test; (K) one-way ANOVA; WT, wild type; F121A, Becn1F121A; AAA, Bcl2AAA; AB, Alcian blue; RPKM, reads per kilobase per million mapped reads; MFI, mean fluorescent intensity; RQ, relative quantity.
Figure 3
Figure 3
ER stress is a rate-limiting switch controlling mucus secretion (A) Scheme depicting ER stress reduction by inhibiting eIF2α dephosphorylation via salubrinal, by TUDCA, or by activating ATF6 via AA147. (B–D) Measurements of mucus thickness in colonic sections from mice treated with TUDCA or salubrinal as indicated, and stained with Alcian blue. Scale bars, 50 μm. Each dot represents a mouse. (E) Measurements of mucus thickness in colonic sections from mice treated with the ATF6 activator AA147 and stained with Alcian blue. Each dot represents a mouse. (F) Scheme depicting mucus growth rate measurements. Created with BioRender.com. (G) Mucus growth over time ± SEM. (H) Mucus growth rate. Lines connect tissues from the same mouse. p < 0.05, ∗∗∗p < 0.001; ∗∗∗∗p < 0.0001; (C) one-way ANOVA; (E) Student’s t test; (G) nonlinear regression; (H) paired t test. WT, wild type; F121A, Becn1F121A; TUDCA, tauroursodeoxycholic acid.
Figure 4
Figure 4
ER stress-controlled mucus secretion is regulated by the microbiota and Nod2 (A) Measurements of mucus thickness in colonic section from wild-type germ-free mice treated with TUDCA. (B) % change in mucus secretion rates in response to TUDCA of colonic tissues from mice untreated or treated with antibiotics. (C) Measurements of mucus thickness in colonic sections from wild-type mice treated with combinations of antibiotics, TUDCA, and IL-22. (D) Measurements of mucus thickness in colonic sections from Rag1−/− mice treated with TUDCA. (E) Measurements of mucus thickness in colonic sections from MyD88fl/fl and MyD88ΔIEC mice treated with TUDCA. (F) Measurements of mucus thickness in colonic sections from Nod2−/− mice treated with TUDCA. (A–F) Each dot represents a mouse. ns, not significant; p < 0.05; ∗∗∗p < 0.001. (A, B, D, and F) Student’s t test; (C and E) one-way ANOVA; WT, wild type; TUDCA, tauroursodeoxycholic acid; ABX, antibiotics; IL-22, interleukin 22; fl, flox; IEC, intestinal epithelial cell.
Figure 5
Figure 5
Becn1F121A mice contain an altered gut microbiota 16S rRNA sequencing was performed to characterize gut microbiota composition. (A and B) (A) PCoA of fecal microbiota β diversity based on weighted UniFrac and (B) Bray-Curtis dissimilarity in mice housed at the Bar-Ilan University. (C) α diversity comparison based on richness and evenness. (D) Relative taxonomic composition. (E) Cladogram depicting LEfSe analysis of differently abundant bacteria in wild-type and Becn1F121A mice. (F) Relative abundance of Akkermansia muciniphila in mice housed at the Bar-Ilan University. (G) Principal coordinates analysis (PCoA) of fecal microbiota β diversity based on weighted UniFrac on mice housed at UTSW. (H) Relative abundance of Akkermansia muciniphila in mice housed at UTSW. (A, B, and F–H) Each symbol represents a mouse. (D) Each column represents a mouse. ∗∗∗p < 0.001; ∗∗∗∗p < 0.0001; (C, F and H) Student’s t test. WT, wild type; F121A, Becn1F121A; UTSW, UT Southwestern.
Figure 6
Figure 6
The microbiota of Becn1F121A mice confers protection from colitis (A–D) Mice were treated with 3% DSS for 7 days. (A) Relative weight change ± SEM, (B) disease activity index ± SEM, (C) colon length, and (D) histological damage score. (E) Scheme depicting FMT experiment. Created with BioRender.com. (F and G) PCoA of fecal microbiota β diversity based on weighted UniFrac (F) and Bray-Curtis dissimilarity (G) of wild-type germ-free mice following FMT and separately housed wild-type and Becn1F121A mice fecal donors. (H) α diversity comparison based on richness and evenness of wild-type germ-free mice following FMT. (I–K) Mice were treated with 3% DSS for 7 days following FMT. (I) Disease activity index ± SEM, (J) colon length and histological damage score (K). (C, D, F, G, J, and K) Each symbol represents a mouse. p < 0.05; ∗∗p < 0.01; ∗∗∗∗p < 0.0001; (C, D, J, and K) Student’s t test; (A, B, and I) multiple t tests corrected for false discovery rate; (H) one-way ANOVA. WT, wild type; F121A, Becn1F121A; FMT, fecal microbiota transplant.
Figure 7
Figure 7
Becn1F121A mice are protected from DSS- and AIEC-induced colitis in a microbiota-independent manner (A) Scheme depicting littermate (L.M.) experimental design. Created with BioRender.com. (B and C) (B) PCoA of fecal microbiota β diversity based on weighted UniFrac and (C) Bray-Curtis dissimilarity of separately bred and littermate wild-type and Becn1F121A mice. (D) α diversity comparison based on richness and evenness. (E) Measurements of mucus thickness in colonic section from littermate mice stained with Alcian blue. (F and G) Disease activity index ± SEM (F), and histological damage score (G) of mice treated with 3% DSS for 7 days. (H–K) Survival curve (H), stool lipocalin 2 levels (I), colon length (J), and histological damage score (K) of mice pretreated with 20 mg streptomycin and infected with 108 CFU AIEC for 10 weeks. (L and M) Colon length (L) and histological score (M) of mice pretreated with 20 mg streptomycin and infected with 108 CFU AIEC for 14 days. (B, C, E, G, and I–M) Each symbol represents a mouse. p < 0.05; ∗∗p < 0.01; ∗∗∗p < 0.001; ∗∗∗∗p < 0.0001; (D and G) one-way ANOVA; (E and I–M) Student’s t test. WT, wild type; F121A, Becn1F121A; L.M., littermates; a.u., arbitrary units.

Comment in

References

    1. Johansson M.E.V., Hansson G.C. Immunological aspects of intestinal mucus and mucins. Nat. Rev. Immunol. 2016;16:639–649. doi: 10.1038/nri.2016.88. - DOI - PMC - PubMed
    1. Johansson M.E.V., Gustafsson J.K., Holmén-Larsson J., Jabbar K.S., Xia L., Xu H., Ghishan F.K., Carvalho F.A., Gewirtz A.T., Sjövall H., et al. Bacteria penetrate the normally impenetrable inner colon mucus layer in both murine colitis models and patients with ulcerative colitis. Gut. 2014;63:281–291. doi: 10.1136/GUTJNL-2012-303207. - DOI - PMC - PubMed
    1. van der Post S., Jabbar K.S., Birchenough G., Arike L., Akhtar N., Sjovall H., Johansson M.E.V., Hansson G.C. Structural weakening of the colonic mucus barrier is an early event in ulcerative colitis pathogenesis. Gut. 2019;68:2142–2151. doi: 10.1136/GUTJNL-2018-317571. - DOI - PMC - PubMed
    1. Kaser A., Blumberg R.S. The road to Crohn’s disease. Science. 2017;357:976–977. doi: 10.1126/science.aao4158. - DOI - PMC - PubMed
    1. Fernández Á.F., Sebti S., Wei Y., Zou Z., Shi M., McMillan K.L., He C., Ting T., Liu Y., Chiang W.-C., et al. Disruption of the beclin 1–BCL2 autophagy regulatory complex promotes longevity in mice. Nature. 2018;558:136–140. doi: 10.1038/s41586-018-0162-7. - DOI - PMC - PubMed