. 2023 Feb 15;111(4):539-556.e5.
doi: 10.1016/j.neuron.2023.01.009. Epub 2023 Feb 3.

Mouse population genetics phenocopies heterogeneity of human Chd8 haploinsufficiency

Affiliations

Mouse population genetics phenocopies heterogeneity of human Chd8 haploinsufficiency

Manal Tabbaa et al. Neuron. .

Abstract

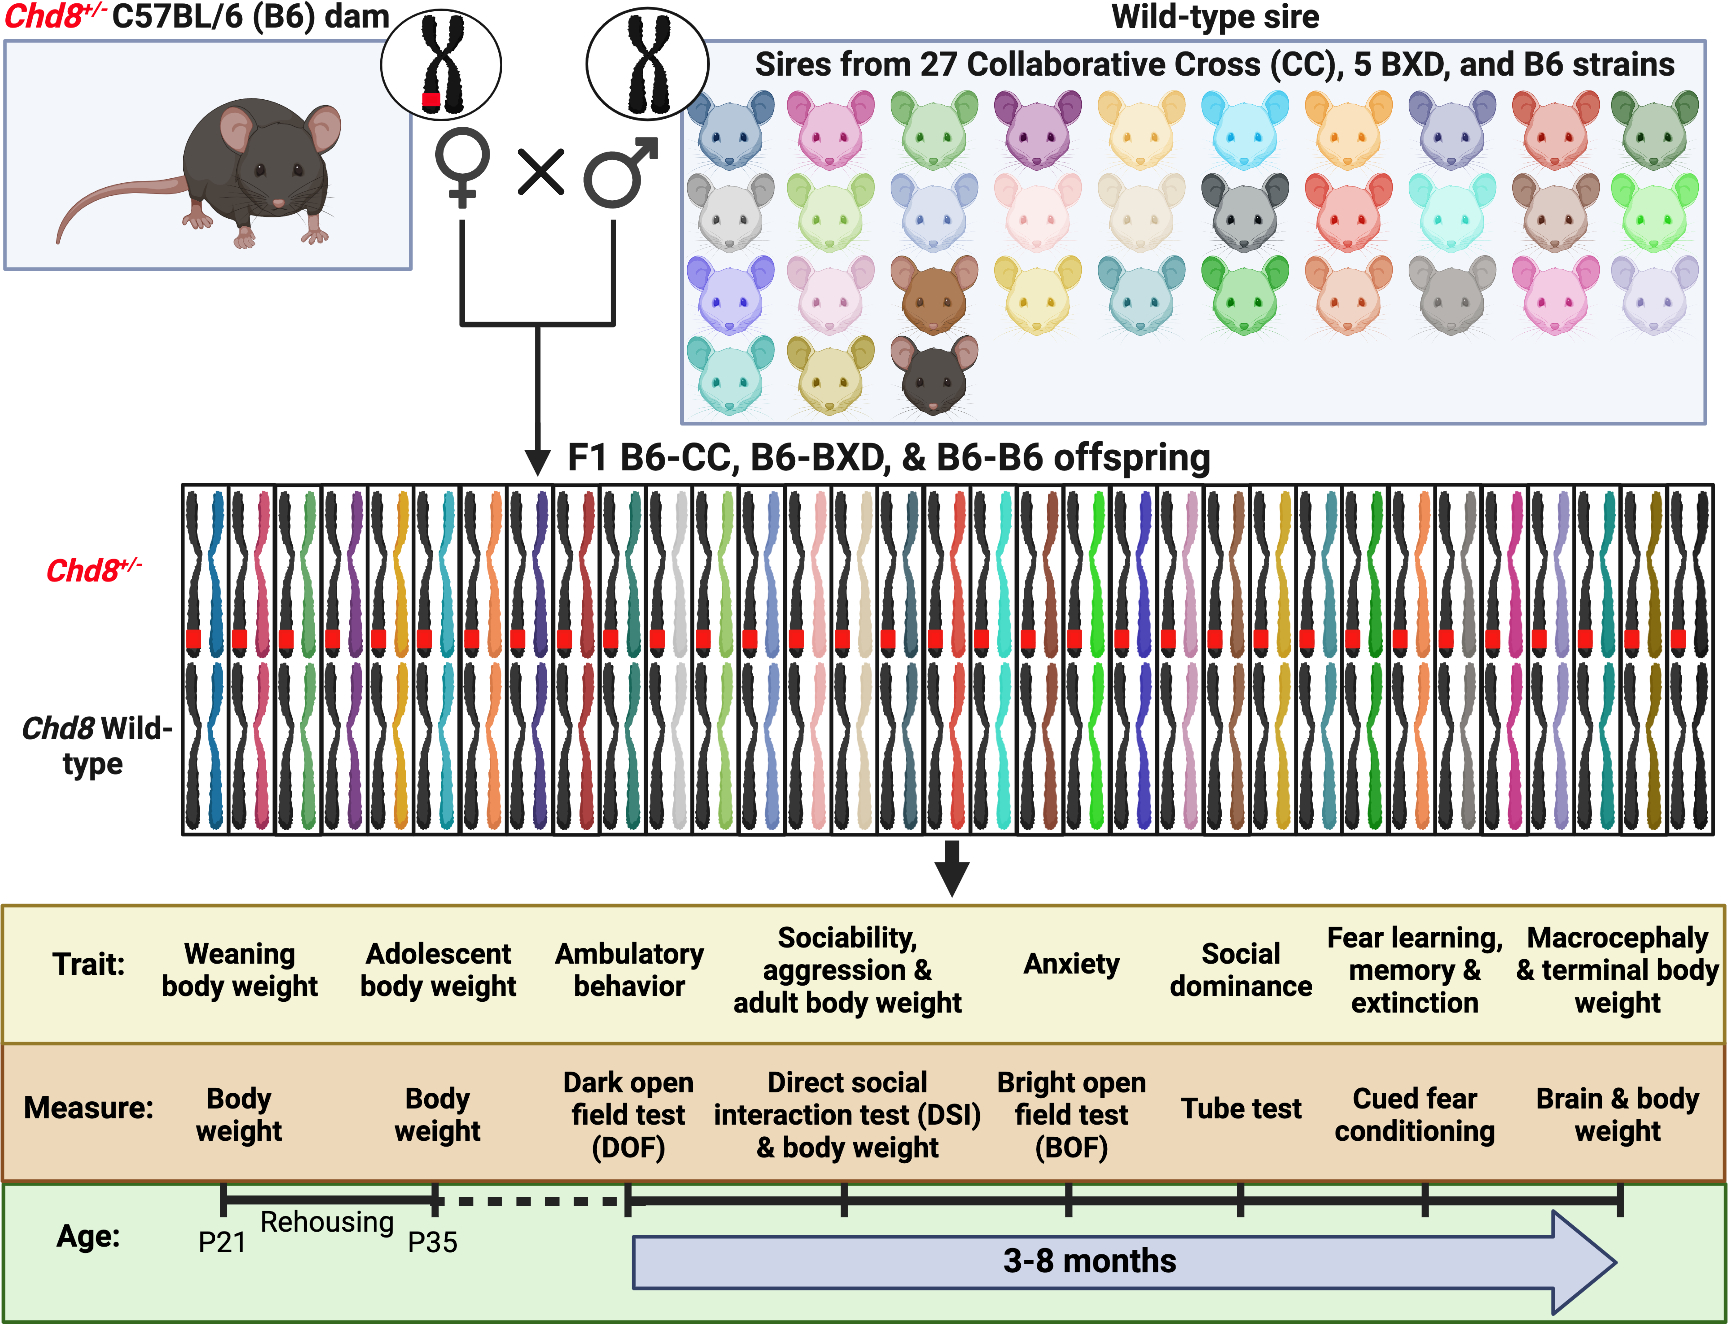
Preclinical models of neurodevelopmental disorders typically use single inbred mouse strains, which fail to capture the genetic diversity and symptom heterogeneity that is common clinically. We tested whether modeling genetic background diversity in mouse genetic reference panels would recapitulate population and individual differences in responses to a syndromic mutation in the high-confidence autism risk gene, CHD8. We measured clinically relevant phenotypes in >1,000 mice from 33 strains, including brain and body weights and cognition, activity, anxiety, and social behaviors, using 5 behavioral assays: cued fear conditioning, open field tests in dark and bright light, direct social interaction, and social dominance. Trait disruptions mimicked those seen clinically, with robust strain and sex differences. Some strains exhibited large effect-size trait disruptions, sometimes in opposite directions, and-remarkably-others expressed resilience. Therefore, systematically introducing genetic diversity into models of neurodevelopmental disorders provides a better framework for discovering individual differences in symptom etiologies.

Keywords: BXD; CHD8; autism; collaborative cross; learning and memory; macrocephaly; risk susceptibility; social behavior; symptom severity; translational research.


Conflict of interest statement

Declaration of interests P.L. is a member of the journal’s advisory board.

Figures

Figure 1.
Figure 1.. Modeling population and individual differences in phenotypic responses to Chd8 haploinsufficiency.
Chd8 heterozygous (Chd8+/−) C57BL/6 (B6) dams were mated with wild-type (WT) sires from 27 Collaborative Cross (CC), 5 BXD, and B6 strains to produce F1 B6-CC, B6-BXD, and B6-B6 male and female and WT and Chd8+/− offspring. Subjects were weaned and genotyped at postnatal day (P) 21 and rehoused before P35 to 2 WT and 2 Chd8+/− same -sex and -strain mice per cage, with littermates preferentially housed together. Behavioral testing began at a mean age of ~P115 and was conducted in the order shown on the timeline. Thirty-three strains (8 subjects per Chd8 genotype and sex) were included for all measures except the social dominance test, which included 21 strains (6 subjects per Chd8 genotype and sex). Figure adapted from Sittig et al., 2016.
Figure 2.
Figure 2.. Population-based penetrance of phenotypic differences caused by Chd8 haploinsufficiency differs across traits.
Trait distributions for Chd8 genotype groups in the combined strain and sex population. Mann-Whitney U tests revealed significant median population shifts (*p < 0.05) between wild-type (WT: blue) and Chd8+/− (HET; orange) populations in social dominance over opposite Chd8 genotype cagemates (A; U=4399, p < 0.001) and strangers (B; U= 5694, p < 0.001), brain weight (C; U= 82,140, p < 0.001), distance traveled in the dark open field (DOF) test (D; U= 191,343, p < 0.001), body weight at weaning (E; U= 169,334, p < 0.001), adolescence (F; U= 156,371, p < 0.001), adulthood (G; U= 153,917, p < 0.001), and study termination (H; U= 152,971, p < 0.001), duration of partner sniffing (I; U= 105,271, p < 0.001) and aggression (J; U= 124514, p < 0.05) in the direct social interaction (DSI) task, and anxiety-like behavior in the bright open field (BOF) task (increased anxiety is reflected by decreased % center distance, K; U= 158549, p <0.001). Gray shading reflects overlapping WT and HET populations. Percent time freezing during fear acquisition (L; U= 130,309, p = 0.18), expression (M; U = 126,341, p= 0.11), and extinction (N; U= 138,703, p = 0.35) were not significantly different. Heritability estimates (H2) are calculated for the WT population and are based on inter- and intra- strain variance for each trait. Total n = 498 for panels A-B and ~1,041 for panels C-N. See also Table S1.
Figure 3.
Figure 3.. Genetic background modifies the effect of Chd8 haploinsufficiency on decreased body weight and macrocephaly.
Body weights increased over time (A; Repeated measures ANOVA weight: F3, 2,649 = 3,6181.0, p < 0.001) and in males more than females (weight by sex: F3, 2,649 = 1,506.0, p < 0.001). Chd8+/− males and females had smaller body weight trajectories than WT (weight by genotype effect: F3, 2,649 = 42.7, p < 0.001; A). Strain significantly modified the impact of Chd8 genotype on body weight trajectories (weight by genotype by strain: F96, 2,649 = 2.0, p < 0.001). B6-CC7, B6-CC28, and B6-CC10 body weight trajectories highlight representative strains that were differentially impacted by Chd8+/− (B-D). Chd8+/− males and females had lower body weights compared to WT at weaning (E; males F1, 516 = 31.3, p < 0.001, females F1, 519 = 24.9, p < 0.001), adolescence (H; males F1, 518 = 25.6, p < 0.001, females F1, 519 = 17.9, p < 0.001), adulthood (K; males F1, 520 = 19.1, p < 0.001, females F1, 518 = 13.4, p < 0.001), and at the end of life (“terminal”; N; males F1, 513 = 26.3, p < 0.001, females F1, 506 = 21.4, p < 0.001). The impact of Chd8+/− on body weights at each time point and brain weights depended on strain and sex (F-G, I-J, L-M, O-P, R-S). Chd8+/− brains weighed more than WT brains in males (F1, 518 = 101.9, p < 0.001) and females (F1, 511 = 34.0, p < 0.001; Q) and the impact was greater in males (Chd8 genotype by sex interaction: F1, 1,031 = 4.1, p < 0.05; T). Note that graphs in Q-T do not start at 0. Females brains weighed more than males (F1, 1,031 = 42.0, p < 0.001; Q). Trait means +/− SEM are plotted for all line and bar graphs. * = p < 0.05 ANOVA; + = p < 0.05 Mann-Whitney U test. Violin plots show individual data points per defined group. The label for B6 (B6-B6) is highlighted in red. See also Figure S1.
Figure 4:
Figure 4:. The impact of Chd8 haploinsufficiency on social behaviors depends on genetic background and sex.
Chd8+/− males (F1, 517 = 22.2, p < 0.001) and females (F1, 516 = 21.6, p < 0.001) spent more time sniffing a same-sex B6 juvenile during the DSI task compared to WT (A). Males had higher sniffing durations than females (A; F1, 1,035 = 172.2, p < 0.001). Chd8+/− males exhibited increased aggression compared to WT males (D; F1, 517 = 7.3, p < 0.05). Chd8+/− males also had increased aggression in the DSI test compared to Chd8+/− females (F1, 1,035 = 5.8, p < 0.001). The impact of Chd8+/− on sniffing and aggression depended on strain in males (B, E) and females (C, F). In the SD task, Chd8+/− males (F1, 248 = 420.4, p < 0.001) and females (F1, 248 = 926.2, p < 0.001) won more matches against WT same -sex and –strain cagemates (G) as well as strangers from different cages (K; males F1, 248 = 289.4, p < 0.001, females F1, 248 = 491.0, p < 0.05). The effect was greater in females than in males (H, L). Context also mattered as Chd8+/− females won more matches against familiar cagemates (G) compared to strangers (K; F1,497 = 11.0, p < 0.001). In males, a context by strain by Chd8 genotype 3-way interaction (F1, 497 = 491.0, p < 0.001) indicated that B6-CC12 WT males were significantly dominant over Chd8+/− cagemates while there was no difference in dominance between strangers (I, M). Violin plots show individual data points. Trait means +/− SEM are plotted in B, C, E, F, H-J, and L-N. * = p < 0.05 ANOVA; + = p < 0.05 Mann-Whitney U test. For DSI males and females, strains are presented in rank order of WT sniffing durations, and the same order is maintained for aggression (E, F). For SD, strains are presented in rank order of low-to-high % wins of WT females against cagemates; this order is maintained in I, M, and N. The label for B6 is highlighted in red.
Figure 5.
Figure 5.. Genetic background modifies the impact of Chd8 haploinsufficiency on decreased activity, increased anxiety-like behavior, and bidirectional fear conditioning responses.
In the DOF test, Chd8+/− males (F1, 519 = 125.2, p < 0.001) and females (F1, 516 = 119.4, p < 0.001) traveled less distance in the DOF compared to WT (A). WT females had increased activity in the DOF test compared to WT males (F1, 1,037 = 4.3, p < 0.001; A). Out of the total distance traveled in the BOF test, Chd8+/− males (F1, 520 = 16.2, p < 0.001) and females (F1, 516 = 14.0, p < 0.001) traveled less in the center of the BOF (% center distance) compared to WT (D). Females had increased anxiety-like behavior in the BOF test compared to males, indicated by decreased % center distance traveled (D; F1, 1,038 = 17.0, p < 0.001). There were no effects of Chd8+/− on fear conditioning in males and females in the combined population, including fear acquisition, expression, and extinction (K, N, Q). Females froze more than males during fear acquisition (d = −0.4) and expression (d = −0.1) and froze less during extinction (d = 0.2), indicating more robust cued fear conditioning and extinction (K, N, Q). The impact of Chd8+/− on DOF ambulatory behavior, BOF anxiety-like behavior, and fear learning and memory depended on the strain and sex (B-C, E-F, L-M, O-P, R-S). Fear conditioning trajectories across the combined population versus representative strains are highlighted in B6-CC24, B6-CC10, and B6-CC28 (H-J). See also Figure S2. Violin plots show individual data points. Trait means +/− SEM groups are plotted in B-C, E-J, L-M, O-P, and R-S. * = p < 0.05 ANOVA; + = p < 0.05 Mann-Whitney U test. The label for B6 is highlighted in red.
Figure 6.
Figure 6.. Trait relations and the impact of Chd8 haploinsufficiency on trait principal components and SD.
Principal Component Analysis (PCA) extracted 5 principal components (PCs) that captured 68% of the trait variance (A). Bold numbers indicate coefficients greater than 0.4, reflecting traits that highly covary within a PC. Traits are color-coded by similarity to each other along with their respective high loading coefficients. F statistics are reported for each PC from 3-way ANOVA (* p < 0.05; A). Note that BOF percent center time is shown, and a higher percent time in the center indicates lower anxiety (A). Data points in the line graphs B-H represent the mean PC score (B-F), or percent SD wins (G-H). PC scores are the net value of the traits weighted by the PC loading coefficient. The slope and direction of the lines connecting the WT and Chd8+/− indicate the magnitude and direction of the effect. Thirty-three strains were included in the PCA (A-F), and 21 strains were tested for SD (G, H; 3-way Chd8 genotype by strain by sex interaction, stranger opponent: F1, 498 = 4.4, P < 0.001; cagemate opponent: F1, 498 = 6.5, P < 0.001). Lines in G-H connect WT and Chd8+/− (HET) males and females per strain, and colors represent different strains (See Table S2 for PC and SD SEM).
Fig 7.
Fig 7.. Severity of Chd8 haploinsufficiency trait disruption varies broadly for every trait and is modified by strain and sex.
The population distributions of Chd8+/− strain effect sizes vary across traits (A; N = 66 strain and sex groups d per trait). Cohen’s D effect size distributions for Chd8+/− strain effects across 12 traits revealed marked heterogeneity in the combination of impacted traits within strains and sexes (B). Colors represent traits. Red lines highlight large effect sizes (i.e., |d| = 0.8). The summed absolute value of the effect sizes across 12 traits for males (blue) and females (red) varies between strains and sexes (C). Strains are ordered in ascending trait means for males (B-C). The number of traits on which strains and sexes are impacted with large effect sizes also varies (D). Strains in panel D are graphed in the same order as panel C. BW: body weight. See also Table S2.
Figure 8.
Figure 8.. Genetic background regulates the covariance of traits impacted by Chd8 haploinsufficiency across a population.
Exploratory factor analysis (EFA) on Chd8+/− strain effect sizes resulted in five factor scores (FS; A). Loadings ≥ 0.4 are bolded and color-coded with the corresponding trait. Hierarchical cluster analysis (HCA) on Chd8+/−strain effects produced congruent results to EFA reflected by the dendrogram (B). Significant (p < 0.05) Spearman’s correlation coefficients for Chd8+/− strain effects across traits are bolded (C). Heatmaps of Chd8+/− strain effects summed across 12 traits (total effect size) and across individual traits and principal components (PC 1–5) with strains and sexes ordered by their similarities as determined by HCA (represented by dendrogram; D). Cohen’s d effect size means (+/− SEM) for each cluster varies across traits (E). Line colors represent different clusters. Line thickness and numbers in the legend reflect the number of strain and sex groups per cluster. See also Table S3. BW: body weight; DOF: Dark Open Field; BOF: Bright Open Field; DSI: Direct Social Interaction

References

    1. Antaki D, Guevara J, Maihofer AX, Klein M, Gujral M, Grove J, Carey CE, Hong O, Arranz MJ, Hervas A, et al. (2022). A phenotypic spectrum of autism is attributable to the combined effects of rare variants, polygenic risk and sex. Nat. Genet., 1–9. 10.1038/s41588-022-01064-5. - DOI - PMC - PubMed
    1. Warrier V, Zhang X, Reed P, Havdahl A, Moore TM, Cliquet F, Leblond CS, Rolland T, Rosengren A, EU-AIMS LEAP, et al. (2022). Genetic correlates of phenotypic heterogeneity in autism. Nat. Genet. 10.1038/s41588-022-01072-5. - DOI - PMC - PubMed
    1. Jeste SS, and Geschwind DH (2014). Disentangling the heterogeneity of autism spectrum disorder through genetic findings. Nat. Rev. Neurol. 10, 74–81. 10.1038/nrneurol.2013.278. - DOI - PMC - PubMed
    1. Sl S, Rf A, and Ma S (1988). Autism and genetics. A decade of research. Arch. Gen. Psychiatry 45. 10.1001/archpsyc.1988.01800340081013. - DOI - PubMed
    1. Ritvo ER, Freeman BJ, Mason-Brothers A, Mo A, and Ritvo AM (1985). Concordance for the syndrome of autism in 40 pairs of afflicted twins. Am. J. Psychiatry 142, 74–77. 10.1176/ajp.142.1.74. - DOI - PubMed

Publication types

LinkOut - more resources