. 2023 Mar;299(3):102976.
doi: 10.1016/j.jbc.2023.102976. Epub 2023 Feb 3.

A novel compound targets the feline infectious peritonitis virus nucleocapsid protein and inhibits viral replication in cell culture

Affiliations

A novel compound targets the feline infectious peritonitis virus nucleocapsid protein and inhibits viral replication in cell culture

Nazleen Mohseni et al. J Biol Chem. 2023 Mar.

Abstract

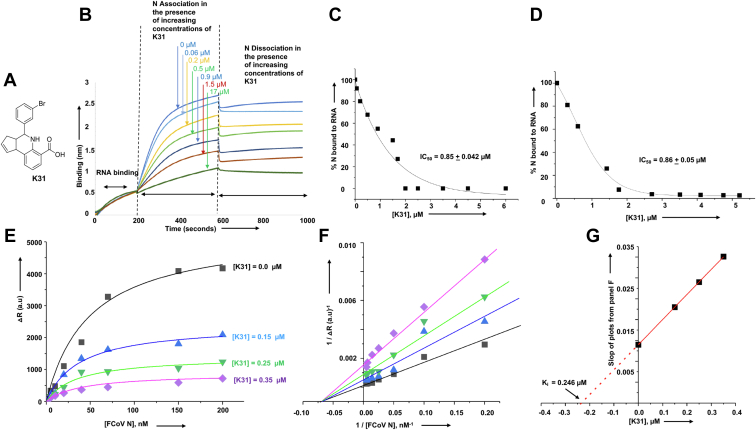
Feline infectious peritonitis (FIP) is a serious viral illness in cats, caused by feline coronavirus. Once a cat develops clinical FIP, the prognosis is poor. The effective treatment strategy for coronavirus infections with immunopathological complications such as SARS-CoV-2, MERS, and FIP is focused on antiviral and immunomodulatory agents to inhibit virus replication and enhance the protective immune response. In this article we report the binding and conformational alteration of feline alphacoronavirus (FCoV) nucleocapsid protein by a novel compound K31. K31 noncompetitively inhibited the interaction between the purified nucleocapsid protein and the synthetic 5' terminus of viral genomic RNA in vitro. K31 was well tolerated by cells and inhibited FCoV replication in cell culture with a selective index of 115. A single dose of K31inhibited FCoV replication to an undetectable level in 24 h post treatment. K31 did not affect the virus entry to the host cell but inhibited the postentry steps of virus replication. The nucleocapsid protein forms ribonucleocapsid in association with the viral genomic RNA that serves as a template for transcription and replication of the viral genome. Our results show that K31 treatment disrupted the structural integrity of ribonucleocapsid in virus-infected cells. After the COVID-19 pandemic, most of the antiviral drug development strategies have focused on RdRp and proteases encoded by the viral genome. Our results have shown that nucleocapsid protein is a druggable target for anticoronavirus drug discovery.

Keywords: antivirals; coronavirus; nucleocapsid protein; virus; virus replication.


Conflict of interest statement

Conflict of interest The authors declare that they have no conflicts of interest with the contents of this article.

Figures

Figure 1
Figure 1
Purification of FIPV N protein (N) and RNA binding.A, purification of FCoV nucleocapsid protein (N) using Ni-NTA chromatography. B, binding profile, generated by filter binding analysis, for the interaction of N with the vRNA 5′ NCR sequence (5′ACUUUUAAAGUAAAGUGAGUGUAGCGUGGCUAUAAC3′) in binding buffer containing 160 mM NaCl concentration. Inset shows the double reciprocal plot for the calculation of ΔRmax, used to calculate the percent bound RNA at each input concentration of N (see Experimental procedures for details). C, representative biolayer interferometry sensograms showing the overtime association and dissociation of N with the vRNA 5′ NCR sequence shown above. The sensograms were generated at three different concentrations of N. For details see Experimental procedures.
Figure 2
Figure 2
Inhibition of N–vRNA interaction by K31.A, structure of K31. B, representative biolayer interferometry sensograms showing the overtime association and dissociation of N (120 nM) with the vRNA 5′ NCR sequence in the presence of increasing input concentration of K31, shown by vertical arrows. C, the inhibition profile showing the percentage of N bound to the vRNA 5′ NCR sequence at each input concentration of K31. The data from A were used to calculate the percentage of N bound to the vRNA 5′ NCR sequence at each input concentration of K31, as mentioned in Experimental procedures. D, the N–5′ NCR complex was chased with increasing concentrations of K31. The percentage of N bound to the RNA was plotted versus each input concentration of K31 to generate the inhibition profile for the calculation of IC50. E, binding profiles for N–5′ NCR interaction, generated by plotting ΔR (differential radioactive signal) versus N concentration. The four binding profiles were generated at four different K31 concentrations as shown (see Experimental procedures for details). F, the Lineweaver–Burk plots were generated using the data from E. G, the secondary plot was generated by plotting the slopes of Lineweaver–Burk plots from F versus input K31 concentration. The data points were fit to straight line.
Figure 3
Figure 3
Binding of N with K31.A, representative biolayer interferometry sensograms showing the overtime association and dissociation of K31 with the purified N. The sensograms were generated at three different concentrations (20 μM, 10 μM, and 5 μM) of K31, as shown by three different colors. For details see Experimental procedures. B, representative biolayer interferometry sensograms showing the overtime association and dissociation of K31 with the synthetic vRNA 5′ NCR sequence. The sensograms were generated at 20 μM and 10 μM of K31. No binding was observed. C, fluorescence titration of hydrophobic fluorophore (bis-ANS) with N, and N–K31 complex. The fluorophore was excited at 399 nm, and the fluorescence emission signal was recorded at 485 nm. Shown are the titration curves of bis-ANS binding with free N (black filled square) and N–K31 complex (red circle).
Figure 4
Figure 4
Cytotoxicity of CRFK cells with K31. CRFK cells were incubated with increasing concentrations of K31 for 48 h. Live cells at each input concentration of K31 were calculated as mentioned in Experimental procedures and plotted versus K31 concentration to generate the shown plot.
Figure 5
Figure 5
Inhibition of FCoV by K31 in cell culture. CRFK cells were grown in six-well plates and treated with either dimethyl sulfoxide (DMSO) or 10 μM K31 dissolved in DMSO. Immunostaining was carried out as mentioned in Experimental procedures.
Figure 6
Figure 6
Dose–response curve for the inhibition of FCoV and HCoV-OC43 by K31, GS441524, and GC376 in cell culture. CRFK cells (A, B and EH) and HUVECs (C and D) were infected with FCoV (strain FIPV-79-4418) and HCoV-OC43, respectively. Cells were incubated with increasing concentrations of K31 (AD), GS441524 (E and F), and GC376 (G and H) for 24 h post infection. Cells were lysed, and viral genomic RNA was quantified at each input concentration of the inhibitor by real-time PCR. The percentage of viral genomic RNA related to untreated control was determined and plotted versus inhibitor concentration (left panels). The data from left panels were used to calculate percent viral inhibition by subtracting the y-axis value corresponding to each input inhibitor concentration from the y-axis value when inhibitor concentration was zero. The resulting percent viral inhibition was plotted versus the corresponding input inhibitor concentration (right panels). The data points were fit to dose–response curve using Origin 6.0 Pro for the calculation of EC50 values. See Experimental procedures for details.
Figure 7
Figure 7
Plaque assay to examine the viral titers.A, CRFK cells infected with FCoV were treated with K31 (10 μM), GS441524 (10 μM), or GC376 (5 μM) or left untreated as control. The medium from infected cells was harvested 24 h post infection and applied to CRFK cells following a 100-fold dilution series. After Oxoid agar-medium overlay the plates were incubated for 3 days in CO2 incubator before the cells were fixed with 3.7% formaldehyde and stained with 0.1% crystal violet. Shown is the representative example of the plaque at different dilutions of the harvested medium. Titers were determined by plaque counts and are presented as plaque forming units (PFU)/ml in (B).
Figure 8
Figure 8
Mode of action for K31. CRFK cells seeded in 12-well plates were infected with FCoV (MOI of ∼0.1) and treated with 10 μM K31. The K31 was delivered to cells by pretreatment, posttreatment, or pre/posttreatment, as discussed in the Results. Virus replication was monitored 24 h post infection by the visualization of N using immunofluorescence staining.
Figure 9
Figure 9
K31 inhibits vRNA–N interaction in virus-infected cells.A, CRFK cells were grown in three 10-cm dishes. Two of the dishes were infected with FCoV (MOI of ∼0.1). One of the infected dishes was treated with 30 μM K31 2 h before harvesting. Cells from all three dishes were lysed 24 h post infection. A volume of 20 μl of the lysate was separated on SDS-PAGE gel and examined by Western blot analysis using mouse anti-N monoclonal antibody. A1, total RNA was purified from 50 μl of the lysate, and FCoV genomic RNA was quantified by real-time PCR. B and B1, the lysate from A was immunoprecipitated by mouse anti-N monoclonal antibody. The lysate after immunoprecipitation referred to as “post-iPed lysate” was saved. The immunoprecipitated material (B) and post-iPed lysate (B1) were examined by Western blot analysis using guinea pig anti-FIP serum as primary antibody and anti–guinea pig secondary antibody. B2, total RNA was purified from both iPed material and post-iPed lysate, and FIP vRNA was quantified by real-time PCR. C and C1, the lysate from A was immunoprecipitated by mouse IgG. The immunoprecipitated material (C) and post-iPed lysate (C1) were examined by Western blot analysis as mentioned in B and B1. C2, total RNA was purified from both iPed material and post-iPed lysate, and FIP vRNA was quantified by real-time PCR.

References

    1. Sparkes A.H., Gruffydd-Jones T.J., Harbour D.A. Feline coronavirus antibodies in UK cats. Vet. Rec. 1992;131:223–224. - PubMed
    1. Addie D.D., Jarrett O. A study of naturally occurring feline coronavirus infections in kittens. Vet. Rec. 1992;130:133–137. - PubMed
    1. Vennema H., Poland A., Foley J., Pedersen N.C. Feline infectious peritonitis viruses arise by mutation from endemic feline enteric coronaviruses. Virology. 1998;243:150–157. - PMC - PubMed
    1. Poland A.M., Vennema H., Foley J.E., Pedersen N.C. Two related strains of feline infectious peritonitis virus isolated from immunocompromised cats infected with a feline enteric coronavirus. J. Clin. Microbiol. 1996;34:3180–3184. - PMC - PubMed
    1. Pedersen N.C., Eckstrand C., Liu H., Leutenegger C., Murphy B. Levels of feline infectious peritonitis virus in blood, effusions, and various tissues and the role of lymphopenia in disease outcome following experimental infection. Vet. Microbiol. 2015;175:157–166. - PMC - PubMed

Publication types

MeSH terms