

Informative missingness: What can we learn from patterns in missing laboratory data in the electronic health record?
- PMID: 36738870
- PMCID: PMC10849195
- DOI: 10.1016/j.jbi.2023.104306
Informative missingness: What can we learn from patterns in missing laboratory data in the electronic health record?
Abstract
Background: In electronic health records, patterns of missing laboratory test results could capture patients' course of disease as well as reflect clinician's concerns or worries for possible conditions. These patterns are often understudied and overlooked. This study aims to identify informative patterns of missingness among laboratory data collected across 15 healthcare system sites in three countries for COVID-19 inpatients.
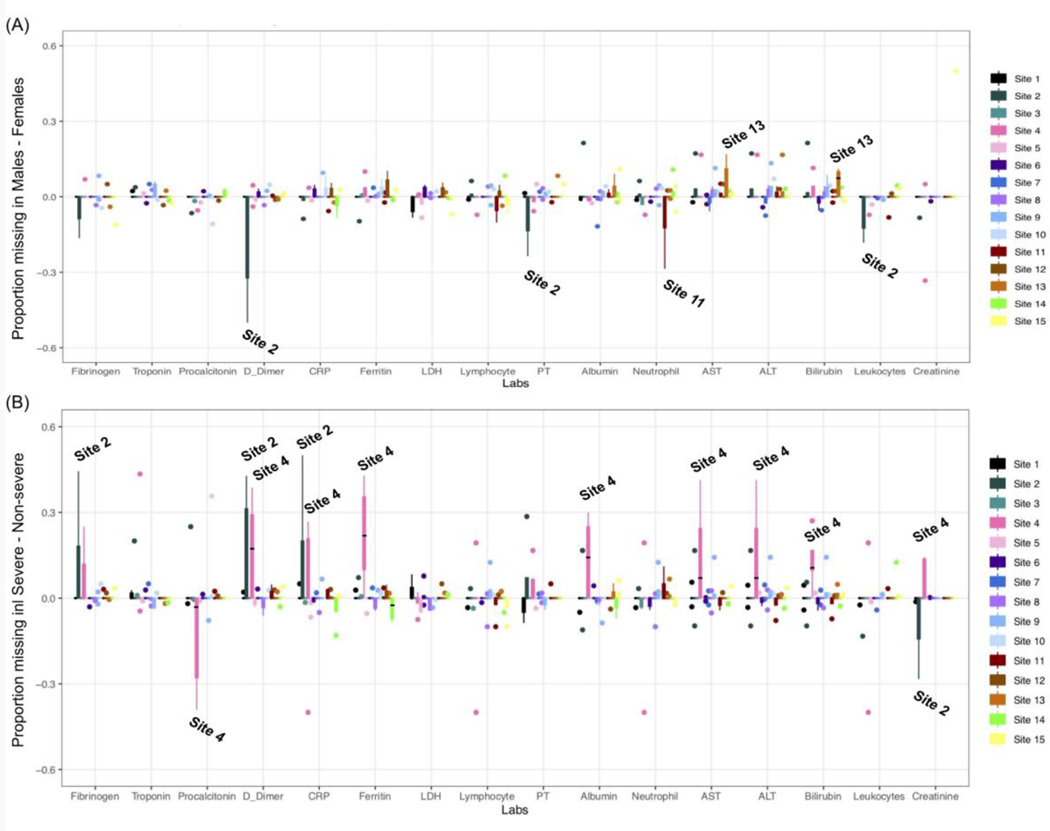
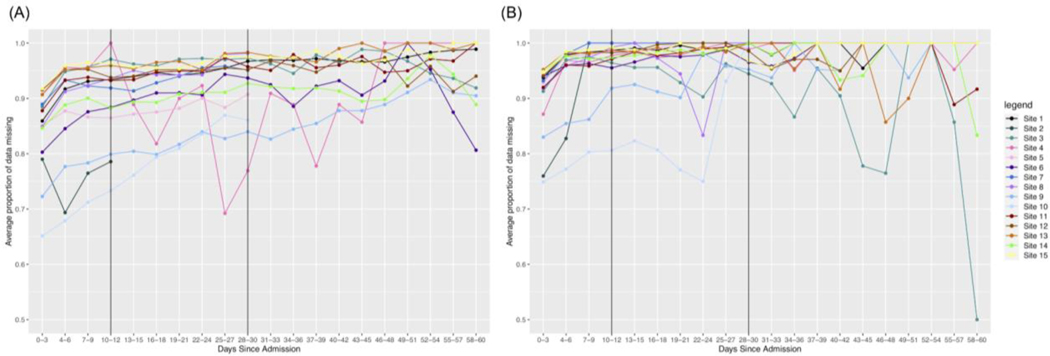
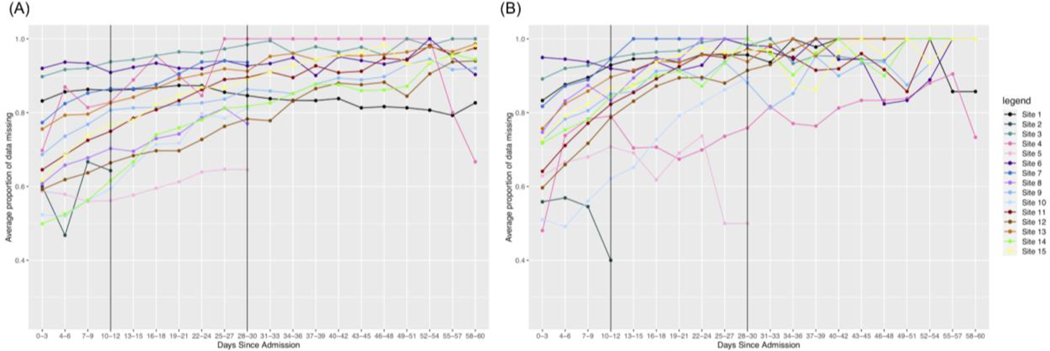
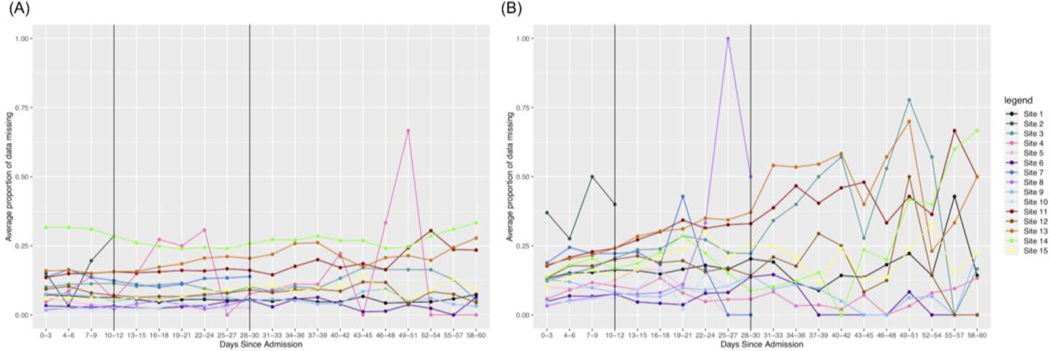
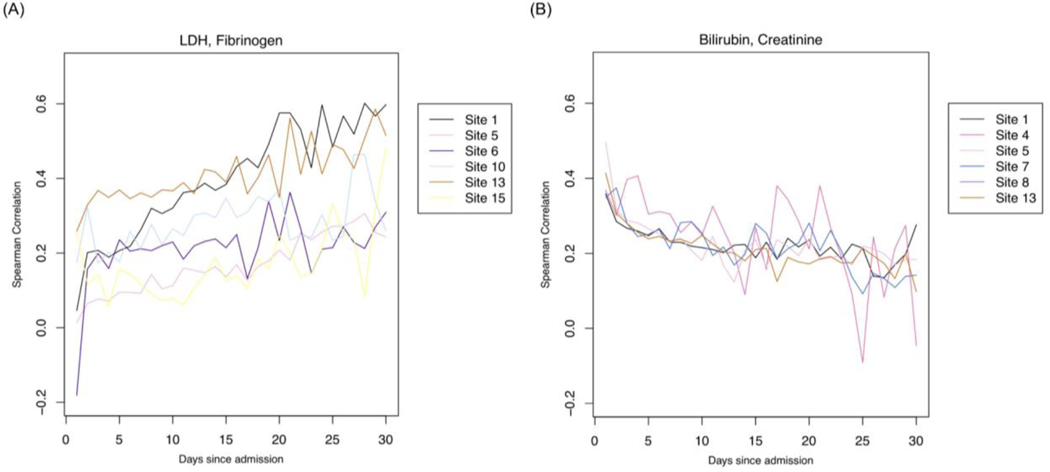
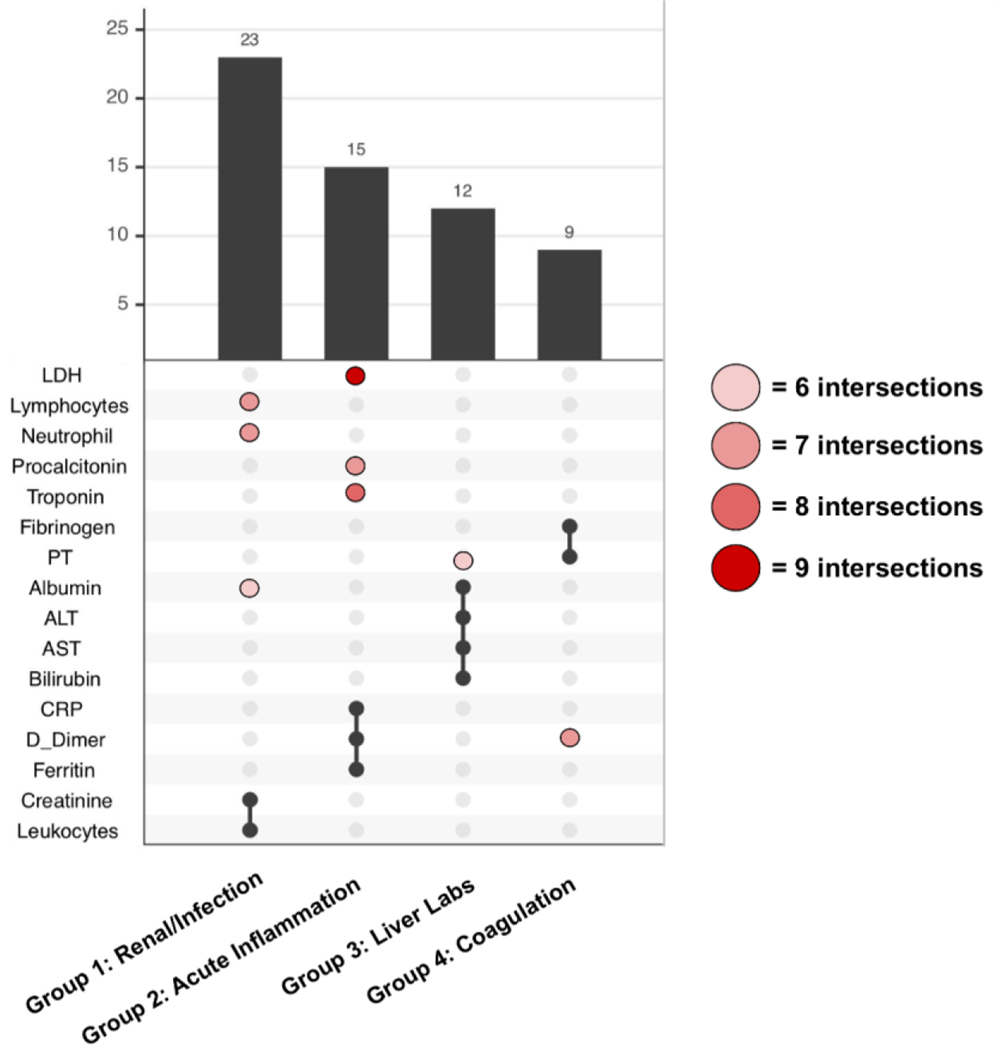
Methods: We collected and analyzed demographic, diagnosis, and laboratory data for 69,939 patients with positive COVID-19 PCR tests across three countries from 1 January 2020 through 30 September 2021. We analyzed missing laboratory measurements across sites, missingness stratification by demographic variables, temporal trends of missingness, correlations between labs based on missingness indicators over time, and clustering of groups of labs based on their missingness/ordering pattern.
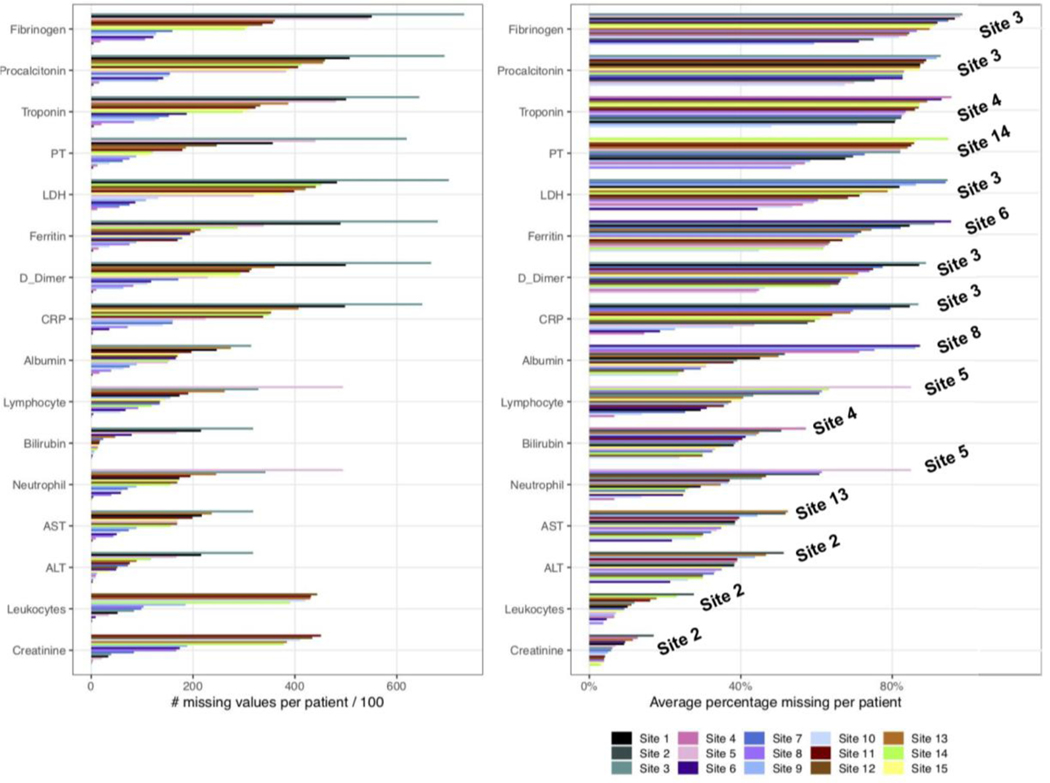
Results: With these analyses, we identified mapping issues faced in seven out of 15 sites. We also identified nuances in data collection and variable definition for the various sites. Temporal trend analyses may support the use of laboratory test result missingness patterns in identifying severe COVID-19 patients. Lastly, using missingness patterns, we determined relationships between various labs that reflect clinical behaviors.
Conclusion: In this work, we use computational approaches to relate missingness patterns to hospital treatment capacity and highlight the heterogeneity of looking at COVID-19 over time and at multiple sites, where there might be different phases, policies, etc. Changes in missingness could suggest a change in a patient's condition, and patterns of missingness among laboratory measurements could potentially identify clinical outcomes. This allows sites to consider missing data as informative to analyses and help researchers identify which sites are better poised to study particular questions.
Keywords: COVID-19; Electronic health records; Laboratory tests; Missing data; Multi-site health data.
Copyright © 2023 Elsevier Inc. All rights reserved.
Conflict of interest statement
Declaration of Competing Interest The authors declare that they have no known competing financial interests or personal relationships that could have appeared to influence the work reported in this paper.
Figures
References
-
- Dittmar MS, Zimmermann S, Creutzenberg M, Bele S, Bitzinger D, Lunz D, et al. Evaluation of comprehensiveness and reliability of electronic health records concerning resuscitation efforts within academic intensive care units: a retrospective chart analysis. BMC Emerg Med. 2021;21: 69. - PMC - PubMed
Publication types
MeSH terms
Grants and funding
- UM1 TR004404/TR/NCATS NIH HHS/United States
- UL1 TR000005/TR/NCATS NIH HHS/United States
- UL1 TR001857/TR/NCATS NIH HHS/United States
- UL1 TR001878/TR/NCATS NIH HHS/United States
- R01 NS098023/NS/NINDS NIH HHS/United States
- R01 NS124882/NS/NINDS NIH HHS/United States
- R01 GM124111/GM/NIGMS NIH HHS/United States
- T32 HD040128/HD/NICHD NIH HHS/United States
- P30 ES017885/ES/NIEHS NIH HHS/United States
- R01 LM013337/LM/NLM NIH HHS/United States
- U01 HG008685/HG/NHGRI NIH HHS/United States
- U24 HL148865/HL/NHLBI NIH HHS/United States
- R01 HG009174/HG/NHGRI NIH HHS/United States
- U24 CA210967/CA/NCI NIH HHS/United States
- R01 LM013345/LM/NLM NIH HHS/United States
- UL1 TR002541/TR/NCATS NIH HHS/United States
- UL1 TR002240/TR/NCATS NIH HHS/United States
- L40 HL148910/HL/NHLBI NIH HHS/United States
- UL1 TR002366/TR/NCATS NIH HHS/United States
- RF1 AG063481/AG/NIA NIH HHS/United States
- R00 LM012926/LM/NLM NIH HHS/United States
LinkOut - more resources
Full Text Sources
Medical
