

Metabolomic profiling in kidney cells treated with a sodium glucose-cotransporter 2 inhibitor
- PMID: 36739309
- PMCID: PMC9899225
- DOI: 10.1038/s41598-023-28850-3
Metabolomic profiling in kidney cells treated with a sodium glucose-cotransporter 2 inhibitor
Abstract
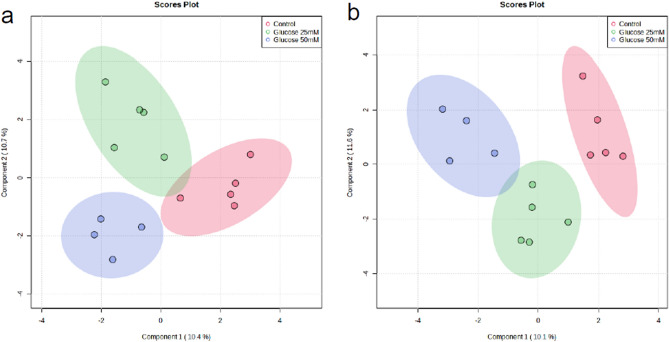
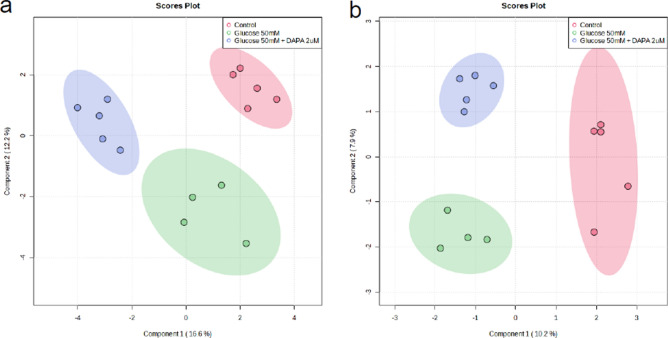
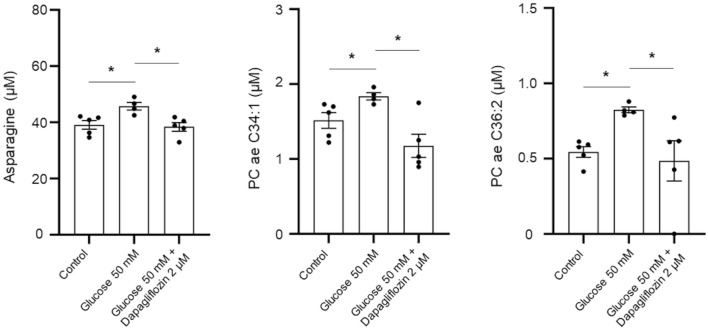
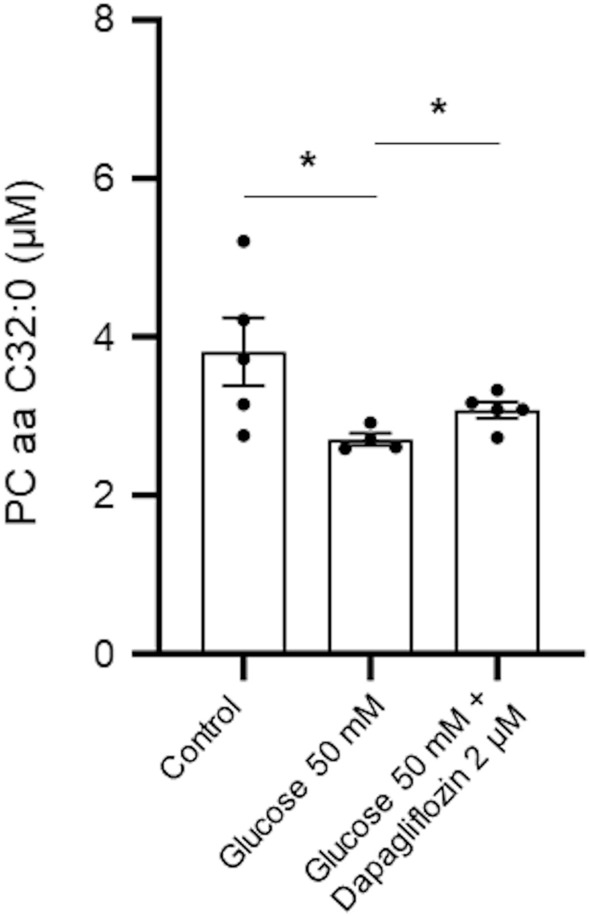
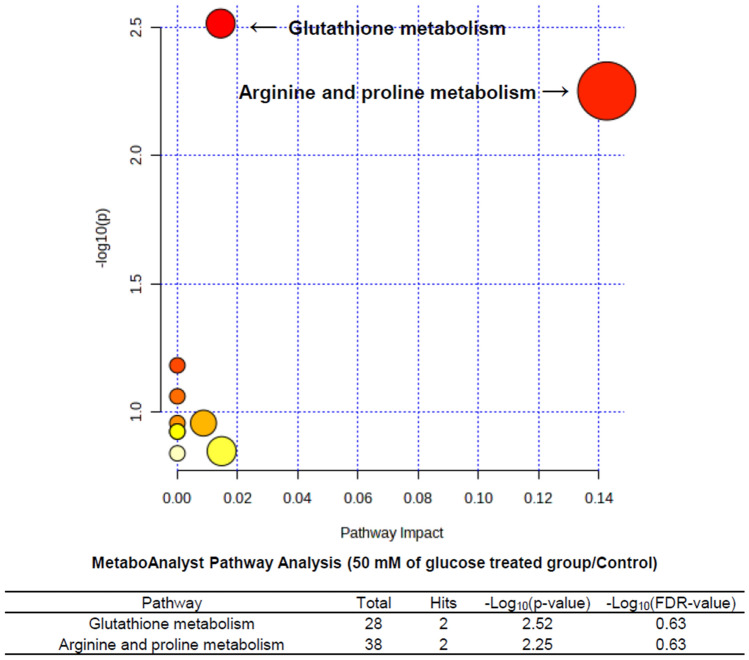
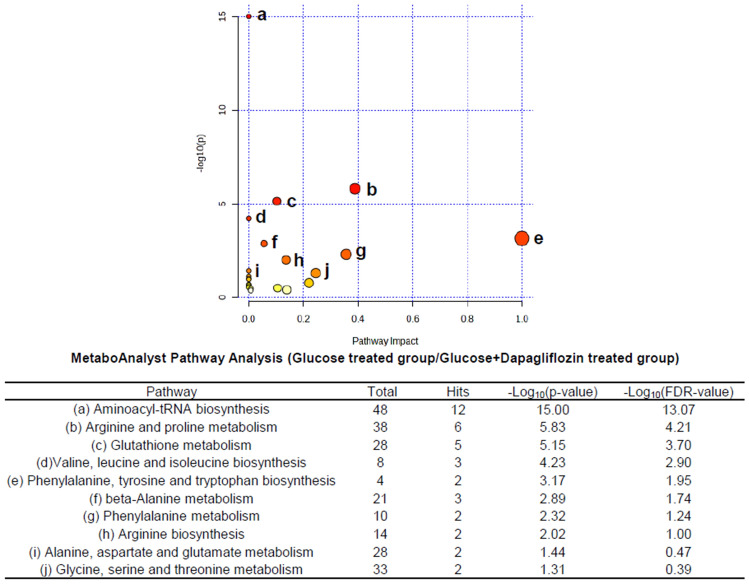
We aimed to determine the metabolomic profile of kidney cells under high glucose conditions and following sodium-glucose cotransporter 2 (SGLT2) inhibitor treatment. Targeted metabolomics using the Absolute IDQ-p180 kit was applied to quantify metabolites in kidney cells stimulated with high glucose (25 and 50 mM) and treated with SGLT2 inhibitor, dapagliflozin (2 µM). Primary cultured human tubular epithelial cells and podocytes were used to identify the metabolomic profile in high glucose conditions following dapagliflozin treatment. The levels of asparagine, PC ae C34:1, and PC ae C36:2 were elevated in tubular epithelial cells stimulated with 50 mM glucose and were significantly decreased after 2 µM dapagliflozin treatment. The level of PC aa C32:0 was significantly decreased after 50 mM glucose treatment compared with the control, and its level was significantly increased after dapagliflozin treatment in podocytes. The metabolism of glutathione, asparagine and proline was significantly changed in tubular epithelial cells under high-glucose stimulation. And the pathway analysis showed that aminoacyl-tRNA biosynthesis, arginine and proline metabolism, glutathione metabolism, valine, leucine and isoleucine biosynthesis, phenylalanine, tyrosine, and tryptophan biosynthesis, beta-alanine metabolism, phenylalanine metabolism, arginine biosynthesis, alanine, aspartate and glutamate metabolism, glycine, serine and threonine metabolism were altered in tubular epithelial cells after dapagliflozin treatment following 50 mM glucose compared to those treated with 50 mM glucose.
© 2023. The Author(s).
Conflict of interest statement
The authors declare no competing interests.
Figures
References
-
- Chao EC, Henry RR. SGLT2 inhibition—A novel strategy for diabetes treatment. Nat. Rev. Drug Discov. 2010;9:551–559. - PubMed
-
- Zinman B, et al. Empagliflozin, cardiovascular outcomes, and mortality in type 2 diabetes. N. Engl. J. Med. 2015;373:2117–2128. - PubMed
-
- Neal B, et al. Canagliflozin and cardiovascular and renal events in type 2 diabetes. N. Engl. J. Med. 2017;377:644–657. - PubMed
-
- Wiviott SD, et al. Dapagliflozin and cardiovascular outcomes in type 2 diabetes. N. Engl. J. Med. 2019;380:347–357. - PubMed
-
- Perkovic V, et al. Canagliflozin and renal outcomes in type 2 diabetes and nephropathy. N. Engl. J. Med. 2019;380:2295–2306. - PubMed
Publication types
MeSH terms
Substances
LinkOut - more resources
Full Text Sources
